Published online Jan 27, 2025. doi: 10.4240/wjgs.v17.i1.97148
Revised: October 10, 2024
Accepted: November 22, 2024
Published online: January 27, 2025
Processing time: 217 Days and 11.4 Hours
Unraveling the pathogenesis of colorectal cancer (CRC) can aid in developing prevention and treatment strategies. Aurora kinase A (AURKA) is a key par
To compare effects of AURKA and TPX2 and their combined knockdown on CRC cells.
We evaluated three CRC gene datasets about CRC (GSE32323, GSE25071, and GSE21510). Potential hub genes associated with CRC onset were identified using the Venn, search tool for the retrieval of interacting genes, and KOBAS platforms, with AURKA and TPX2 emerging as significant factors. Subsequently, cell models with knockdown of AURKA, TPX2, or both were constructed using SW480 and LOVO cells. Quantitative real-time polymerase chain reaction, western blotting, cell counting kit-8, cell cloning assays, flow cytometry, and Transwell assays were used.
Forty-three highly expressed genes and 39 poorly expressed genes overlapped in cancer tissues compared to controls from three datasets. In the protein-protein interaction network of highly expressed genes, AURKA was one of key genes. Its combined score with TPX2 was 0.999, and their co-expression score was 0.846. In CRC cells, knockdown of AURKA, TPX2, or both reduced cell viability and colony number, while blocking G0/G1 phase and enhancing cell apoptosis. Additionally, they were weakened cell proliferation and migration abilities. Furthermore, the expression levels of B-cell lymphoma-2-Associated X, caspase 3, and tumor protein P53, and E-cadherin in
Combined knockdown of AURKA and TPX2 was effective in suppressing the malignant phenotype in CRC. Co-inhibition of gene expression is a potential developmental direction for CRC treatment.
Core Tip: In this study, we evaluated three gene datasets and identified 13 crucial genes. Results from SW480 and LOVO cells showed that Aurora kinase A (AURKA) and the targeting protein for Xklp2 (TPX2) blocked cell cycle progression and promoted cell apoptosis of colorectal cancer (CRC). Knockdown of either AURKA, TPX2, or both reduced the invasion and migration ability of CRC cells while inhibiting epithelial-mesenchymal transition. Co-knockdown of AURKA and TPX2 enhanced the inhibition of CRC cells. Combined knockdown was more effective in suppressing the malignant phenotype in CRC, providing ideas and basic data for CRC treatment.
- Citation: Sheng GX, Zhang YJ, Shang T. Synergistic inhibition of colorectal cancer progression by silencing Aurora A and the targeting protein for Xklp2. World J Gastrointest Surg 2025; 17(1): 97148
- URL: https://www.wjgnet.com/1948-9366/full/v17/i1/97148.htm
- DOI: https://dx.doi.org/10.4240/wjgs.v17.i1.97148
Globally, colorectal cancer (CRC) is responsible for the top three number of new cancer cases and cancer-related deaths[1], and is also the top three most common cancer in both males and females. The rectum and sigmoid colon are the most common locations in CRC[2]. While the overall occurrence in individuals over 50 years old stabilizes or declines with improved health standards, younger cohorts still face growing risks[3]. Several factors increase the risk of early-onset CRC[4], including genetic predisposition, poor diet, lack of exercise, smoking, obesity, and diabetes. The precise me
The Aurora kinase A (AURKA) is a key participant in mitotic control[5]. AURKA activity can be regulated by the self-phosphorylation of Thr288 and its interaction with its coactivator, the targeting protein for Xklp2 (TPX2) microtubule nucleation factor[6]. AURKA is implicated in regulating cellular processes, such as proliferation and angiogenesis[7]. In patients with CRC, AURKA is frequently amplified and overexpressed[8], which has been linked to poor clinical out
Collecting data: National center of biotechnology information gene expression omnibus (GEO) is a professional genetic database that provides gene datasets for cancer and other diseases. Using CRC as the keyword, we collected three relevant datasets from the GEO database (GSE32323, GSE25071, and GSE21510) (https://www.ncbi.nlm.nih.gov/geo/) (their information is provided in Table 1).
| GEO | Group | n | Stage | Tissue | Gene number |
| GSE21510 | CN | 12 | 0-2 | Normal | 715 |
| CRC | 8 | 1-2b | Cancer | ||
| GSE25071 | CN | 3 | 0 | Colon | 788 |
| CRC | 7 | I-II | Primary tumor | ||
| GSE32323 | CN | 9 | 1-2 | Normal | 446 |
| CRC | 9 | 1-2b | Cancer |
Analyzing data: Screening genes were based on |Log2 fold change (FC)|> 2 and adjusted P value < 0.05. Based on normal tissues, low- and high-expression groups were analyzed separately to perform the intersection of three datasets. The potential target genes were screened using network pharmacological analysis. Protein-protein interaction (PPI) networks and Kyoto encyclopedia of genes and genomes (KEGG) pathway enrichment analysis were performed using Venn, search tool for the retrieval of interacting genes (STRING), and KOBAS.
Visualization: Visualization tools were used for both the data analysis and presentation. OmicShare tools were used to generate Venn plots (https://www.omicshare.com/tools/home/report/reportvenn.html). STRING (version 12.0)[11] was a website to integrate all publicly available PPI information sources. Cytoscape (version 3.9.1)[12] was used to ana
Expression analysis of target genes: We obtained gene expression levels and overall survival curves using gene expression profiling interactive analysis (GEPIA)[14]. Photographs showing AURKA protein expression in human colonic adenocarcinoma (COAD) tissues and normal colon samples were obtained from the human protein atlas (https://www.proteinatlas.org/). The website for obtaining normal colon tissue photos is https://www.proteinatlas.org/ENS G00000087586-AURKA/tissue/colonimg; the website for obtaining COAD tissue photos is: (https://www.proteinatlas.org/ENSG00000087586-AURKA/pathology/colorectal+cancerimg).
SW480 (iCell-h204; iCell Bioscience, China), HCT116 (iCell-h071; iCell Bioscience), and LOVO (iCell-h126; iCell Bio
Lipo6000 transfection reagent (C0526-1.5 mL, Beyotime, China), plasmids carried short hairpin (sh) RNA (shRNA) against AURKA or TPX2 mRNA, and blank vector plasmid (Genechem Co., Ltd., China) was used for transfection. Briefly, cells were incubated with 125 μL premixed liquid containing Lipo6000, Dulbecco’s modified eagle medium, and 2.5 mg shRNA for 25 minutes. The dosage was based on the Lipo6000 instructions. After 48 hours of transfection, quantitative real-time polymerase chain reaction (qPCR), as well as western blotting (WB) were used for the quantitative analysis of transfection efficiency. SW480 and LOVO cells were divided into four groups: Negative control (NC) of shRNA (sh-NC), sh-AURKA, sh-TPX2, and sh-AURKA + sh-TPX2.
Total RNA was extracted from SW480 and LOVO cells using accurate biology reagents (AG21024; China). The mixed liquid of cells and lysate was added to 70% ethanol and used to collect total RNA through multiple centrifugations and elution according to instructions of RNA instructions. Subsequently, the RNA was subjected to reverse transcription and qPCR using a HiFiScript cDNA synthetic kit (CW2569M, CWBIO, China) and a SYBR Green qPCR kit (11201ES03, Yesaen, China) according to the kits’ instructions. All the reactions were performed using a LightCycler 96 instrument (Roche, Germany). Human beta-actin gene served as a housekeeping gene. Primer sequences are listed in Table 2 and the 2-ΔΔCt method were used for qPCR.
| Gene | Forward primer | Reverse primer |
| Human AURKA | 5’-TGGGTGGTCAGTACATGCTC-3’ | 5’-TGCATCCGACCTTCAATCATTTC-3’ |
| Human TPX2 | 5’-ACTTCCGCACAGATGAGCG-3’ | 5’-GGATGCTTTCGTAGTTCAGATGT-3’ |
| Human β-actin | 5’-GATGACCCAGATCATGTTTGAG-3’ | 5’-TAATGTCACGCACGATTTCC-3’ |
Total protein samples from SW480 and LOVO cells were collected using a lysis solution (89901, Thermo, United States). The samples and loading buffer (P10015, Beyotime, China) were mixed at a ratio of 1:5 and boiled for 5 minutes. Subsequently, 20 μL samples were separated and transferred to activated PVDF membranes (10600023, GE Healthcare Life, United States) using electrophoresis. After blocking, the membranes were incubated with antibodies. The antibodies used are listed in Table 3. Finally, the membranes were visualized and analyzed using a gel imaging instrument (610020-9Q, Qing Xiang, China) and ImageJ software (NIH, United States).
| Antibody | Manufacturer | No. | Dilution ratio |
| AURKA antibody | Affinity | BF0123 | 1:2000 |
| TPX2 antibody | Abcam | ab264124 | 1:5000 |
| Cyclin B1 antibody | Affinity | AF6168 | 1:2000 |
| CDK1 antibody | Abcam | ab133327 | 1:15000 |
| CDK2 antibody | Affinity | AF6237 | 1:2000 |
| Bax antibody | Abcam | ab182733 | 1:2000 |
| Bcl-2 antibody | Affinity | AF6139 | 1:2000 |
| Caspase-3 antibody | Proteintech | 19677-1-AP | 1:10000 |
| p53 antibody | Affinity | AF0879 | 1:2000 |
| N-cadherin antibody | Affinity | AF4039 | 1:2000 |
| E-cadherin antibody | Proteintech | 20874-1-AP | 1:5000 |
| Vimentin antibody | Zenbio | R22775 | 1:1000 |
| p-AURKA antibody | Affinity | AF3011 | 1:2000 |
| β-actin antibody | Proteintech | 81115-1-RR | 1:20000 |
| Anti-rabbit IgG, HRP-linked antibody | CST | 7074 | 1:10000 |
A cell counting kit-8 (CCK-8) and cell cloning assays were used to evaluate cell proliferation. The CCK-8 kit (C0037; Beyotime, China) was used according to the manufacturer’s instructions. Briefly, transfected cells (1 × 10³ cells/well) were cultured with complete mediums for 12 hours, 24 hours, and 48 hours. Fresh culture medium containing 10 μL CCK-8 reagent replaced the complete medium incubating for 4 hours. The optical density (OD) at 450 nm was directly proportional to the cell viability and was detected using a CMaxPlus microplate reader (Molecular Devices, United States). Transfected cells (400 cells/well, 24-well plate) were cultured for 10 days and then fixed. Formed colonies were stained with 0.1% crystal violet (548-62-9; Qiangshun, China) for 2 minutes. The number of colonies (over 20 cells)[15] was counted using an optical microscope (AE2000; Motic, China).
Flow cytometry (FCM) was used to evaluate the cell cycle progression and the rate of apoptosis. After 48 hours of transfection, cells were collected using trypsin and centrifuged. After washing with phosphate buffered saline, the cells were fixed with 75% ethanol at -20 °C for 2 hours. Then, cells were centrifugated at 200 g for 10 minutes and were incubated with 0.25% Triton X-100 at 5 °C for 4 minutes. After centrifugation, the cells (1 × 10⁷ cells/mL) were stained with propidium iodide/RNase staining buffer (550825, BD, United States) in the dark for 30 minutes. After the cells were washed, centrifuged, and resuspended, the cell cycle was analyzed using a NovoCyte flow cytometer (Agilent, United States). For apoptosis assessment, an Apoptosis detection kit (556547, BD Biosciences) was used. After dealing with working reagents, each tube with 100 μL cells (1 × 10⁶ cells/mL) was added 400 μL binding buffer to analyze using a flow cytometer (NovoCyte, Agilent, United States).
Transwell assays were performed using a Transwell chamber (8.0 μm pore, Corning, United States) with Matrigel (356234, BD, United States) or not for invasion or migration assay. Cells (5 × 10⁴) were seeded in the upper chamber with basal medium and 1% FBS. The lower chamber was supplemented with basal medium and 10% FBS. Whether the migration assay or invasion assay, cells were cultured for 24 hours, and then were blocked and stained with 4% paraformaldehyde and 0.1% crystal violet. The cells were counted using an optical microscope (ICX41, Sunny, China).
We used statistical product and service solutions (version 20.0; IBM Corp., Armonk, NY, United States) and GraphPad Prism 9 (GraphPad software, San Diego, CA, United States) for statistical analysis. All data were presented as mean ± SD. Measurements from multiple datasets were analyzed via one-way analysis of variance and the Tukey post hoc test. A significance level threshold of less than 0.05 denoted a statistically relevant finding.
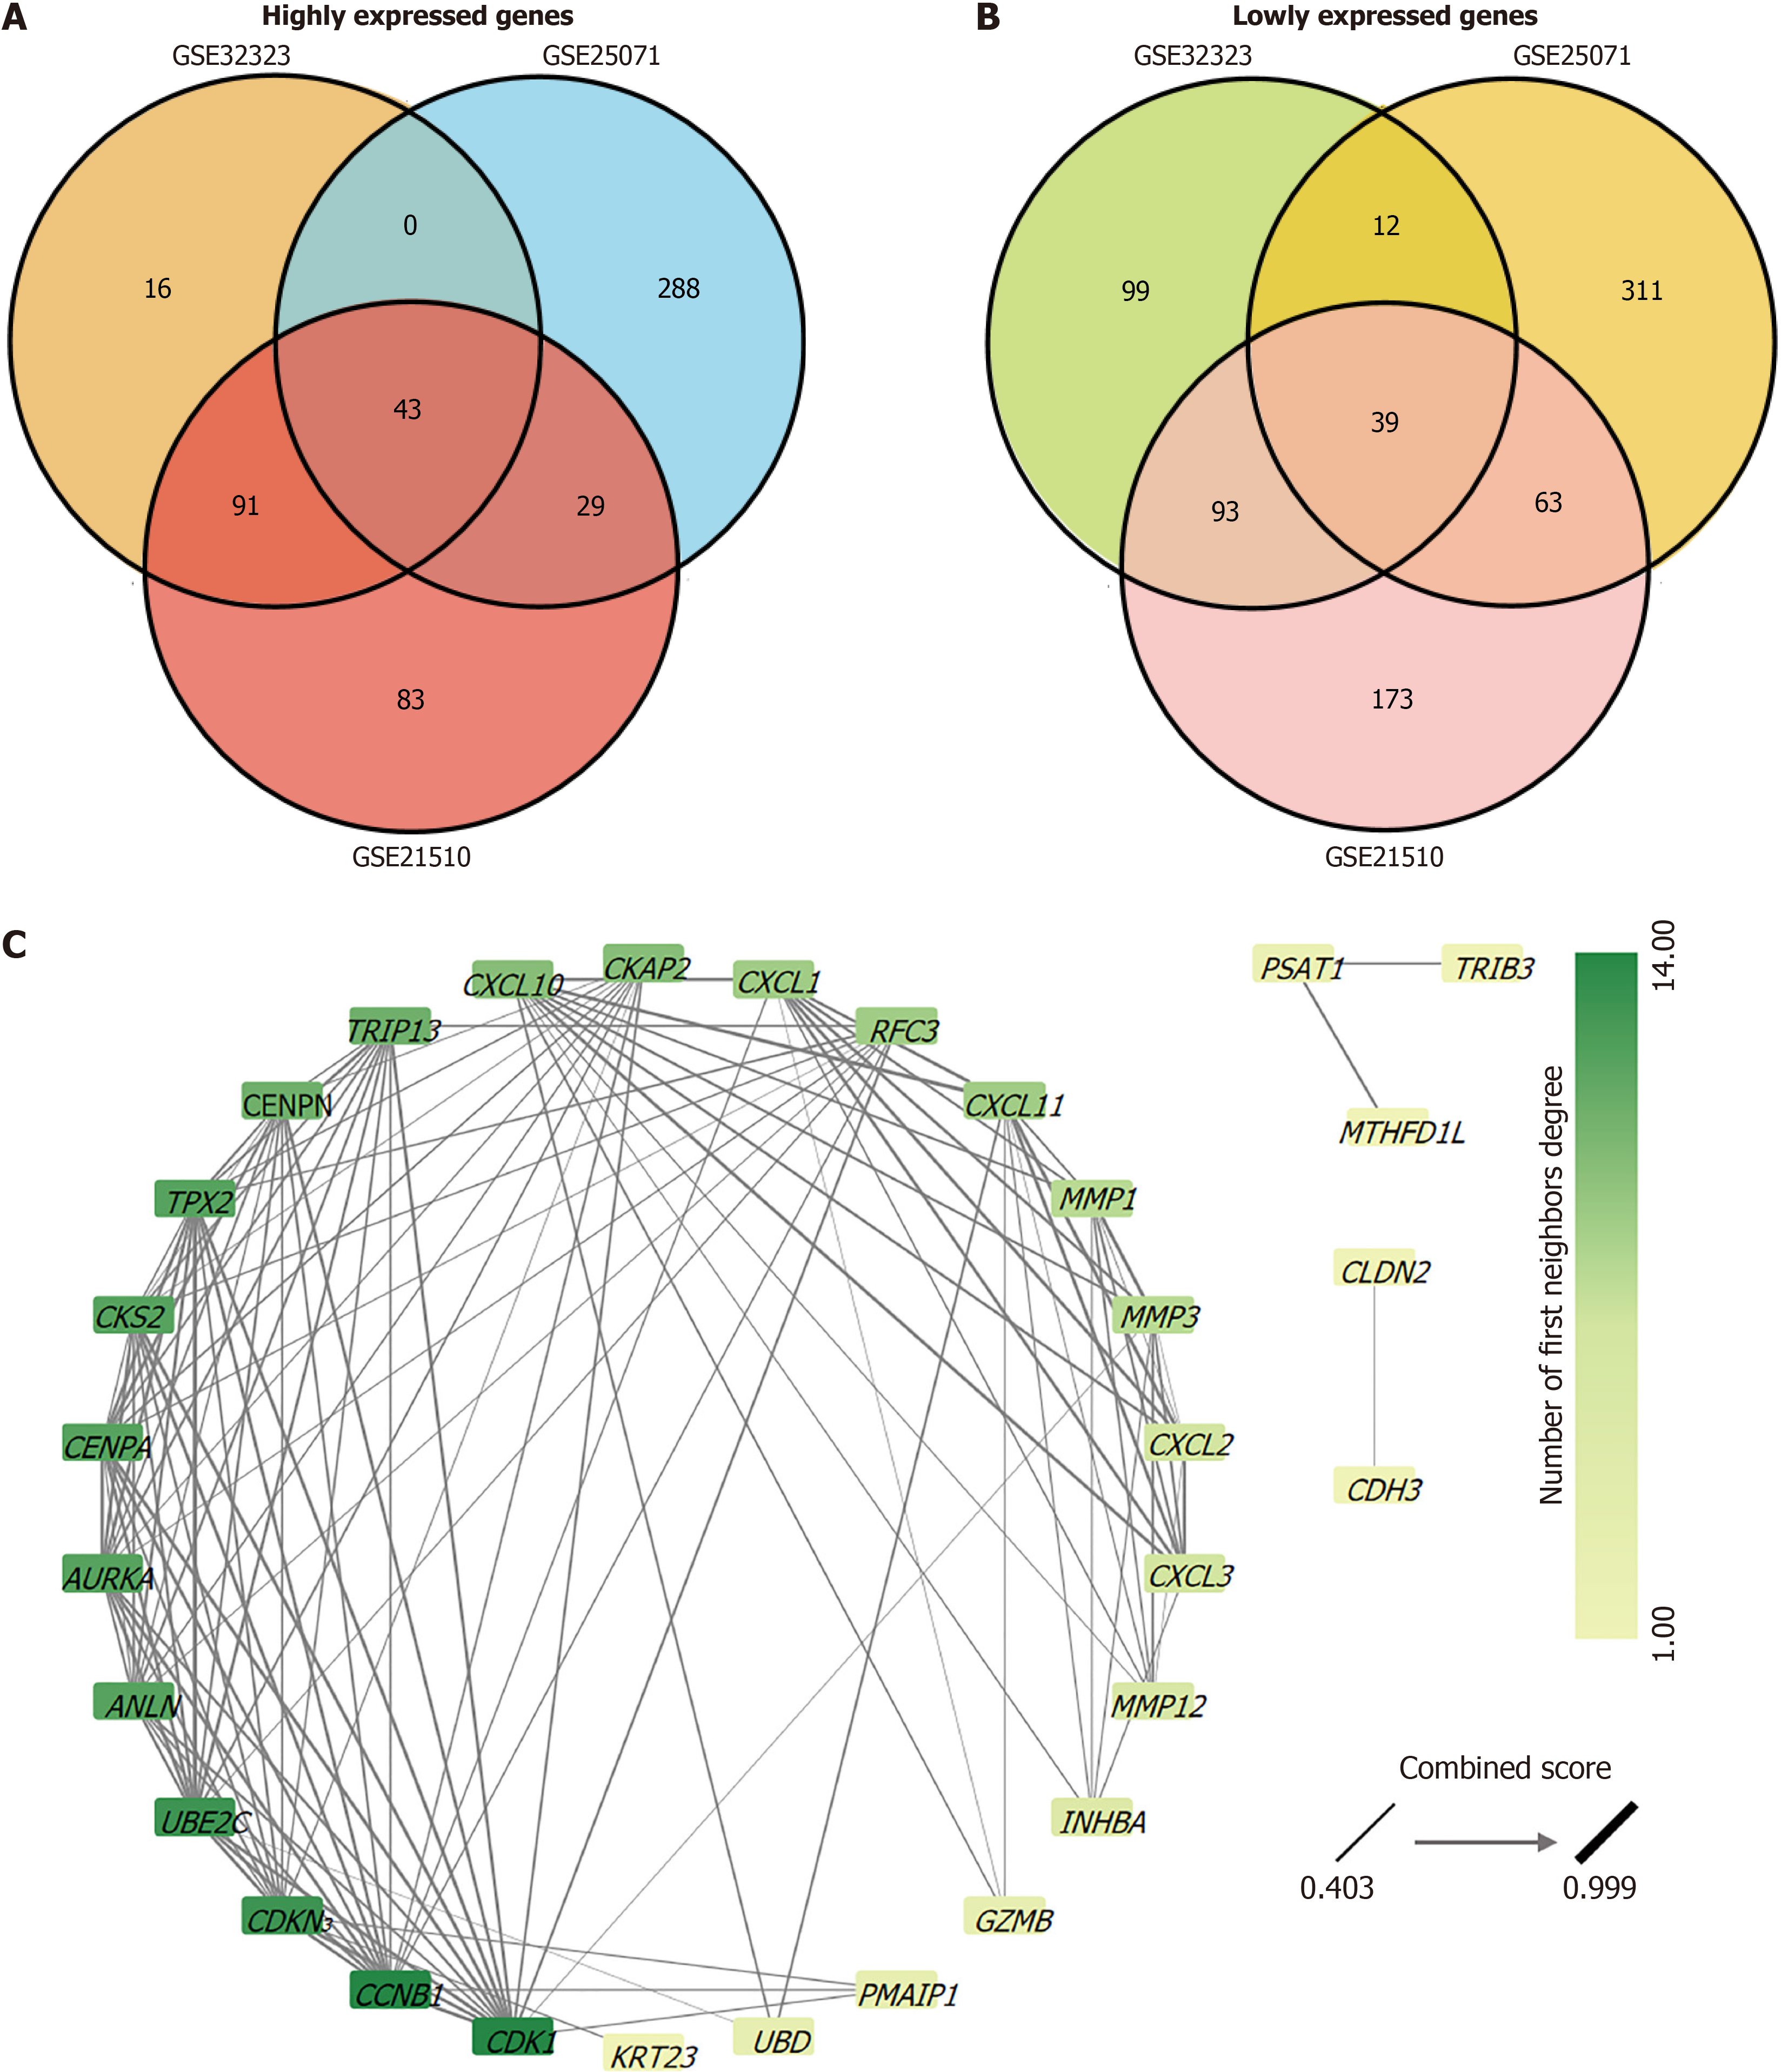
After analysis of the CRC gene chip data (GSE21510, GSE25071, and GSE32323), we obtained three gene lists for comparison between normal tissues and CRC tissues. There were 715, 788, and 466 genes in GSE21510, GSE25071, and GSE32323 datasets, respectively (Table 1). Based on the screening criteria |Log2 (FC)| > 2 and an adjusted P value < 0.05, we identified genes whose expression levels showed significant differences between normal and CRC tissues. GSE21510: Highly expressed genes (246) and downregulated genes (368); GSE25071: Highly expressed genes (360) and downregulated genes (425); GSE32323: Highly expressed genes (153) and downregulated genes (243). Subsequently, Venn diagrams were used to analyze highly/lowly expressed genomic intersections separately. There are 43 highly expressed genes and 39 poorly expressed genes overlapped in the three datasets (Figure 1A and B). Highly or weakly expressed genes were analyzed using STRING and two PPI networks were obtained (Supplementary Figure 1). As the PPI network of the highly expressed gene interaction network was more complex, we chose the PPI network of highly expressed genes for Cytoscape analysis (Figure 1C). The average number of neighboring nodes was nine. Thirteen key genes (degree > 9) were identified: CCNB1, CDK1, CDKN3, UBE2C, ANLN, AURKA, CENPA, CKS2, TPX2, CENPN, TRIP13, CKAP2, and CXCL10 (Table 4). In addition, AURKA and TPX2 showed strong interactions with each other (Table 5). STRING analysis showed that the combined score of AURKA and TPX2 was 0.999, and their co-expression score was 0.846.
| No. | Node | Degrees |
| 1 | CCNB1 | 14 |
| 2 | CDK1 | 14 |
| 3 | CDKN3 | 13 |
| 4 | UBE2C | 13 |
| 5 | ANLN | 12 |
| 6 | AURKA | 12 |
| 7 | CENPA | 12 |
| 8 | CKS2 | 12 |
| 9 | TPX2 | 12 |
| 10 | CENPN | 11 |
| 11 | TRIP13 | 11 |
| 12 | CKAP2 | 10 |
| 13 | CXCL10 | 10 |
| Node 1 | Node 2 | Co-expression | Experimentally determined interaction | Database annotated | Combined score |
| CCNB1 | CDK1 | 0.895 | 0.999 | 0.9 | 0.999 |
| AURKA | TPX2 | 0.846 | 0.988 | 0.9 | 0.999 |
| CXCL10 | CXCL11 | 0.824 | 0.994 | 0.9 | 0.999 |
| CDK1 | CKS2 | 0.689 | 0.992 | 0 | 0.999 |
| CCNB1 | CKS2 | 0.688 | 0.978 | 0 | 0.999 |
| CENPA | CENPN | 0.407 | 0.955 | 0.5 | 0.999 |
| CXCL11 | CXCL2 | 0.107 | 0.994 | 0.5 | 0.999 |
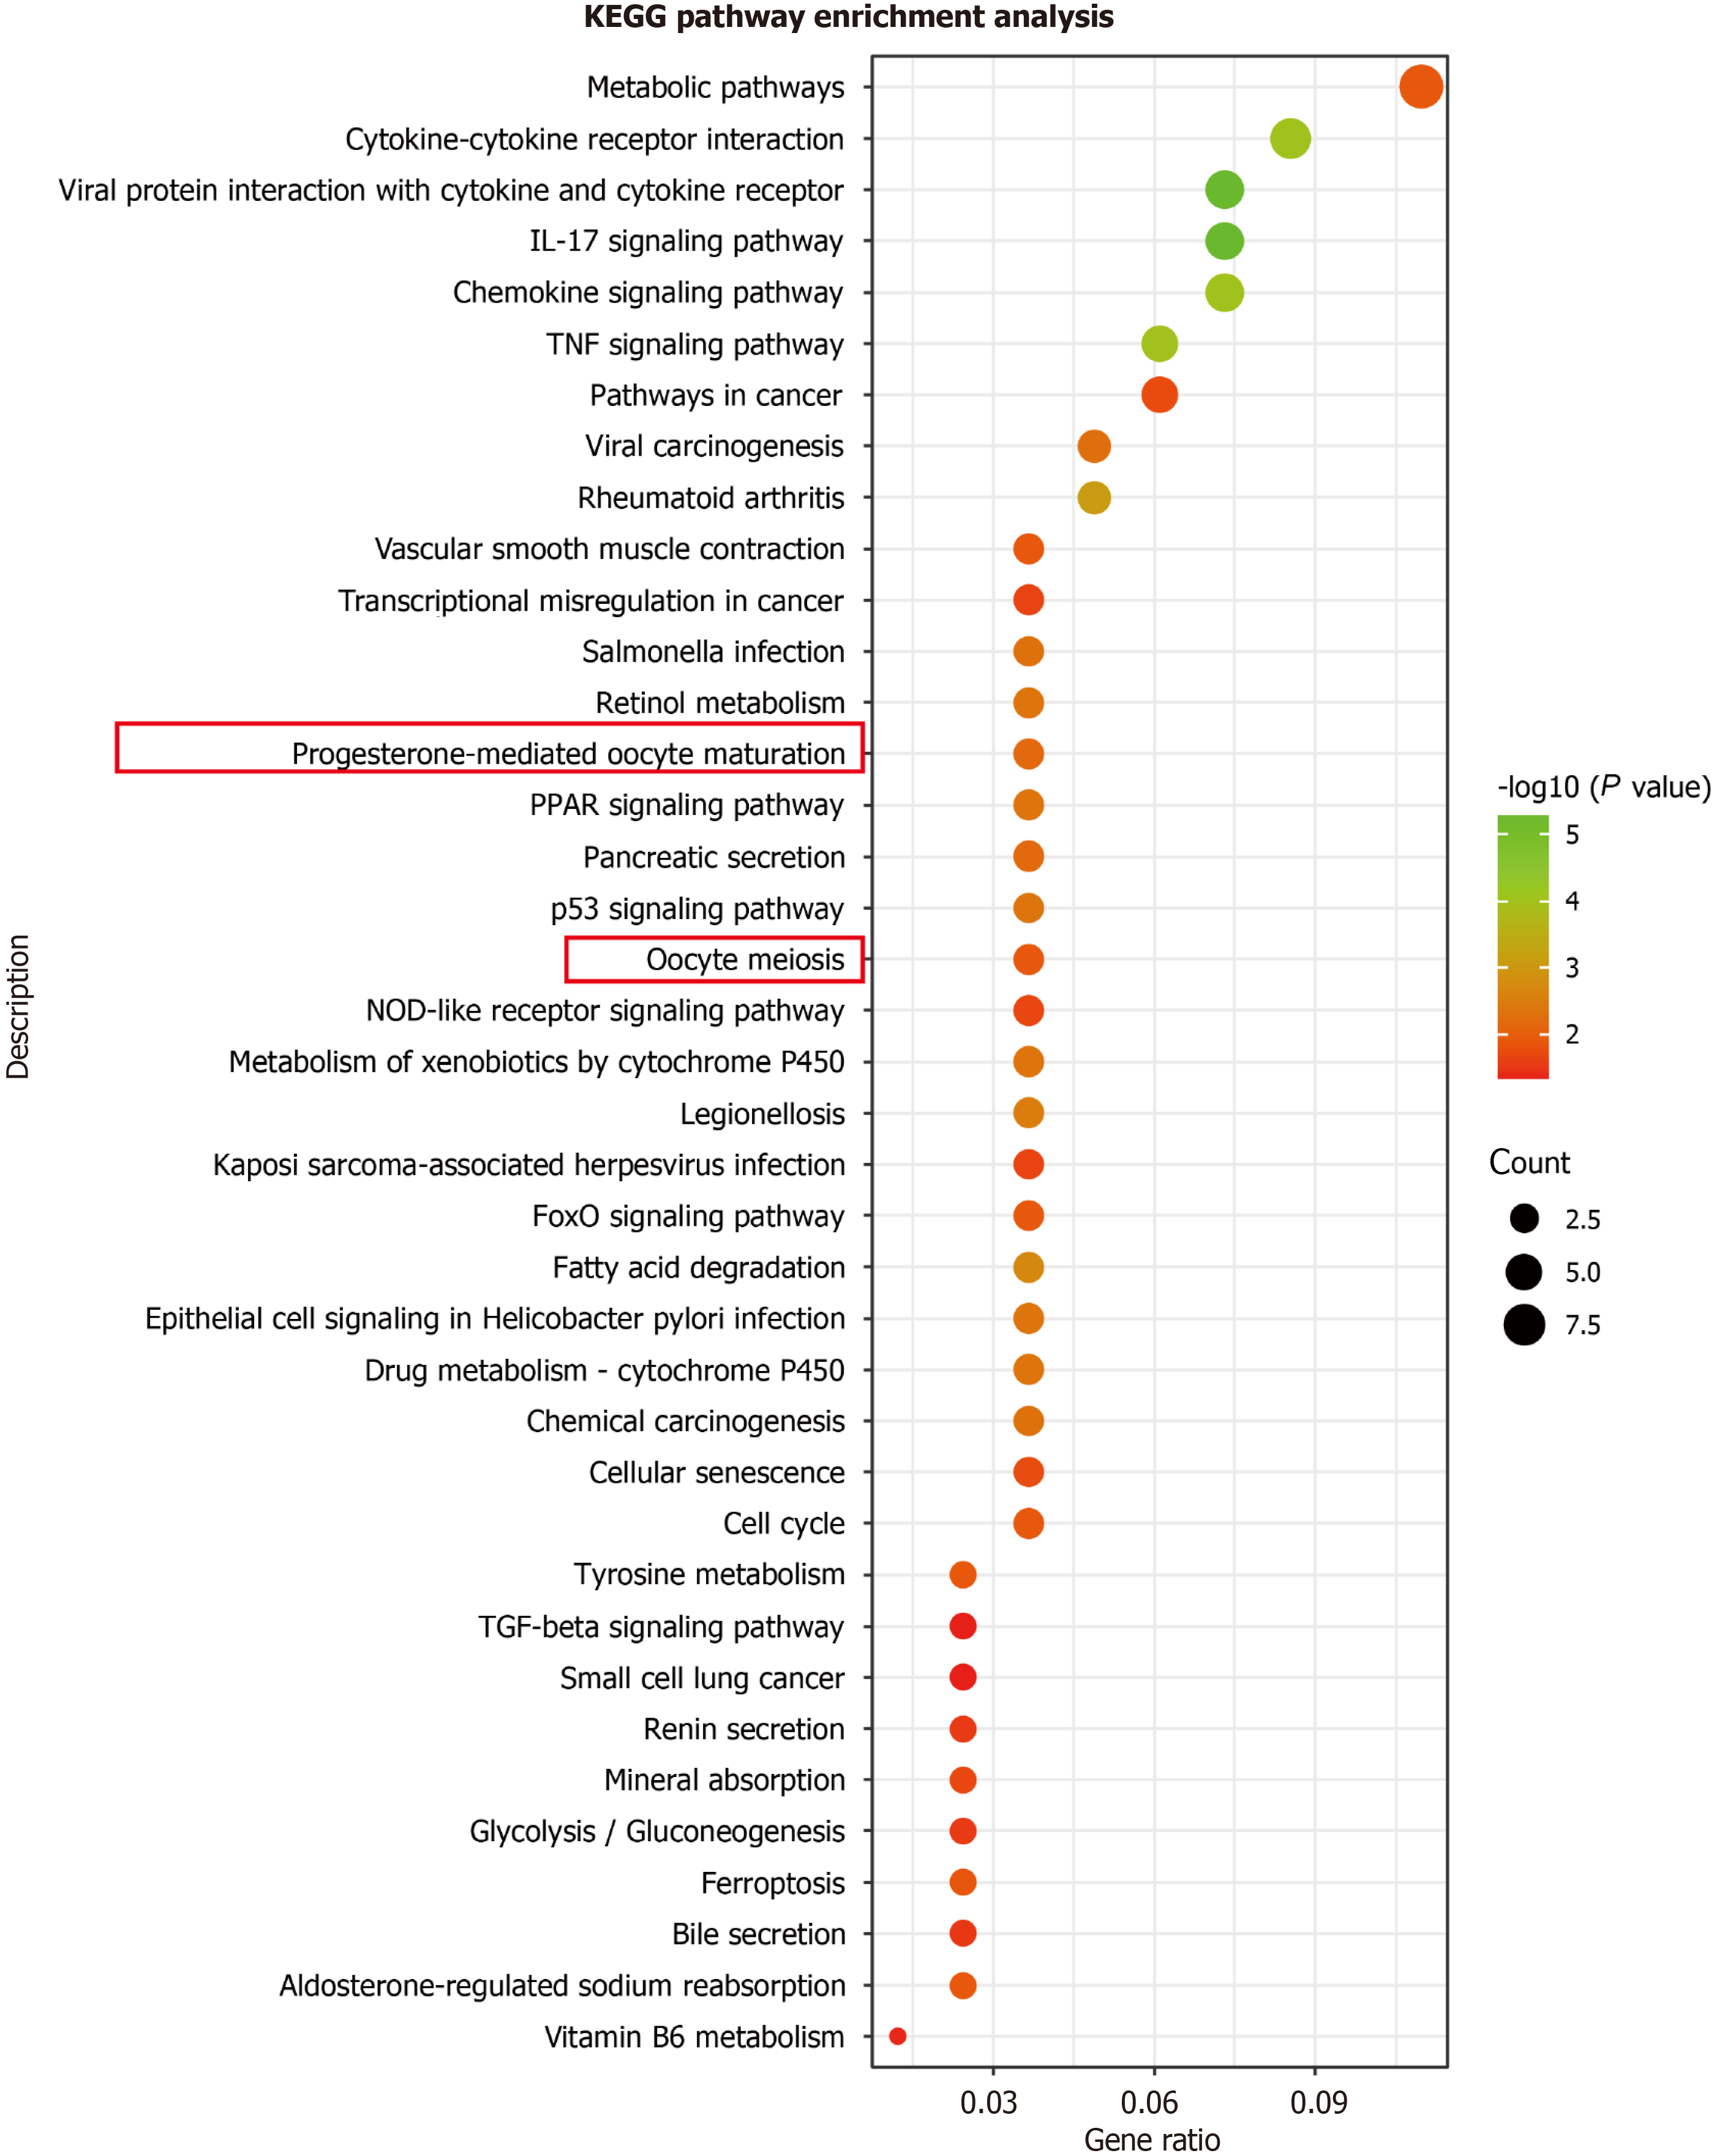
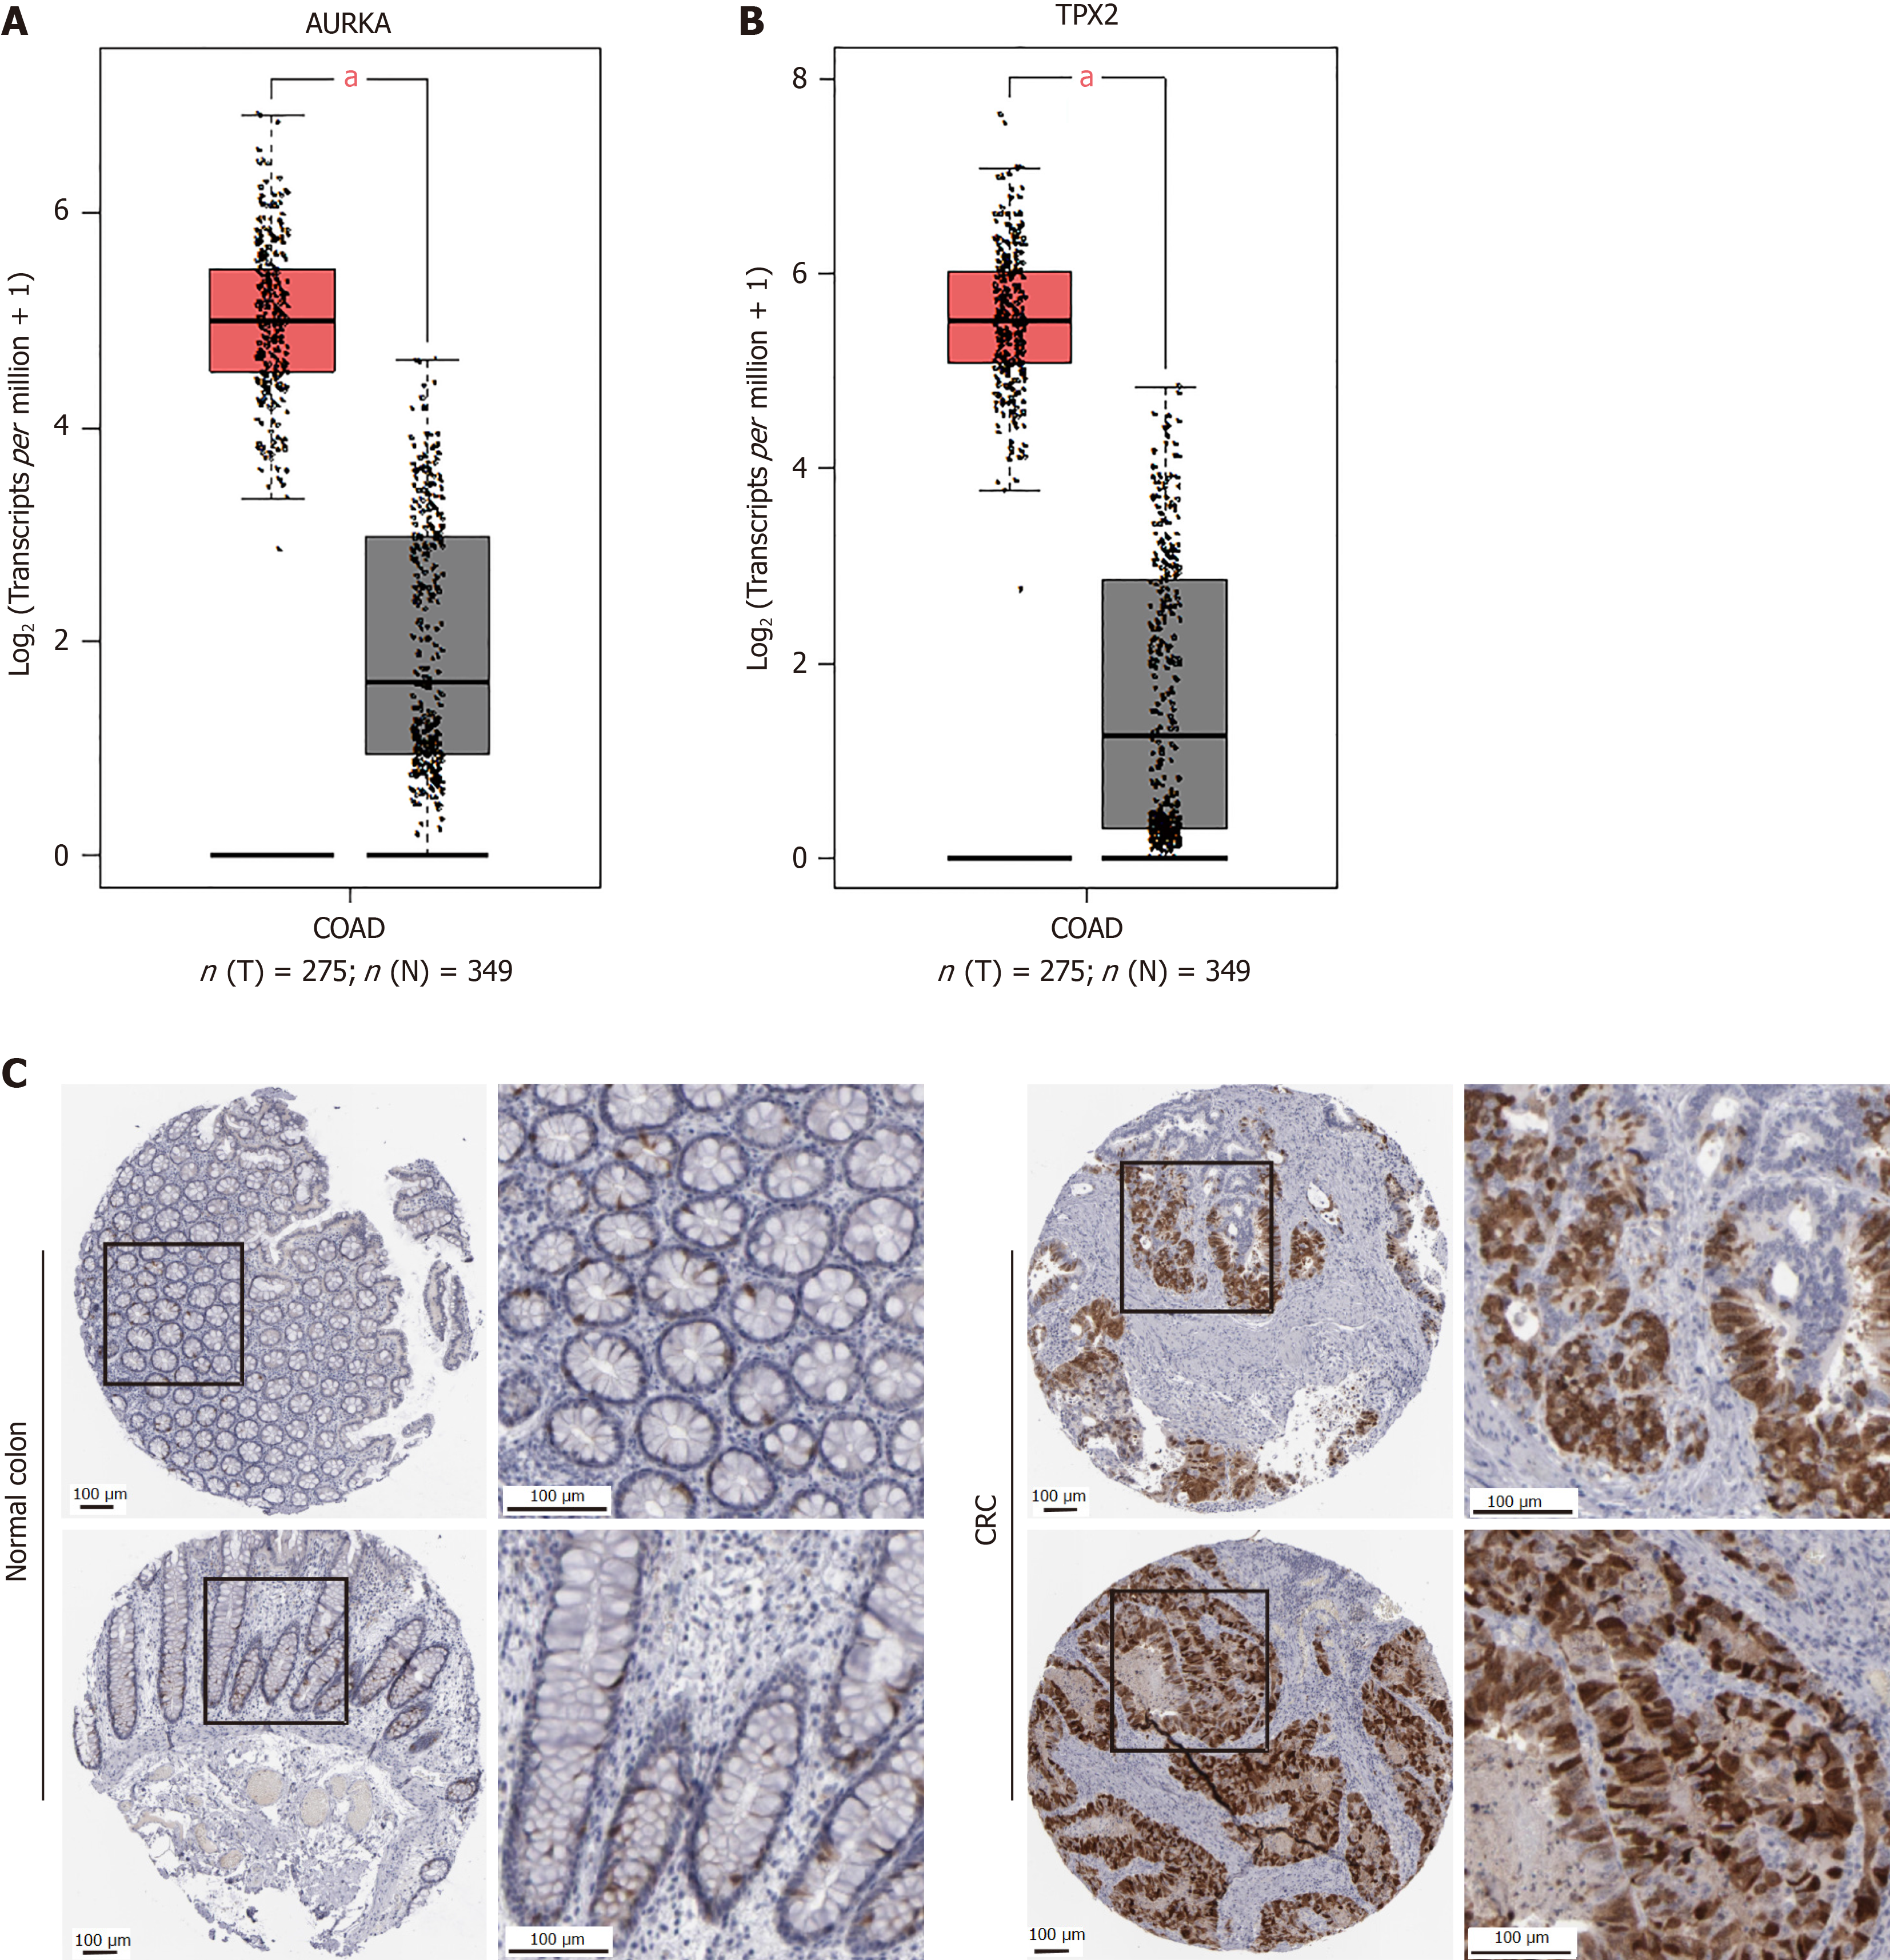
Additionally, AURKA takes part in the progesterone-mediated oocyte maturation (P = 0.00129) and oocyte meiosis (P = 0.013128) pathways (Figure 2). Furthermore, we retrieved AURKA and TPX2 from GEPIA and found that they were highly expressed in COAD tissues (Figure 3A and B). Scientists have found a significant correlation between AURKA expression and a low survival rate in CRC liver metastasis (hazard ratio = 1.55, P < 0.01)[16]. Furthermore, AURKA expression was observed in COAD clinical samples (Figure 3C). The human protein atlas showed that in colon gland cells of normal tissues, AURKA was expressed at low levels (positive rate < 25%), whereas it was highly expressed in CRC (Figure 3C). Scientific research confirms the coexistence of AURKA and TPX2 in CRC and that they participate in the occurrence of CRC[17]. Thus, our study focused on these proteins in the malignant phenotype of CRC cells.
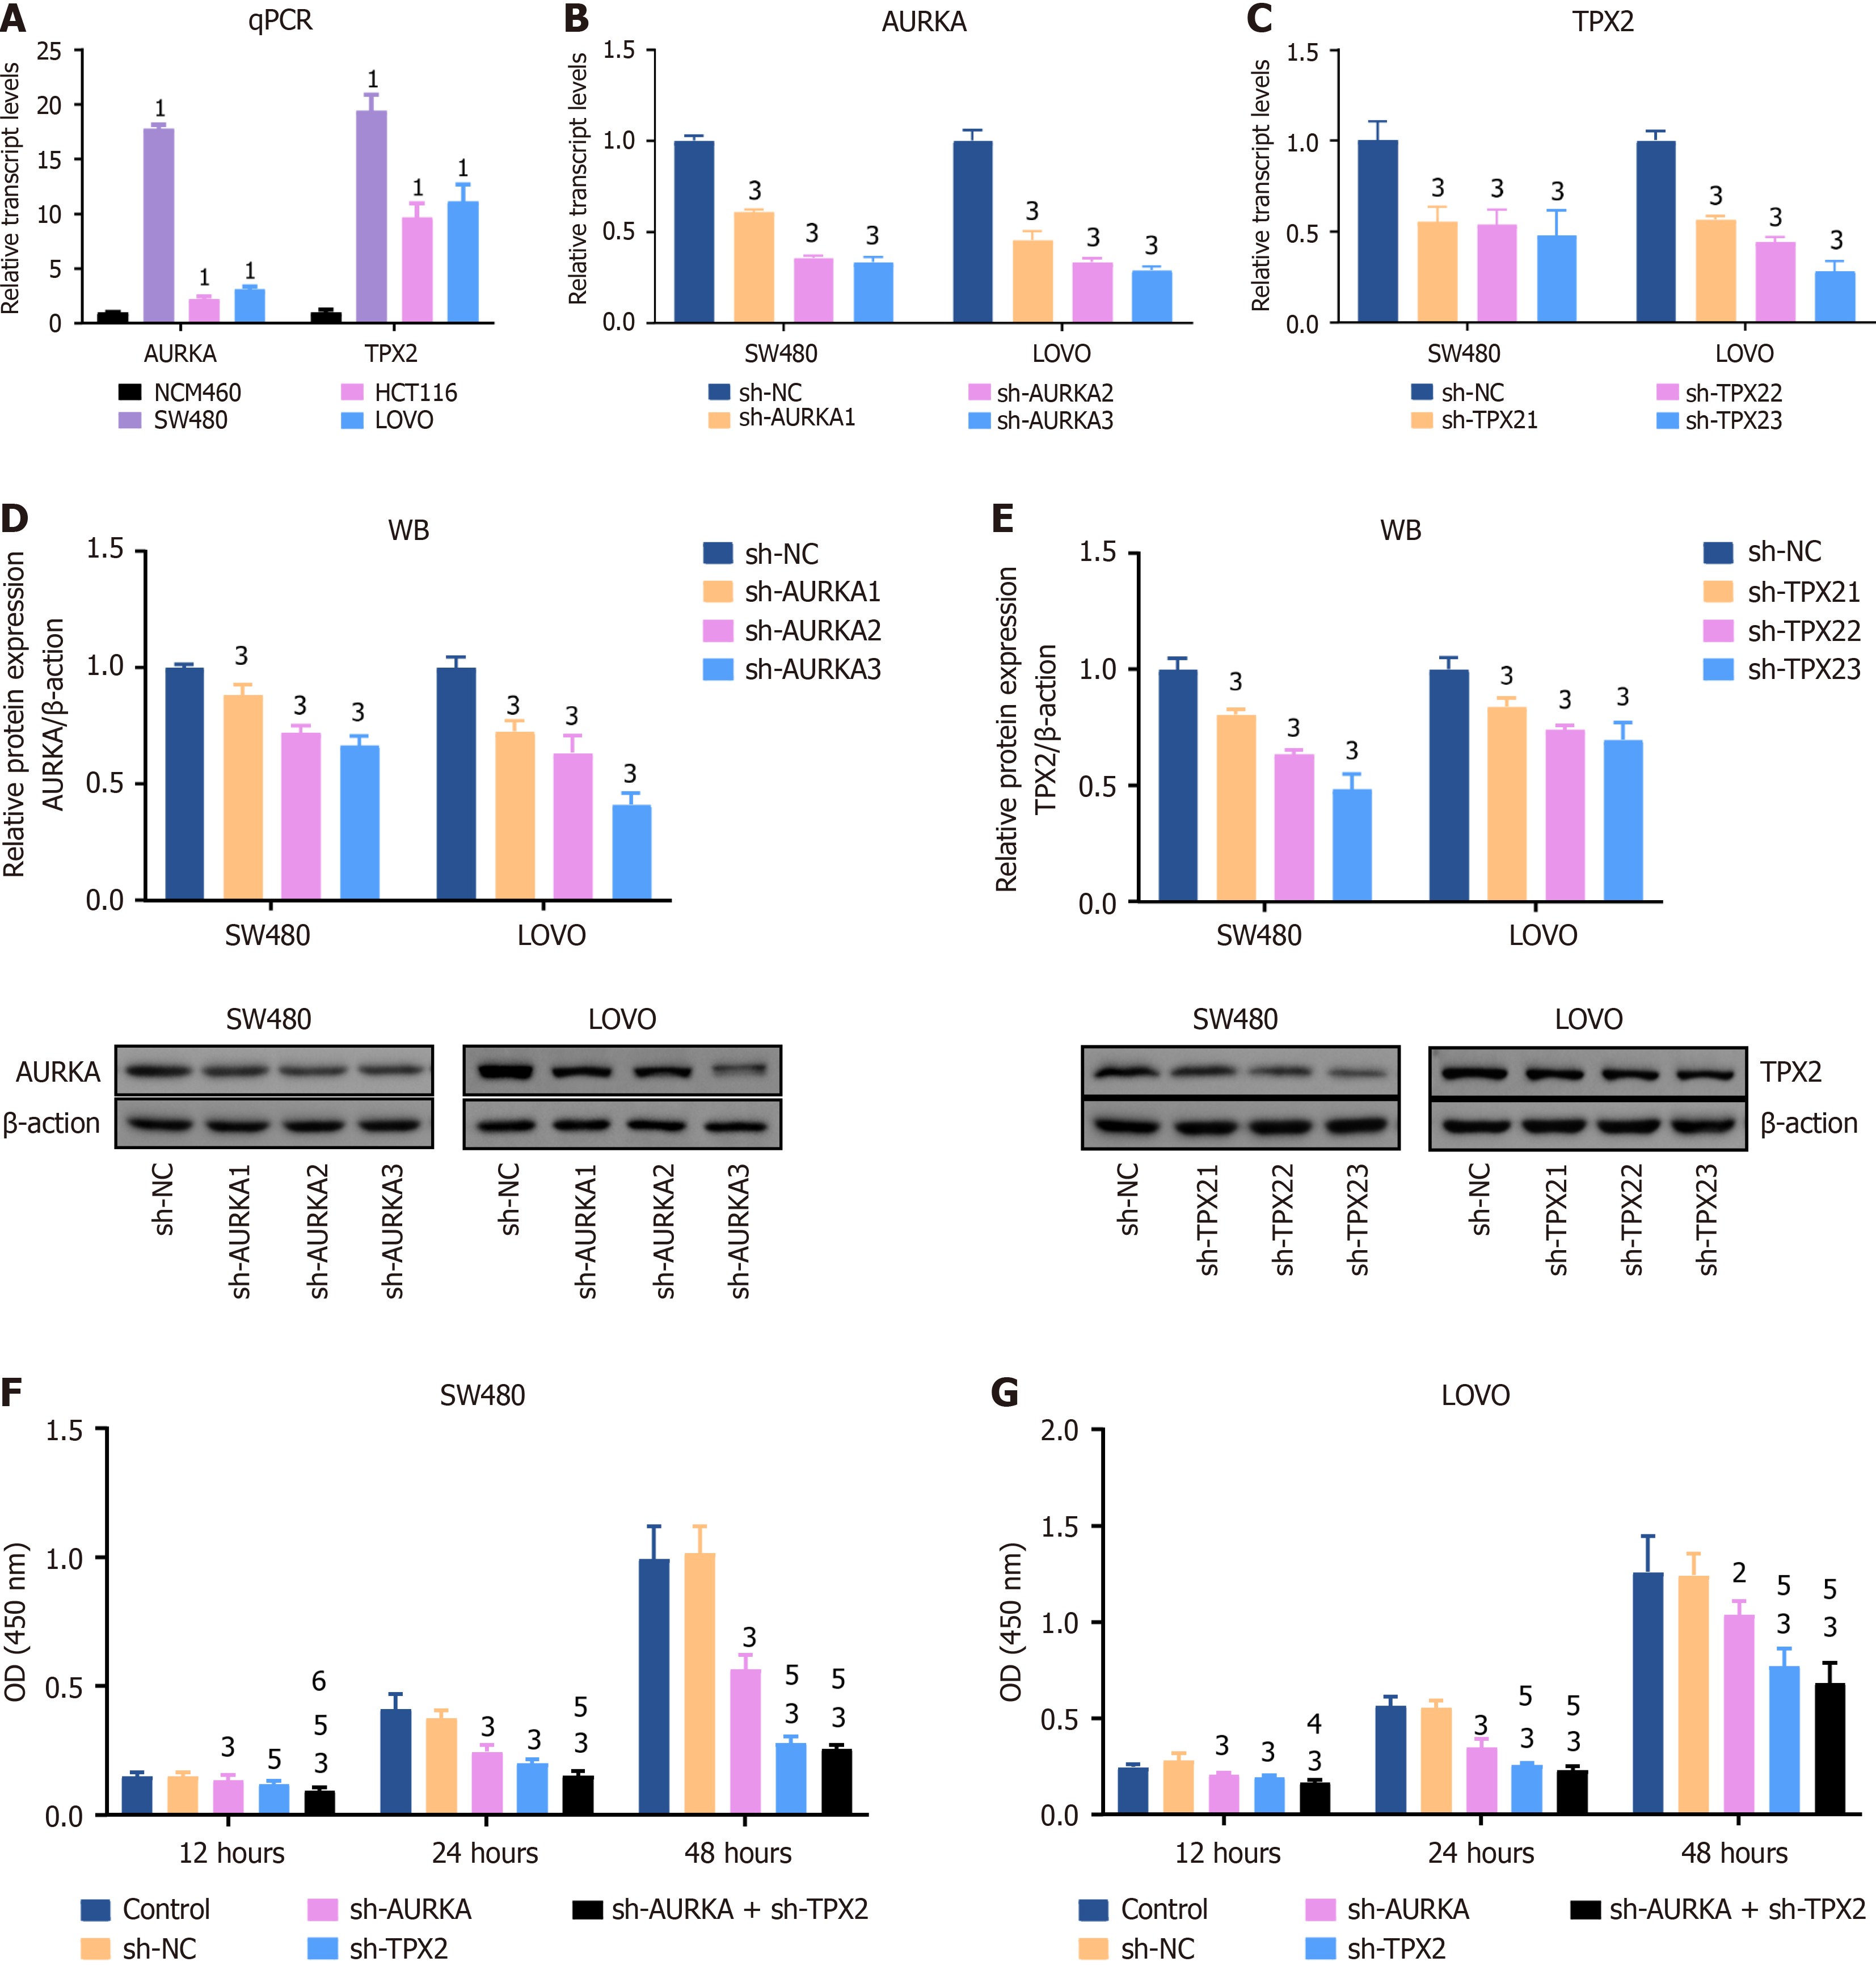
Transcript levels were measured using qPCR. HCT116, SW480, and LOVO are CRC cells with relatively high expression levels of AURKA and TPX2 compared to NCM460, a human colon epithelial cell line (Figure 4A). Among them, AURKA and TPX2 showed the highest expression levels in SW480 and LOVO cells (Figure 4A). Therefore, we used SW480 and LOVO cell lines for AURKA and TPX2 knockdown models. Their transcript levels were determined by qPCR and protein expression was measured by WB. The transcript levels of AURKA and TPX2 in SW480 cells with sh-AURKA3 treatment decreased to 33.3% and 48.0% (P < 0.01); they in LOVO cells with sh-TPX23 treatment decreased to 28.9% and 28.3%, respectively (P < 0.01) (Figure 4B and C). In AURKA and TPX2 knockdown cell models, the decreasing trend of AURKA and TPX2 proteins was consistent with their transcription levels (P < 0.01) (Figure 4D and E).
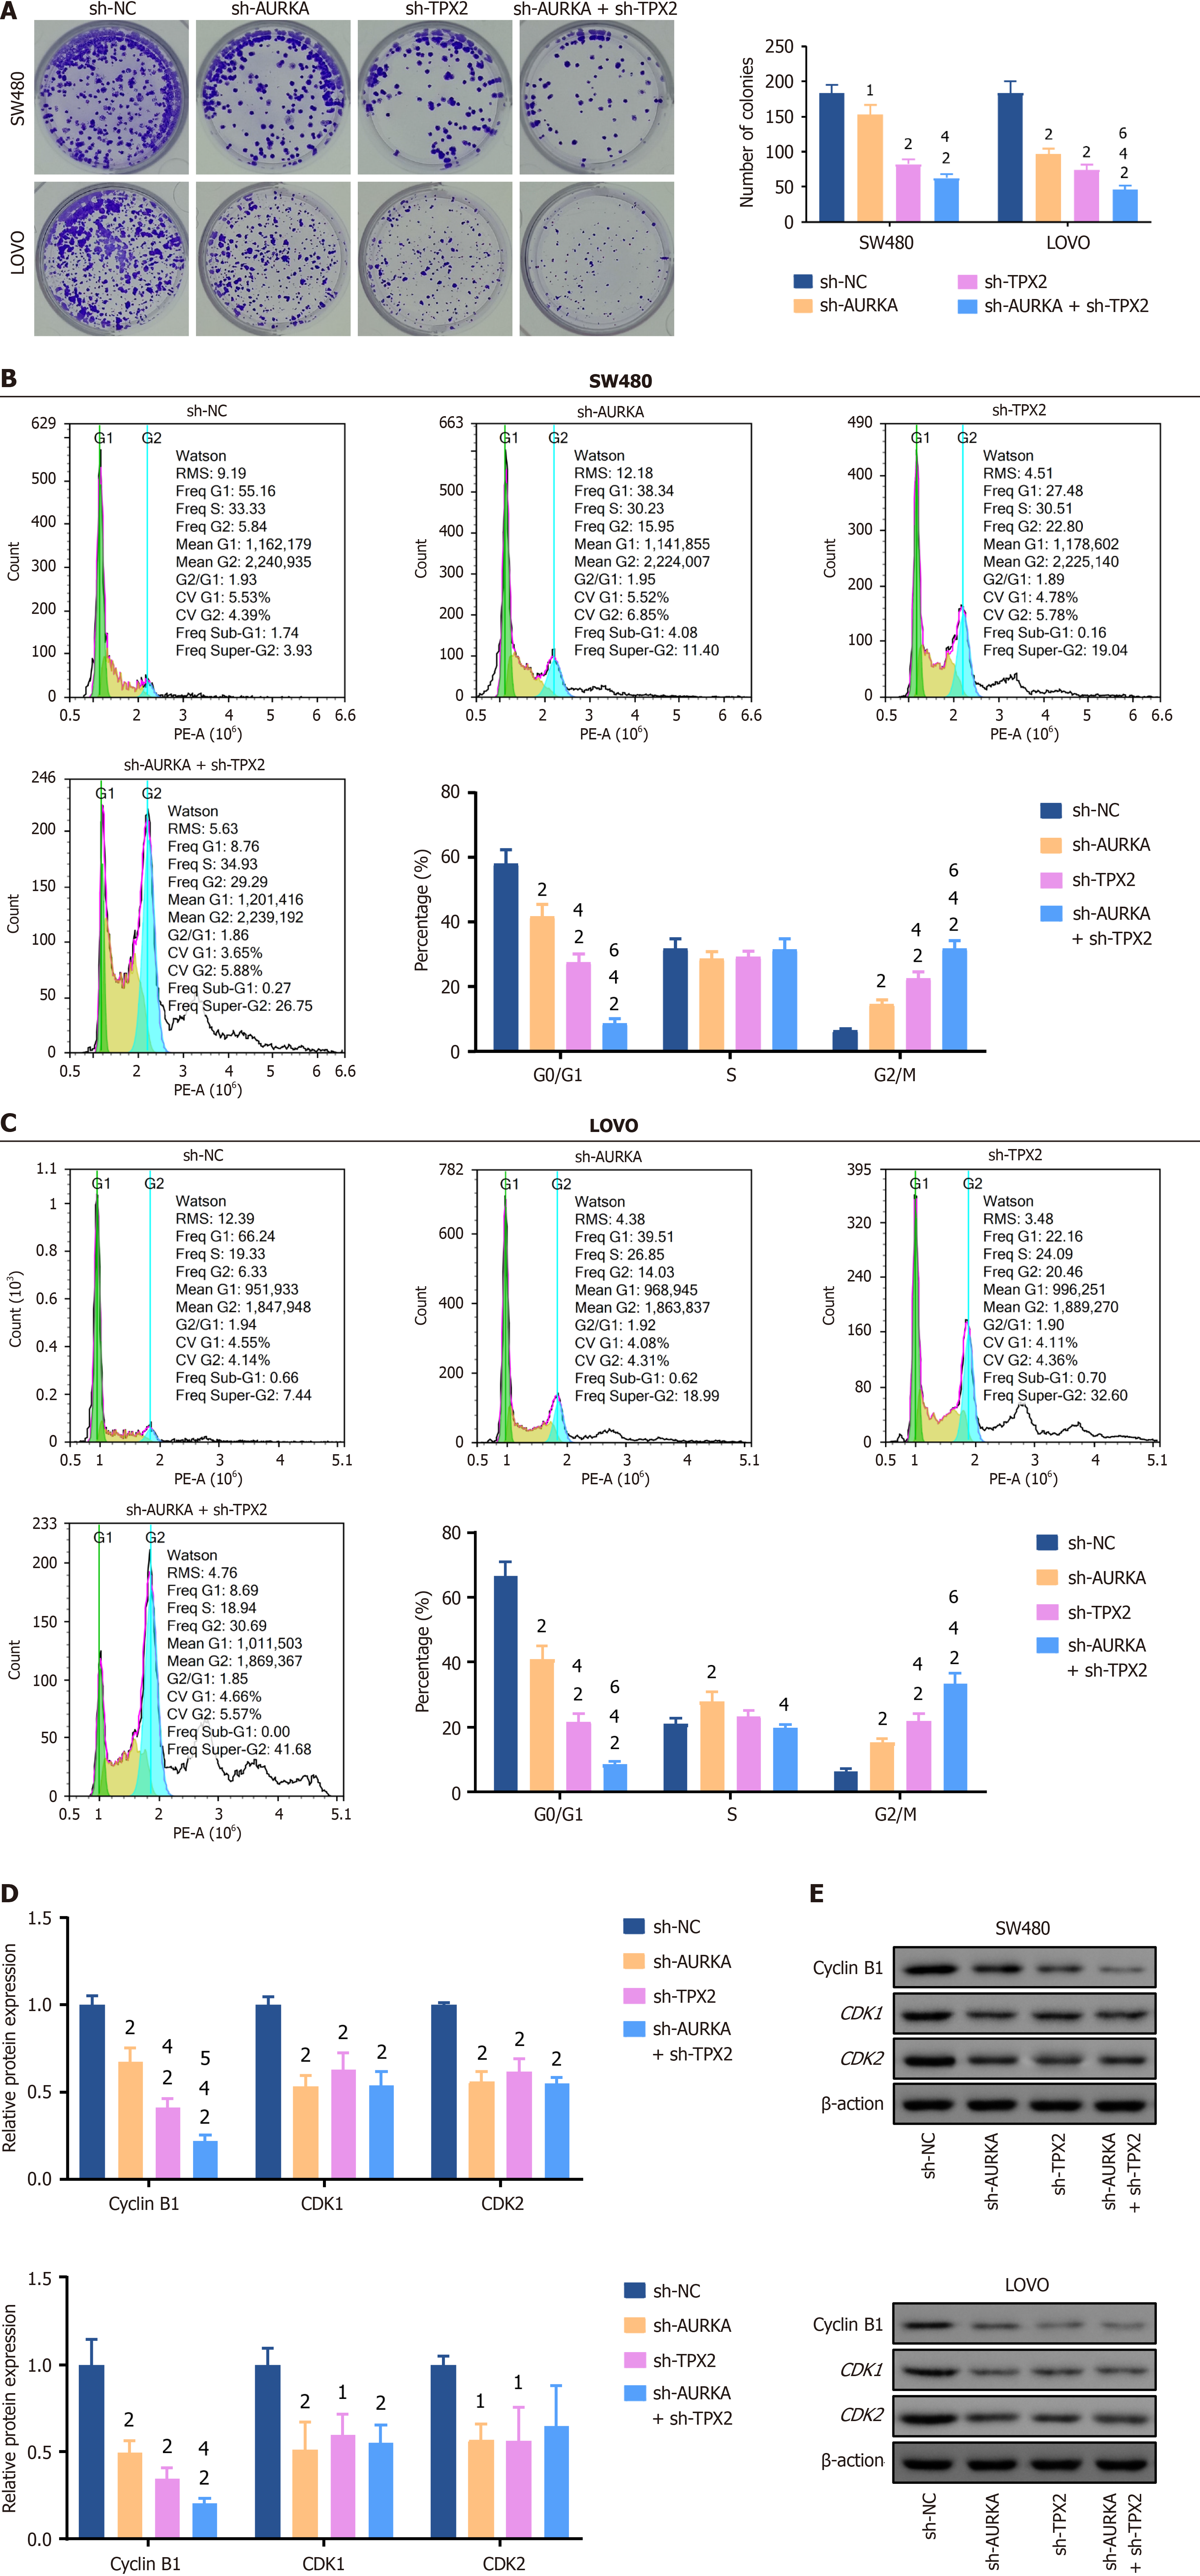
Subsequently, the proliferation capacity was analyzed using CCK-8 and cell cloning assays. We also used WB to quantify biomarker levels in the cell cycle. The OD value is directly proportional to cell viability. We found that after treatment with sh-AURKA, sh-TPX2, or a combination of both for 12 hours, 24 hours, or 48 hours, the cell viability was significantly inhibited (P < 0.01), whereas no statistical differences emerged when comparing the sh-NC group to the control (Figure 4F and G). Specifically, AURKA and TPX2 co-knockdown exhibited the strongest impact on cell viability (P < 0.01) (Figure 4F and G) and significantly inhibited cell viability compared with sh-AURKA treatment (P < 0.05) (Figure 4F and G). Cell cloning assays validated this observation and revealed a marked decrease in colony number in the sh-AURKA, sh-TPX2, and sh-AURKA + sh-TPX2 groups compared to the sh-NC group (P < 0.05) (Figure 5A). Furthermore, FCM revealed a significant decrease G0/G1 cell percentage and an increase in G2/M percentage among SW480 and LOVO cells treated with sh-AURKA, sh-TPX2, or their combination, while G2/M cell percentage was significantly increased (P < 0.01) (Figure 5B and C), paired with significantly reduced expression of key biomarkers such as cyclin B1, CDK1, and CDK2 (P < 0.05) (Figure 5D and E).
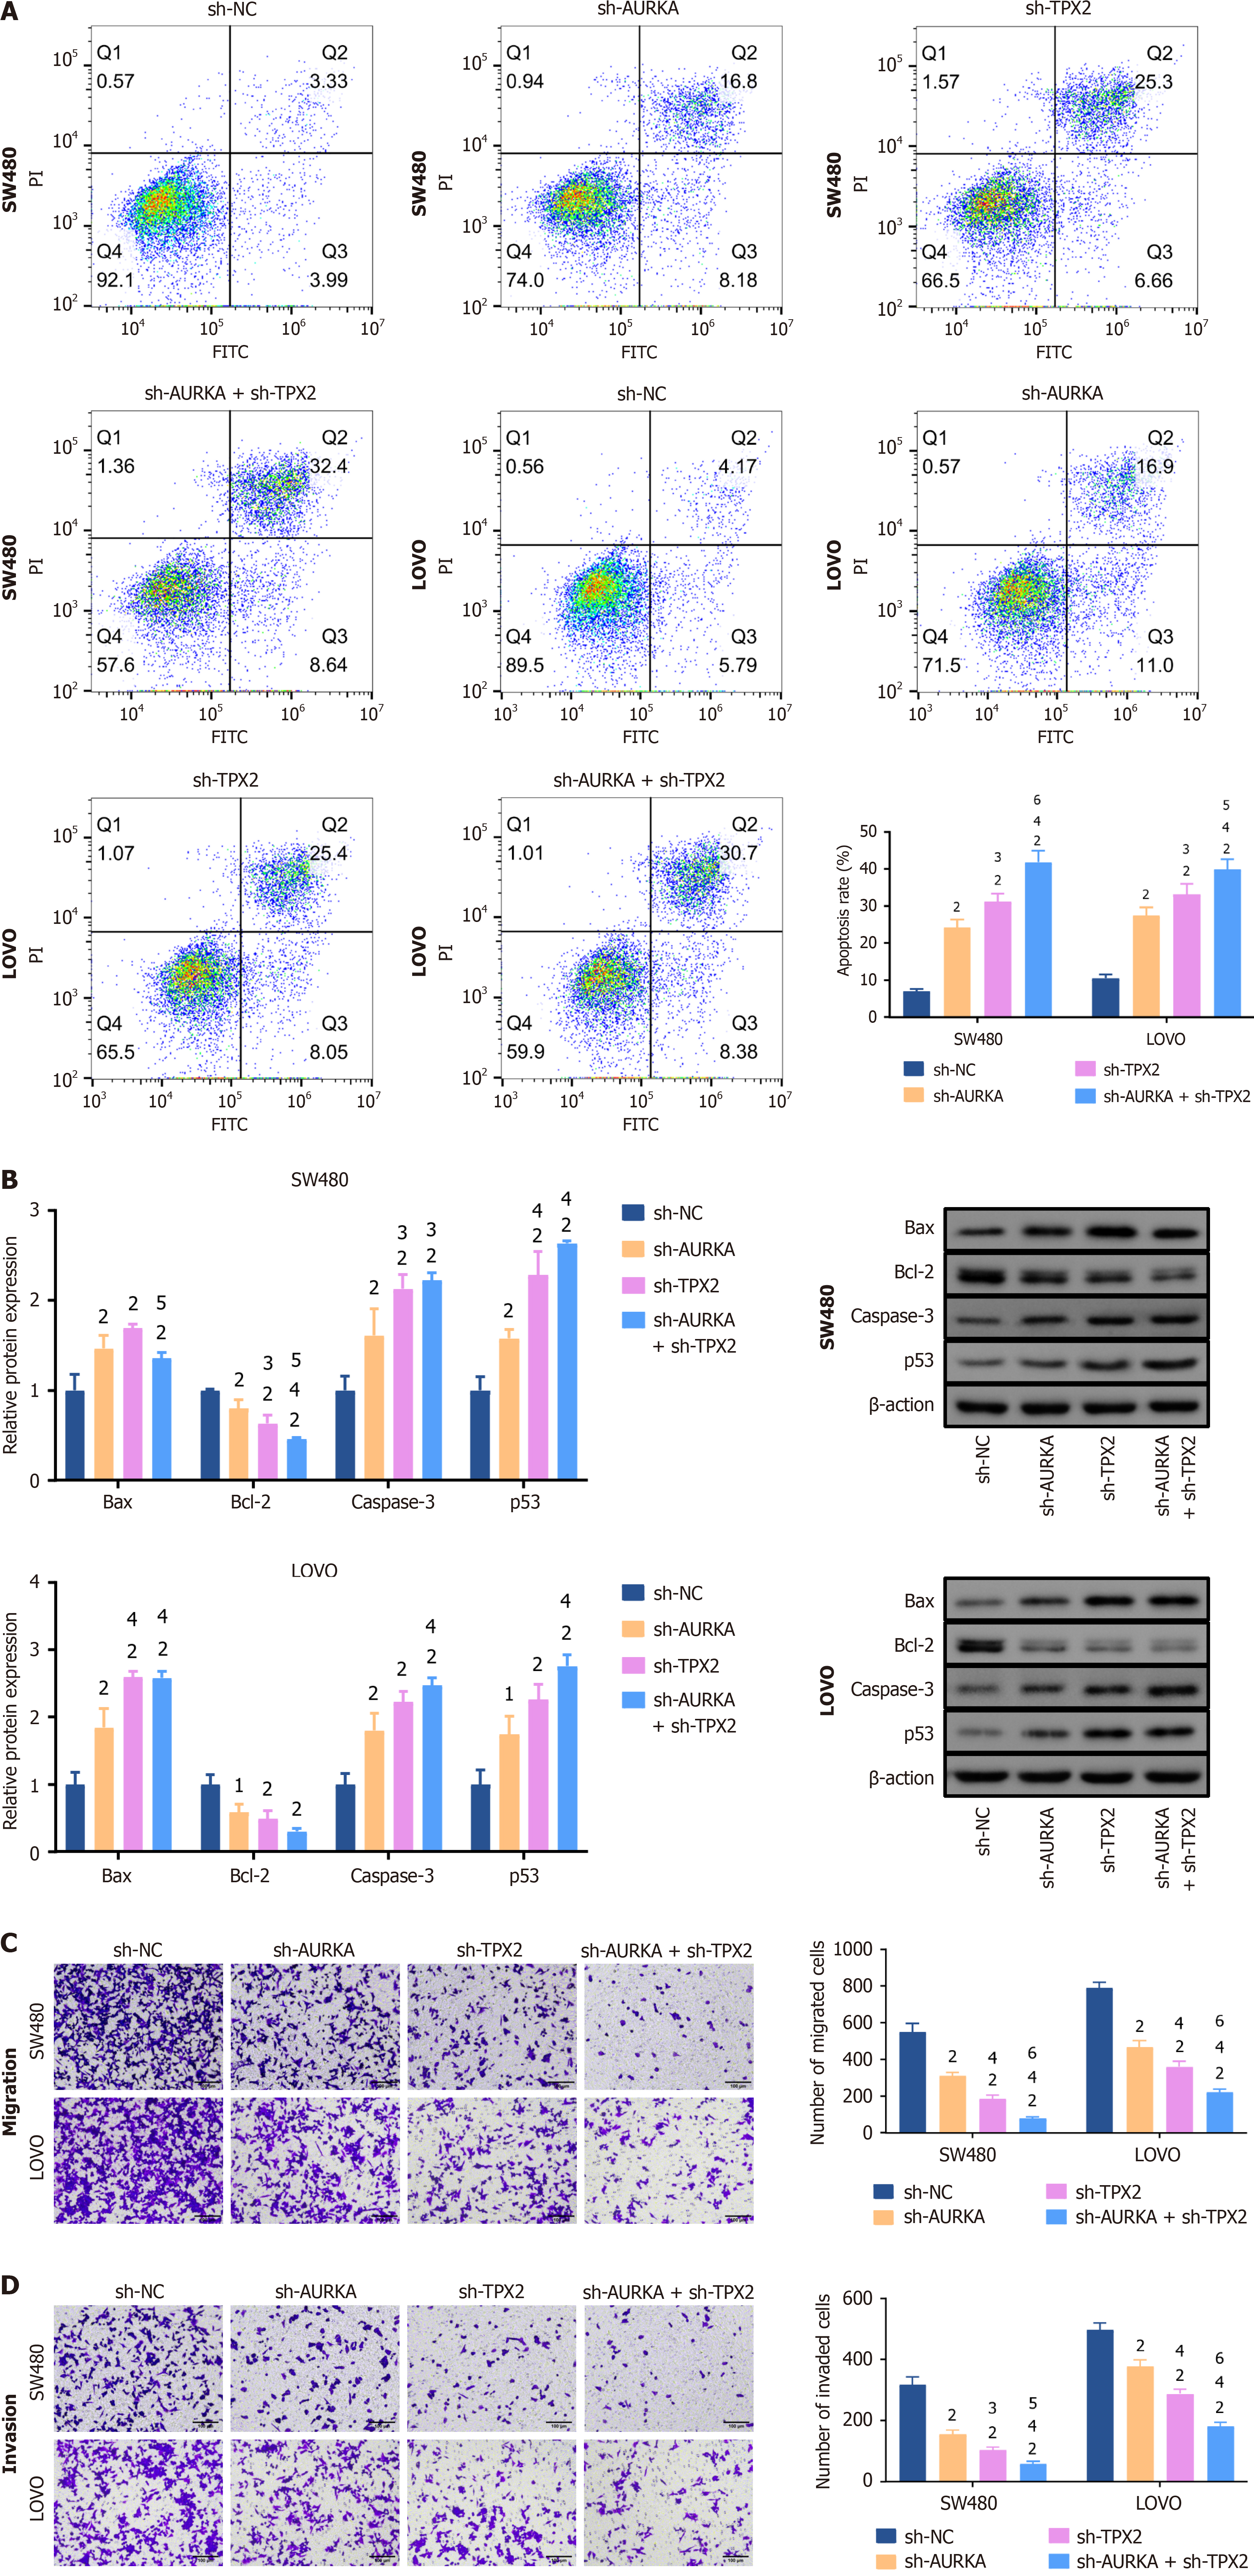
After the downregulation of AURKA, TPX2, or their combination in SW480 and LOVO cells, FCM revealed significantly enhanced apoptosis (P < 0.01) (Figure 6A). In particular, TPX2 knockdown was more potent at inducing apoptosis (P < 0.05), and TPX2 and AURKA co-knockdown had the best effect (P < 0.05) (Figure 6A). WB revealed that B-cell lymphoma-2 (Bcl-2)-associated X protein (Bax), caspase 3, and tumor protein P53 (p53) levels were significantly increased following silencing of AURKA, TPX2, or their combination in SW480 and LOVO cells, whereas Bcl-2 expression was markedly decreased (P < 0.05) (Figure 6B). Furthermore, TPX2 knockdown or co-knockdown with AURKA markedly raised caspase 3 and p53 Levels compared to AURKA knockdown alone (P < 0.05) (Figure 6B). Similarly, in LOVO cells, TPX2 kno
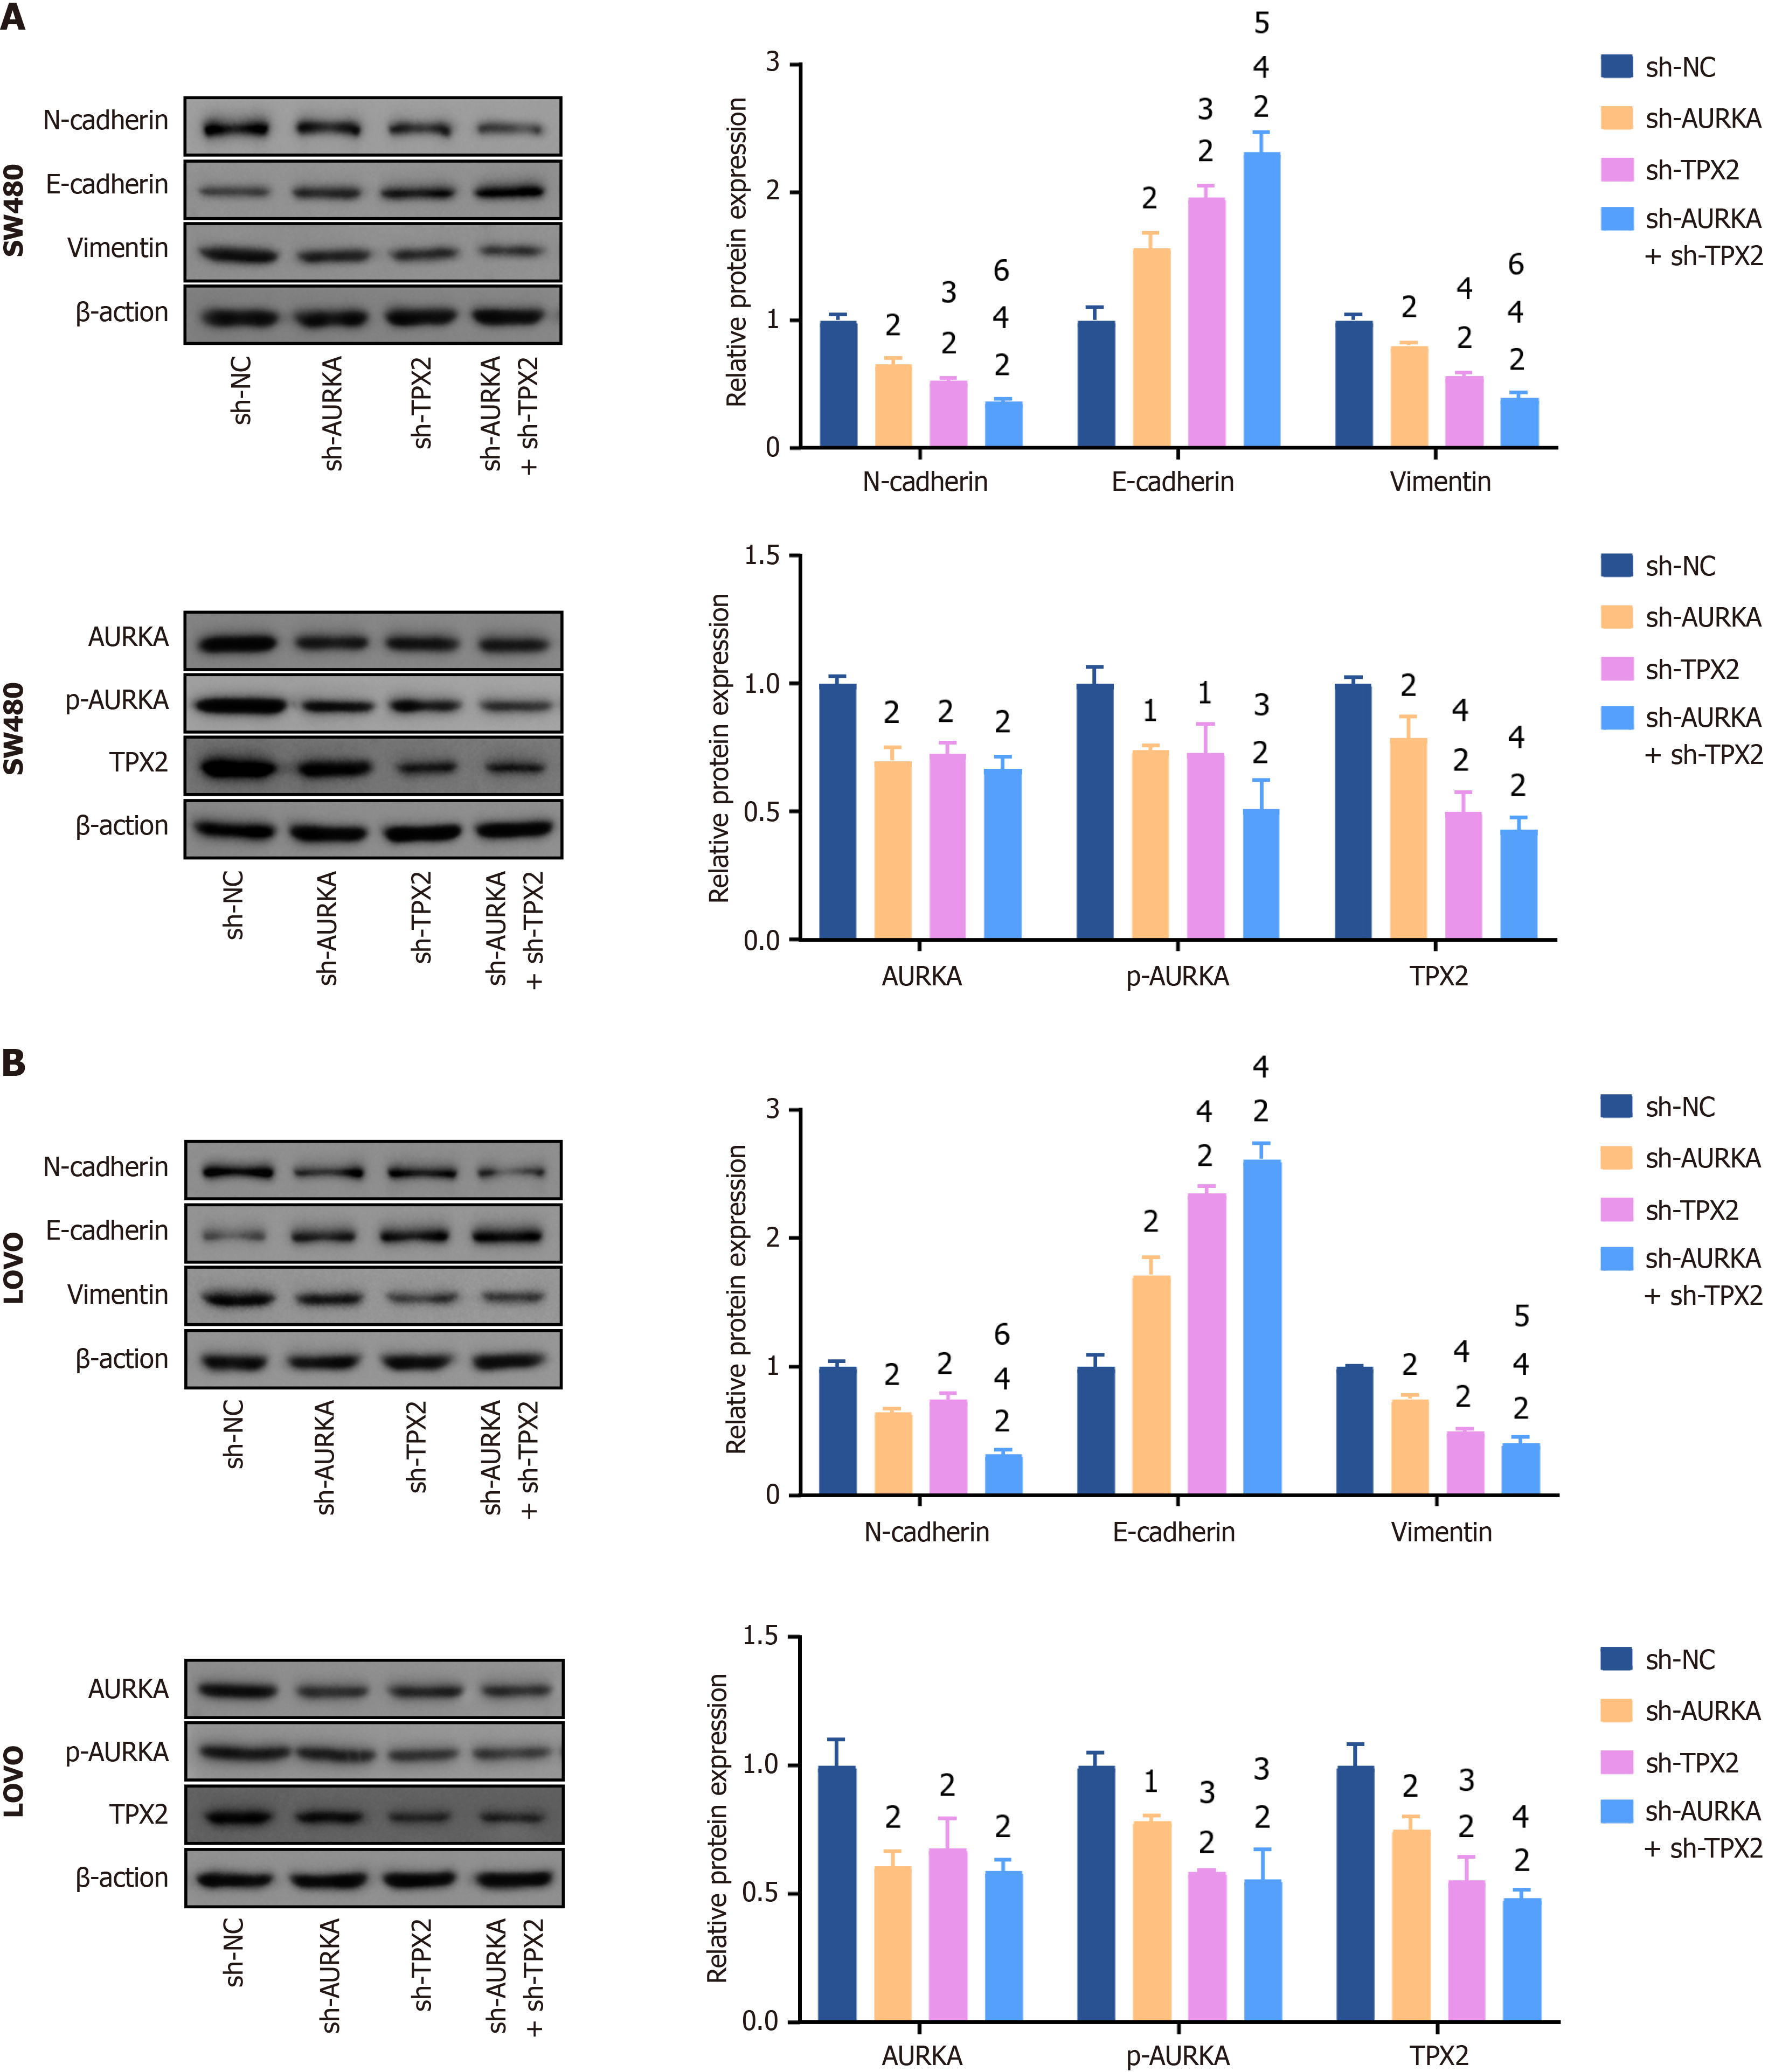
Additionally, epithelial-mesenchymal transition (EMT) is a key pathway in cancer cell migration and invasion. N-cadherin and vimentin, EMT biomarkers, levels were significantly reduced in SW480 and LOVO cells after knockdown of AURKA, TPX2, or their combination (P < 0.01), whereas E-cadherin levels were increased (P < 0.01) (Figure 7A and B). Notably, co-knockdown of AURKA and TPX2 was more effective in inhibiting N-cadherin and vimentin expression and increasing E-cadherin expression (P < 0.05) (Figure 7A and B). In addition, a significant decrease in AURKA, phosphory
We analyzed three CRC-related gene databases, with AURKA and TPX2 emerging as the significant factors. They are highly expressed in the CRC tissues. Jung et al[9] found that high AURKA levels significantly enhanced the survival rates of patients with COAD. However, most studies reported that AURKA is correlated with CRC deterioration. Tang et al[18] determined that upregulation of AURKA promotes CRC development. AURKA associates with TPX2, a microtubule-associated factor, at the kinetochore, thereby recruiting it and stabilizing the microtubules to correct bipolar spindle formation. Asteriti et al[10] found that AURKA accumulation in interphase nuclei requested AURKA and TPX2 co-overexpression, suggesting that AURKA/TPX2 co-overexpression may contribute to tumorigenesis. Notably, TPX2 is crucial for the spatial regulation of spindle assembly, and its absence suppresses prostate cancer cell proliferation, attenuates tumorigenesis, and increases apoptotic rates[19]. Targeting TPX2 impairs CRC proliferation[20]. PPI network analysis showed that AURKA strongly interacts with TPX2. Most studies have shown that upregulation of AURKA or TPX2 inhibits CRC proliferation[21]. However, few studies have explored AURKA and TPX2 co-knockdown’s effects on the malignant phenotype of CRC. We found that AURKA and TPX2 co-knockdown enhanced the inhibition of silencing AURKA or TPX2 alone on CRC proliferation, invasion, and migration.
Interestingly, we found that the co-knockdown further enhanced cyclin B1 protein inhibition. Co-knockdown of AURKA and TPX2 may enhance the suppressive effect on CRC proliferation via cyclin B1. Major mitotic protein kinase CDK1-cyclin B1 phosphorylated importin-α1 to release TPX2 with promoting mitotic spindle assembly[22]. With reduced cyclin B1 activity, the cell cycle is arrested at the G2/M phase[23]. We found that knockdown of AURKA, TPX2, or their combination inhibited cyclin B1 expression during G2/M phase and decreased CDK2 expression. Furthermore, cyclin B1 overexpression enhances the progression of drug resistance in CRC[24]. The dual downregulation of AURKA and TPX2 could potentially improve the efficacy of CRC treatment.
We found that the inhibition of AURKA, TPX2, or their combination promoted apoptosis in CRC cells. Additionally, the co-knockdown of AURKA and TPX2 activated the Bax/Bcl-2 pathway. Our results supported the hypothesis that AURKA inhibitors promote apoptosis in CRC cells[25]. Bax and Bcl-2 are two important proteins in controlling apoptosis and are associated with the malignant phenotype of CRC. Bax promotes apoptosis, whereas Bcl-1 inhibits it. Studies have indicated that dysregulation of AURKA leads to DNA damage during mitosis, which is sensed in the subsequent G1 phase by a p53-dependent post-mitotic checkpoint[26]. Our results also support previous research showing that AURKA inhibition promotes the pro-apoptotic protein levels, such as p53 and Caspase-3[27]. Additionally, we found that inhibition of TPX2 or AURKA/TPX2 had a greater effect on apoptosis in CRC. This may be related to the reverse regulation of AURKA accumulation in interphase nuclei by TPX2 expression[10].
Importantly, cell migration and invasion abilities are crucial for CRC metastasis. To evaluate this ability, we observed that knocking down either AURKA, TPX2, or both noticeably reduced CRC cell invasion and migration ability. E-cadherin, N-cadherin, and vimentin are hallmarks of EMT and are correlated with poor CRC outcomes. AURKA pro
In summary, we demonstrated the inhibitory effects of AURKA and TPX2 on CRC malignant phenotype and that co-downregulation amplified these effects. However, this study had several limitations. The outcomes of cellular studies often deviate considerably from in vivo outcomes. Therefore, corroborating cellular evidence with in vivo experiments and extensive clinical data evaluation are essential to confirm the therapeutic role of co-depletion against tumorigenesis.
We analyzed the GEO gene database to identify potential key genes related to CRC. By constructing SW480 and LOVO cell models with AURKA and TPX2 knockdown via plasmid transfection, the inhibition of AURKA and TPX2 knockdown on CRC cell proliferation, migration, and invasion was observed. Furthermore, it has been demonstrated the co-downregulation enhanced these effects. This study provides the scientific basis for developing new treatment strategies and therapeutic drugs. Of course, there is still a gap between the results of this study and its clinical application, and more comprehensive in vivo and clinical observational experiments are needed to support this.
| 1. | Sung H, Ferlay J, Siegel RL, Laversanne M, Soerjomataram I, Jemal A, Bray F. Global Cancer Statistics 2020: GLOBOCAN Estimates of Incidence and Mortality Worldwide for 36 Cancers in 185 Countries. CA Cancer J Clin. 2021;71:209-249. [RCA] [PubMed] [DOI] [Full Text] [Cited by in Crossref: 75126] [Cited by in RCA: 64717] [Article Influence: 16179.3] [Reference Citation Analysis (177)] |
| 2. | Möller L, Wellmann I, Stang A, Kajüter H. The Epidemiology of Colorectal Cancer in Younger and Older Patients. Dtsch Arztebl Int. 2023;120:277-283. [RCA] [PubMed] [DOI] [Full Text] [Reference Citation Analysis (0)] |
| 3. | Wong MCS, Huang J, Lok V, Wang J, Fung F, Ding H, Zheng ZJ. Differences in Incidence and Mortality Trends of Colorectal Cancer Worldwide Based on Sex, Age, and Anatomic Location. Clin Gastroenterol Hepatol. 2021;19:955-966.e61. [RCA] [PubMed] [DOI] [Full Text] [Cited by in Crossref: 101] [Cited by in RCA: 235] [Article Influence: 58.8] [Reference Citation Analysis (0)] |
| 4. | Burnett-Hartman AN, Lee JK, Demb J, Gupta S. An Update on the Epidemiology, Molecular Characterization, Diagnosis, and Screening Strategies for Early-Onset Colorectal Cancer. Gastroenterology. 2021;160:1041-1049. [RCA] [PubMed] [DOI] [Full Text] [Cited by in Crossref: 119] [Cited by in RCA: 174] [Article Influence: 43.5] [Reference Citation Analysis (0)] |
| 5. | Park JG, Jeon H, Shin S, Song C, Lee H, Kim NK, Kim EE, Hwang KY, Lee BJ, Lee IG. Structural basis for CEP192-mediated regulation of centrosomal AURKA. Sci Adv. 2023;9:eadf8582. [RCA] [PubMed] [DOI] [Full Text] [Full Text (PDF)] [Cited by in RCA: 1] [Reference Citation Analysis (0)] |
| 6. | Li H, Wang Y, Lin K, Venkadakrishnan VB, Bakht M, Shi W, Meng C, Zhang J, Tremble K, Liang X, Song JH, Feng X, Van V, Deng P, Burks JK, Aparicio A, Keyomarsi K, Chen J, Lu Y, Beltran H, Zhao D. CHD1 Promotes Sensitivity to Aurora Kinase Inhibitors by Suppressing Interaction of AURKA with Its Coactivator TPX2. Cancer Res. 2022;82:3088-3101. [RCA] [PubMed] [DOI] [Full Text] [Cited by in Crossref: 2] [Cited by in RCA: 1] [Article Influence: 0.3] [Reference Citation Analysis (0)] |
| 7. | Ki SM, Kim JH, Won SY, Oh SJ, Lee IY, Bae YK, Chung KW, Choi BO, Park B, Choi EJ, Lee JE. CEP41-mediated ciliary tubulin glutamylation drives angiogenesis through AURKA-dependent deciliation. EMBO Rep. 2020;21:e48290. [RCA] [PubMed] [DOI] [Full Text] [Full Text (PDF)] [Cited by in Crossref: 20] [Cited by in RCA: 28] [Article Influence: 5.6] [Reference Citation Analysis (0)] |
| 8. | Ding X, Duan H, Luo H. Identification of Core Gene Expression Signature and Key Pathways in Colorectal Cancer. Front Genet. 2020;11:45. [RCA] [PubMed] [DOI] [Full Text] [Full Text (PDF)] [Cited by in Crossref: 29] [Cited by in RCA: 60] [Article Influence: 12.0] [Reference Citation Analysis (0)] |
| 9. | Jung P, Horst D, Kirchner T, Klauschen F, Neumann J. AURKA is a prognostic biomarker for good overall survival in stage II colorectal cancer patients. Pathol Res Pract. 2022;235:153936. [RCA] [PubMed] [DOI] [Full Text] [Reference Citation Analysis (0)] |
| 10. | Asteriti IA, Polverino F, Stagni V, Sterbini V, Ascanelli C, Naso FD, Mastrangelo A, Rosa A, Paiardini A, Lindon C, Guarguaglini G. AurkA nuclear localization is promoted by TPX2 and counteracted by protein degradation. Life Sci Alliance. 2023;6. [RCA] [PubMed] [DOI] [Full Text] [Cited by in RCA: 11] [Reference Citation Analysis (0)] |
| 11. | Szklarczyk D, Gable AL, Lyon D, Junge A, Wyder S, Huerta-Cepas J, Simonovic M, Doncheva NT, Morris JH, Bork P, Jensen LJ, Mering CV. STRING v11: protein-protein association networks with increased coverage, supporting functional discovery in genome-wide experimental datasets. Nucleic Acids Res. 2019;47:D607-D613. [RCA] [PubMed] [DOI] [Full Text] [Full Text (PDF)] [Cited by in Crossref: 10161] [Cited by in RCA: 11757] [Article Influence: 1959.5] [Reference Citation Analysis (1)] |
| 12. | Shannon P, Markiel A, Ozier O, Baliga NS, Wang JT, Ramage D, Amin N, Schwikowski B, Ideker T. Cytoscape: a software environment for integrated models of biomolecular interaction networks. Genome Res. 2003;13:2498-2504. [RCA] [PubMed] [DOI] [Full Text] [Cited by in Crossref: 24663] [Cited by in RCA: 33606] [Article Influence: 1600.3] [Reference Citation Analysis (0)] |
| 13. | Bu D, Luo H, Huo P, Wang Z, Zhang S, He Z, Wu Y, Zhao L, Liu J, Guo J, Fang S, Cao W, Yi L, Zhao Y, Kong L. KOBAS-i: intelligent prioritization and exploratory visualization of biological functions for gene enrichment analysis. Nucleic Acids Res. 2021;49:W317-W325. [RCA] [PubMed] [DOI] [Full Text] [Full Text (PDF)] [Cited by in Crossref: 194] [Cited by in RCA: 1084] [Article Influence: 271.0] [Reference Citation Analysis (0)] |
| 14. | Tang Z, Li C, Kang B, Gao G, Li C, Zhang Z. GEPIA: a web server for cancer and normal gene expression profiling and interactive analyses. Nucleic Acids Res. 2017;45:W98-W102. [RCA] [PubMed] [DOI] [Full Text] [Full Text (PDF)] [Cited by in Crossref: 5550] [Cited by in RCA: 7091] [Article Influence: 886.4] [Reference Citation Analysis (0)] |
| 15. | Wu T, Zhao B, Cai C, Chen Y, Miao Y, Chu J, Sui Y, Li F, Chen W, Cai Y, Wang F, Jin J. The Males Absent on the First (MOF) Mediated Acetylation Alters the Protein Stability and Transcriptional Activity of YY1 in HCT116 Cells. Int J Mol Sci. 2023;24. [RCA] [PubMed] [DOI] [Full Text] [Reference Citation Analysis (0)] |
| 16. | Goos JA, Coupe VM, Diosdado B, Delis-Van Diemen PM, Karga C, Beliën JA, Carvalho B, van den Tol MP, Verheul HM, Geldof AA, Meijer GA, Hoekstra OS, Fijneman RJ; DeCoDe PET group. Aurora kinase A (AURKA) expression in colorectal cancer liver metastasis is associated with poor prognosis. Br J Cancer. 2013;109:2445-2452. [RCA] [PubMed] [DOI] [Full Text] [Full Text (PDF)] [Cited by in Crossref: 75] [Cited by in RCA: 99] [Article Influence: 8.3] [Reference Citation Analysis (0)] |
| 17. | Sillars-Hardebol AH, Carvalho B, Tijssen M, Beliën JA, de Wit M, Delis-van Diemen PM, Pontén F, van de Wiel MA, Fijneman RJ, Meijer GA. TPX2 and AURKA promote 20q amplicon-driven colorectal adenoma to carcinoma progression. Gut. 2012;61:1568-1575. [RCA] [PubMed] [DOI] [Full Text] [Cited by in Crossref: 89] [Cited by in RCA: 105] [Article Influence: 8.1] [Reference Citation Analysis (0)] |
| 18. | Tang J, Yang L, Li Y, Ning X, Chaulagain A, Wang T, Wang D. ARID3A promotes the development of colorectal cancer by upregulating AURKA. Carcinogenesis. 2021;42:578-586. [RCA] [PubMed] [DOI] [Full Text] [Cited by in Crossref: 14] [Cited by in RCA: 30] [Article Influence: 6.0] [Reference Citation Analysis (0)] |
| 19. | Pan HW, Su HH, Hsu CW, Huang GJ, Wu TT. Targeted TPX2 increases chromosome missegregation and suppresses tumor cell growth in human prostate cancer. Onco Targets Ther. 2017;10:3531-3543. [RCA] [PubMed] [DOI] [Full Text] [Full Text (PDF)] [Cited by in Crossref: 25] [Cited by in RCA: 35] [Article Influence: 4.4] [Reference Citation Analysis (0)] |
| 20. | Shaath H, Vishnubalaji R, Elango R, Velayutham D, Jithesh PV, Alajez NM. Therapeutic targeting of the TPX2/TTK network in colorectal cancer. Cell Commun Signal. 2023;21:265. [RCA] [PubMed] [DOI] [Full Text] [Cited by in RCA: 12] [Reference Citation Analysis (0)] |
| 21. | Takahashi Y, Sheridan P, Niida A, Sawada G, Uchi R, Mizuno H, Kurashige J, Sugimachi K, Sasaki S, Shimada Y, Hase K, Kusunoki M, Kudo S, Watanabe M, Yamada K, Sugihara K, Yamamoto H, Suzuki A, Doki Y, Miyano S, Mori M, Mimori K. The AURKA/TPX2 axis drives colon tumorigenesis cooperatively with MYC. Ann Oncol. 2015;26:935-942. [RCA] [PubMed] [DOI] [Full Text] [Cited by in Crossref: 41] [Cited by in RCA: 56] [Article Influence: 5.6] [Reference Citation Analysis (0)] |
| 22. | Guo L, Mohd KS, Ren H, Xin G, Jiang Q, Clarke PR, Zhang C. Phosphorylation of importin-α1 by CDK1-cyclin B1 controls mitotic spindle assembly. J Cell Sci. 2019;132. [RCA] [PubMed] [DOI] [Full Text] [Full Text (PDF)] [Cited by in Crossref: 11] [Cited by in RCA: 16] [Article Influence: 2.7] [Reference Citation Analysis (0)] |
| 23. | Farshadi E, Yan J, Leclere P, Goldbeter A, Chaves I, van der Horst GTJ. The positive circadian regulators CLOCK and BMAL1 control G2/M cell cycle transition through Cyclin B1. Cell Cycle. 2019;18:16-33. [RCA] [PubMed] [DOI] [Full Text] [Full Text (PDF)] [Cited by in Crossref: 44] [Cited by in RCA: 57] [Article Influence: 9.5] [Reference Citation Analysis (0)] |
| 24. | Choi EK, Lim JA, Kim JK, Jang MS, Kim SE, Baek HJ, Park EJ, Kim TH, Deng CX, Wang RH, Kim SS. Cyclin B1 stability is increased by interaction with BRCA1, and its overexpression suppresses the progression of BRCA1-associated mammary tumors. Exp Mol Med. 2018;50:1-16. [RCA] [PubMed] [DOI] [Full Text] [Full Text (PDF)] [Cited by in Crossref: 6] [Cited by in RCA: 6] [Article Influence: 0.9] [Reference Citation Analysis (0)] |
| 25. | Sun C, Qu Z, Liu W, Qiu Z, Lü Y, Sun Z. The Synergistic Anti-colon Cancer Effect of Aurora A Inhibitors and AKT Inhibitors Through PI3K/AKT Pathway. Anticancer Agents Med Chem. 2023;23:87-93. [RCA] [PubMed] [DOI] [Full Text] [Reference Citation Analysis (0)] |
| 26. | Ma HT, Poon RYC. Aurora kinases and DNA damage response. Mutat Res. 2020;821:111716. [RCA] [PubMed] [DOI] [Full Text] [Cited by in Crossref: 20] [Cited by in RCA: 41] [Article Influence: 8.2] [Reference Citation Analysis (0)] |
| 27. | Liu X, Zhang Y, Wu S, Xu M, Shen Y, Yu M, Fan J, Wei S, Xu C, Huang L, Zhao H, Li X, Ye X. Palmatine induces G2/M phase arrest and mitochondrial-associated pathway apoptosis in colon cancer cells by targeting AURKA. Biochem Pharmacol. 2020;175:113933. [RCA] [PubMed] [DOI] [Full Text] [Cited by in Crossref: 12] [Cited by in RCA: 23] [Article Influence: 4.6] [Reference Citation Analysis (0)] |
| 28. | Hong OY, Kang SY, Noh EM, Yu HN, Jang HY, Kim SH, Hong J, Chung EY, Kim JS. Aurora kinase A induces migration and invasion by inducing epithelial-to-mesenchymal transition in colon cancer cells. BMB Rep. 2022;55:87-91. [RCA] [PubMed] [DOI] [Full Text] [Full Text (PDF)] [Cited by in RCA: 11] [Reference Citation Analysis (0)] |
| 29. | Zhang B, Zhang M, Li Q, Yang Y, Shang Z, Luo J. TPX2 mediates prostate cancer epithelial-mesenchymal transition through CDK1 regulated phosphorylation of ERK/GSK3β/SNAIL pathway. Biochem Biophys Res Commun. 2021;546:1-6. [RCA] [PubMed] [DOI] [Full Text] [Cited by in Crossref: 5] [Cited by in RCA: 33] [Article Influence: 8.3] [Reference Citation Analysis (0)] |


