Published online Jun 27, 2024. doi: 10.4240/wjgs.v16.i6.1803
Revised: April 25, 2024
Accepted: April 28, 2024
Published online: June 27, 2024
Processing time: 100 Days and 17.1 Hours
Stomach adenocarcinoma (STAD) is one of the main reasons for cancer-related deaths worldwide. This investigation aimed to define the connection between STAD and Cuproptosis-related genes (CRGs). Cuproptosis is a newly identified form of mitochondrial cell death triggered by copper.
To explore the identification of potential biomarkers for STAD disease based on cuproptosis.
A predictive model using Gene Ontology (GO), Least Absolute Shrinkage and Selection Operator (LASSO), Kyoto Encyclopedia of Genes and Genomes (KEGG), Gene Set Variation Analysis (GSVA), and Gene Set Enrichment Analysis analyzed gene interconnections, focusing on 3 copper-related genes and their expression in The Cancer Genome Atlas-STAD. Networks for mRNA-miRNA and mRNA-transcription factor interactions were constructed. The prognostic significance of CRG scores was evaluated using time-receiver operating characteristic, Kaplan-Meier curves, and COX regression analysis. Validation was conducted with datasets GSE26942, GSE54129, and GSE66229. Expression of copper-related differentially expressed genes was also analyzed in various human tissues and gastric cancer subpopulations using the human protein atlas.
Three significant genes (FDX1, LIAS, MTF1) were identified and selected via LASSO analysis to predict and classify individuals with STAD into high and low CRG score subgroups. These genes were down-regulated in both risk categories. GO and KEGG analyses highlighted their involvement mainly in the electron transport chain. After validating their differential expression, FDX1 emerged as the most accurate diagnostic marker for gastric cancer. Additionally, the RCircos package localized FDX1 on chromosome 11.
Our study revealed that FDX1 could be a potential biomarker and treatment target for gastric malignancy, providing new ideas for further scientific research.
Core Tip: This study explores the novel link between cuproptosis-related genes (CRGs) and stomach adenocarcinoma (STAD), identifying FDX1 as a potential biomarker and therapeutic target. Utilizing comprehensive analyses, including Gene Set Enrichment Analysis and Least Absolute Shrinkage and Selection Operator regression, we categorized STAD patients into high and low risk based on CRG scores. FDX1, along with two other genes, demonstrated significant diagnostic and prognostic potential, suggesting a new avenue for targeted therapies in gastric cancer treatment.
- Citation: Xie XZ, Zuo L, Huang W, Fan QM, Weng YY, Yao WD, Jiang JL, Jin JQ. FDX1 as a novel biomarker and treatment target for stomach adenocarcinoma. World J Gastrointest Surg 2024; 16(6): 1803-1824
- URL: https://www.wjgnet.com/1948-9366/full/v16/i6/1803.htm
- DOI: https://dx.doi.org/10.4240/wjgs.v16.i6.1803
With an estimated more than one million new cases annually, gastric cancer, specifically gastric adenocarcinoma (STAD), is the third most frequent cause of malignancy mortality globally and the fifth most common cancer[1]. And it has a high recurrence and mortality rate[1]. Significant advances in the treatment of STAD have been made in the previous decades, particularly with the cisplatin start, which has delayed the life expectancy of patients with gastric adenocarcinoma to some extent[2]. However, the development of drug resistance has reduced the effectiveness of cisplatin, leading to local infiltration of tumor cells and distant metastases. As a result, the STAD prognosis is still discouraging, with a 5-year survival rate of less than 30%[3]. And STAD risk factors are diverse, including but not restricted to age, sex, Helicobacter pylori (H. pylori) infection, and a high nitrite diet[4]. To enhance STAD diagnosis, prevention, and therapy, finding novel STAD biomarkers or treatment targets is vital.
Copper is a vital trace element in the body and significantly maintains enzyme activity[5]. Recently, copper function in cancer has been extensively explored, with numerous studies showing elevated levels in various tumor tissues such as lung, breast, cervical, ovarian, prostate, stomach, and colorectal cancers[6]. Copper also exhibits cytotoxicity when its concentration exceeds the threshold for maintaining homeostatic mechanisms, and the researchers named this mechanism of copper ion-induced cell death as copper death[7]. Therefore, by analyzing the phenomenon, mechanism, and disease model, the researchers found that copper death happens via the binding of copper to the tricarboxylic acid cycle lipidated elements. This causes iron-sulfur cluster protein loss and lipid-acylated protein aggregation, which induces proteotoxic stress and apoptosis[8]. Moreover, copper enhances tumor angiogenesis for metabolic waste and nutrient transportation[9].
According to these investigations, copper is a valuable target for treating malignancy.
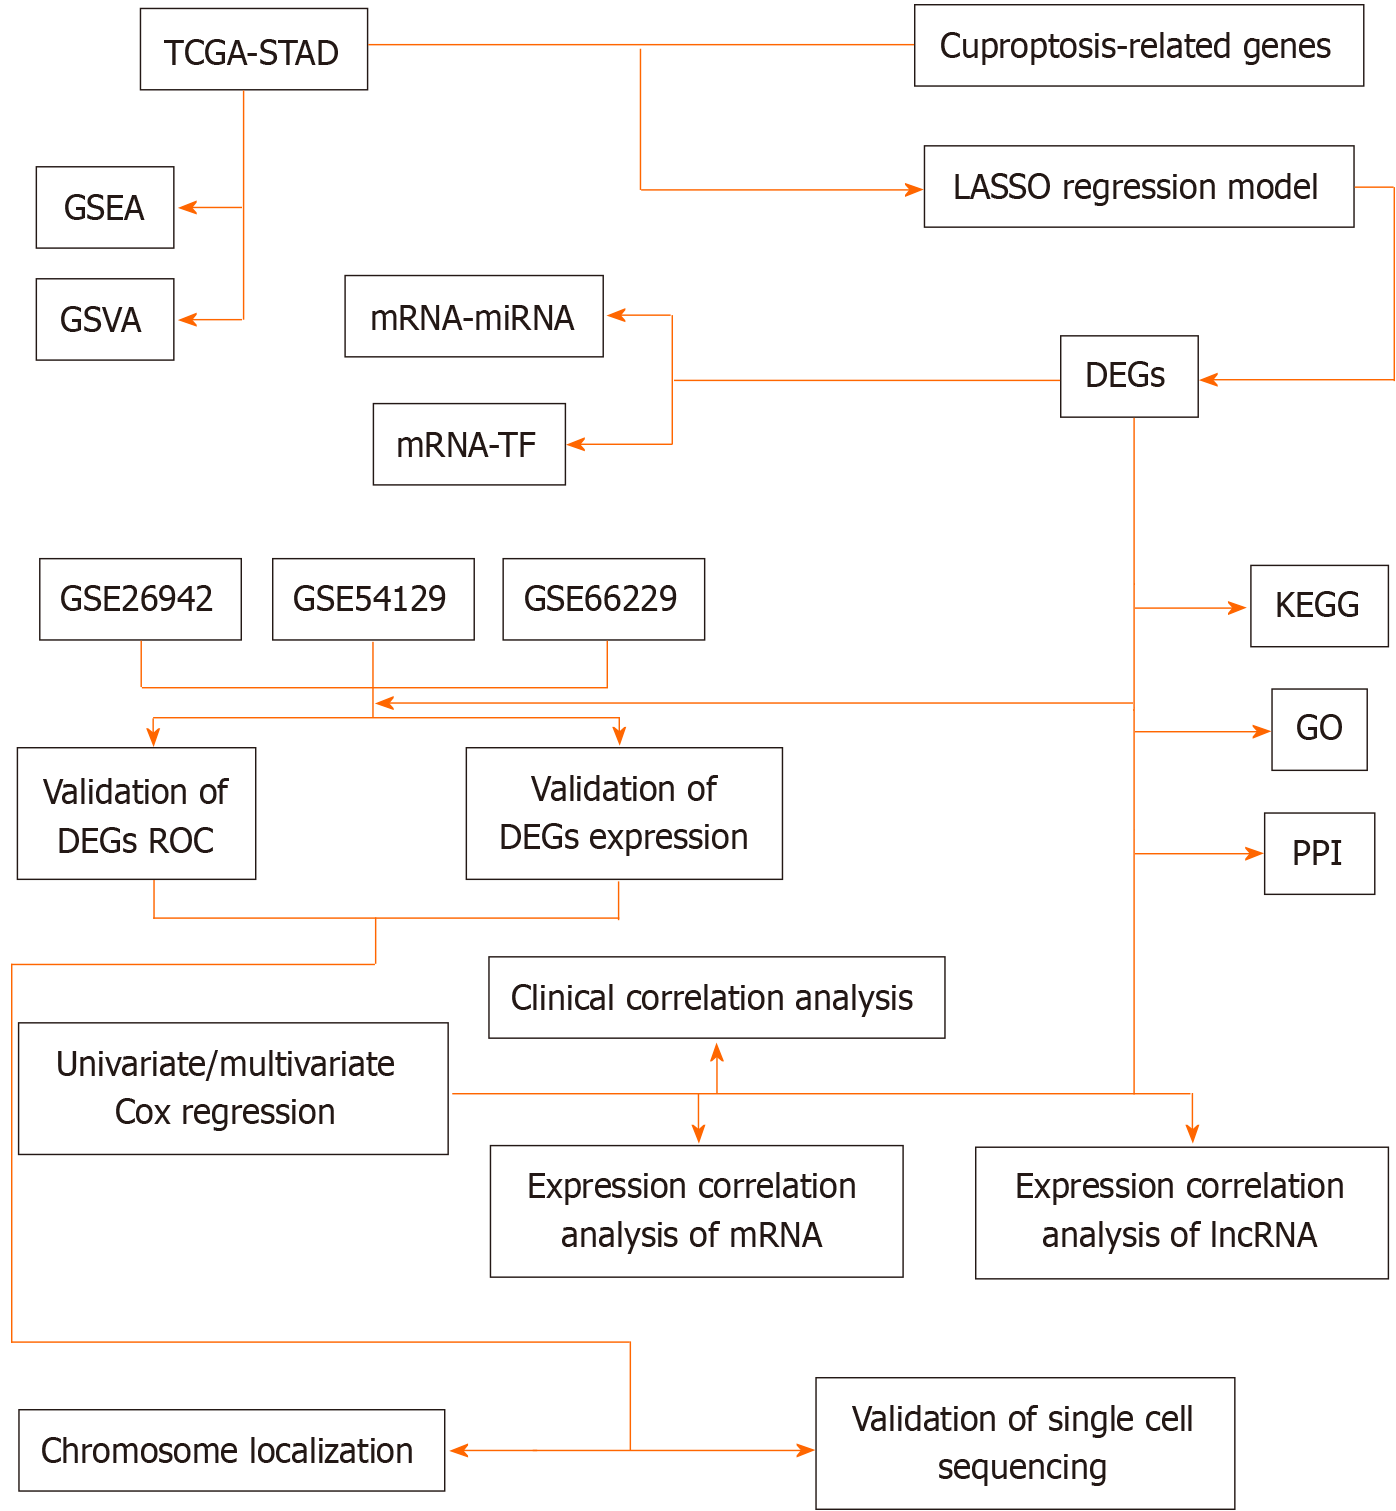
Given the critical role of copper element disorders in cancer, this investigation aimed to systematically discover the molecular function (MF) and medical relevance of genes connected with copper death in STAD. We analyzed information from 353 individuals with STAD in the The Cancer Genome Atlas (TCGA) database, showing the results of cuproptosis-related genes (CRGs) expression and functional enrichment analysis. Notably, three CRGs were determined to be connected with survival and prognosis in hepatocellular carcinoma patients. And more validation was obtained in the external The Gene Expression Omnibus (GEO) datasets GSE26942, GSE54129, and GSE66229, culminating in the screening of FDX1 as a highly significant gene. Studying the connection between STAD and genes connected with copper death will help us grasp STAD patients' immune status and continuously optimize treatment strategies to prolong prognosis. In conclusion, our investigation offers a comprehensive analysis of CRGs' function in different parts of STAD, highlighting the CRGs' significance in STAD progression and giving a guideline for applying copper death-related genes in STAD treatment. The technology road map is shown in Figure 1.
Expression profiling datasets of STAD patients were downloaded from GEO (http://www.ncbi.nlm.nih.gov/geo/) database using the R package GEO query[10]. GSE26942[11], GSE66229 and GSE54129. In the dataset GSE26942, we selected 202 STAD samples and 12 control samples for follow-up analysis. The data set GSE54129 has 132 pieces, including 111 STAD samples and 21 control samples. Data set GSE66229 consisted of 300 STAD models and 100 control samples; we selected these samples for follow-up analysis.
In addition, we have used the TCGA biolinks package[12] from the Tumor Genome Project (https://portal.gdc.cancer.gov/) to download the count sequencing data of the STAD dataset (TCGA-STAD), which included a total of 407 samples, including 375 STAD and 32 control specimens. By excluding models without predictive data from the UCSC Xena database, the medical information of 353 samples was also obtained (http://genome.ucsc.edu), and these 353 samples were used for follow-up analysis (Table 1).
| Characteristic | Levels | Overall (n = 375) |
| T stage | T1 | 19 (5.2) |
| T2 | 80 (21.8) | |
| T3 | 168 (45.8) | |
| T4 | 100 (27.2) | |
| N stage | N0 | 111 (31.1) |
| N1 | 97 (27.2) | |
| N2 | 75 (21) | |
| N3 | 74 (20.7) | |
| M stage | M0 | 330 (93) |
| M1 | 25 (7) | |
| Pathologic stage | Stage I | 53 (15.1) |
| Stage II | 111 (31.5) | |
| Stage III | 150 (42.6) | |
| Stage IV | 38 (10.8) | |
| Gender | Female | 134 (35.7) |
| Male | 241 (64.3) | |
| Age | ≤ 65 | 164 (44.2) |
| > 65 | 207 (55.8) | |
| OS event | Alive | 228 (60.8) |
| Dead | 147 (39.2) | |
| DSS event | Alive | 263 (74.3) |
| Dead | 91 (25.7) | |
| PFI event | Alive | 251 (66.9) |
| Dead | 124 (33.1) | |
| Age, median (IQR) | 67 (58, 73) |
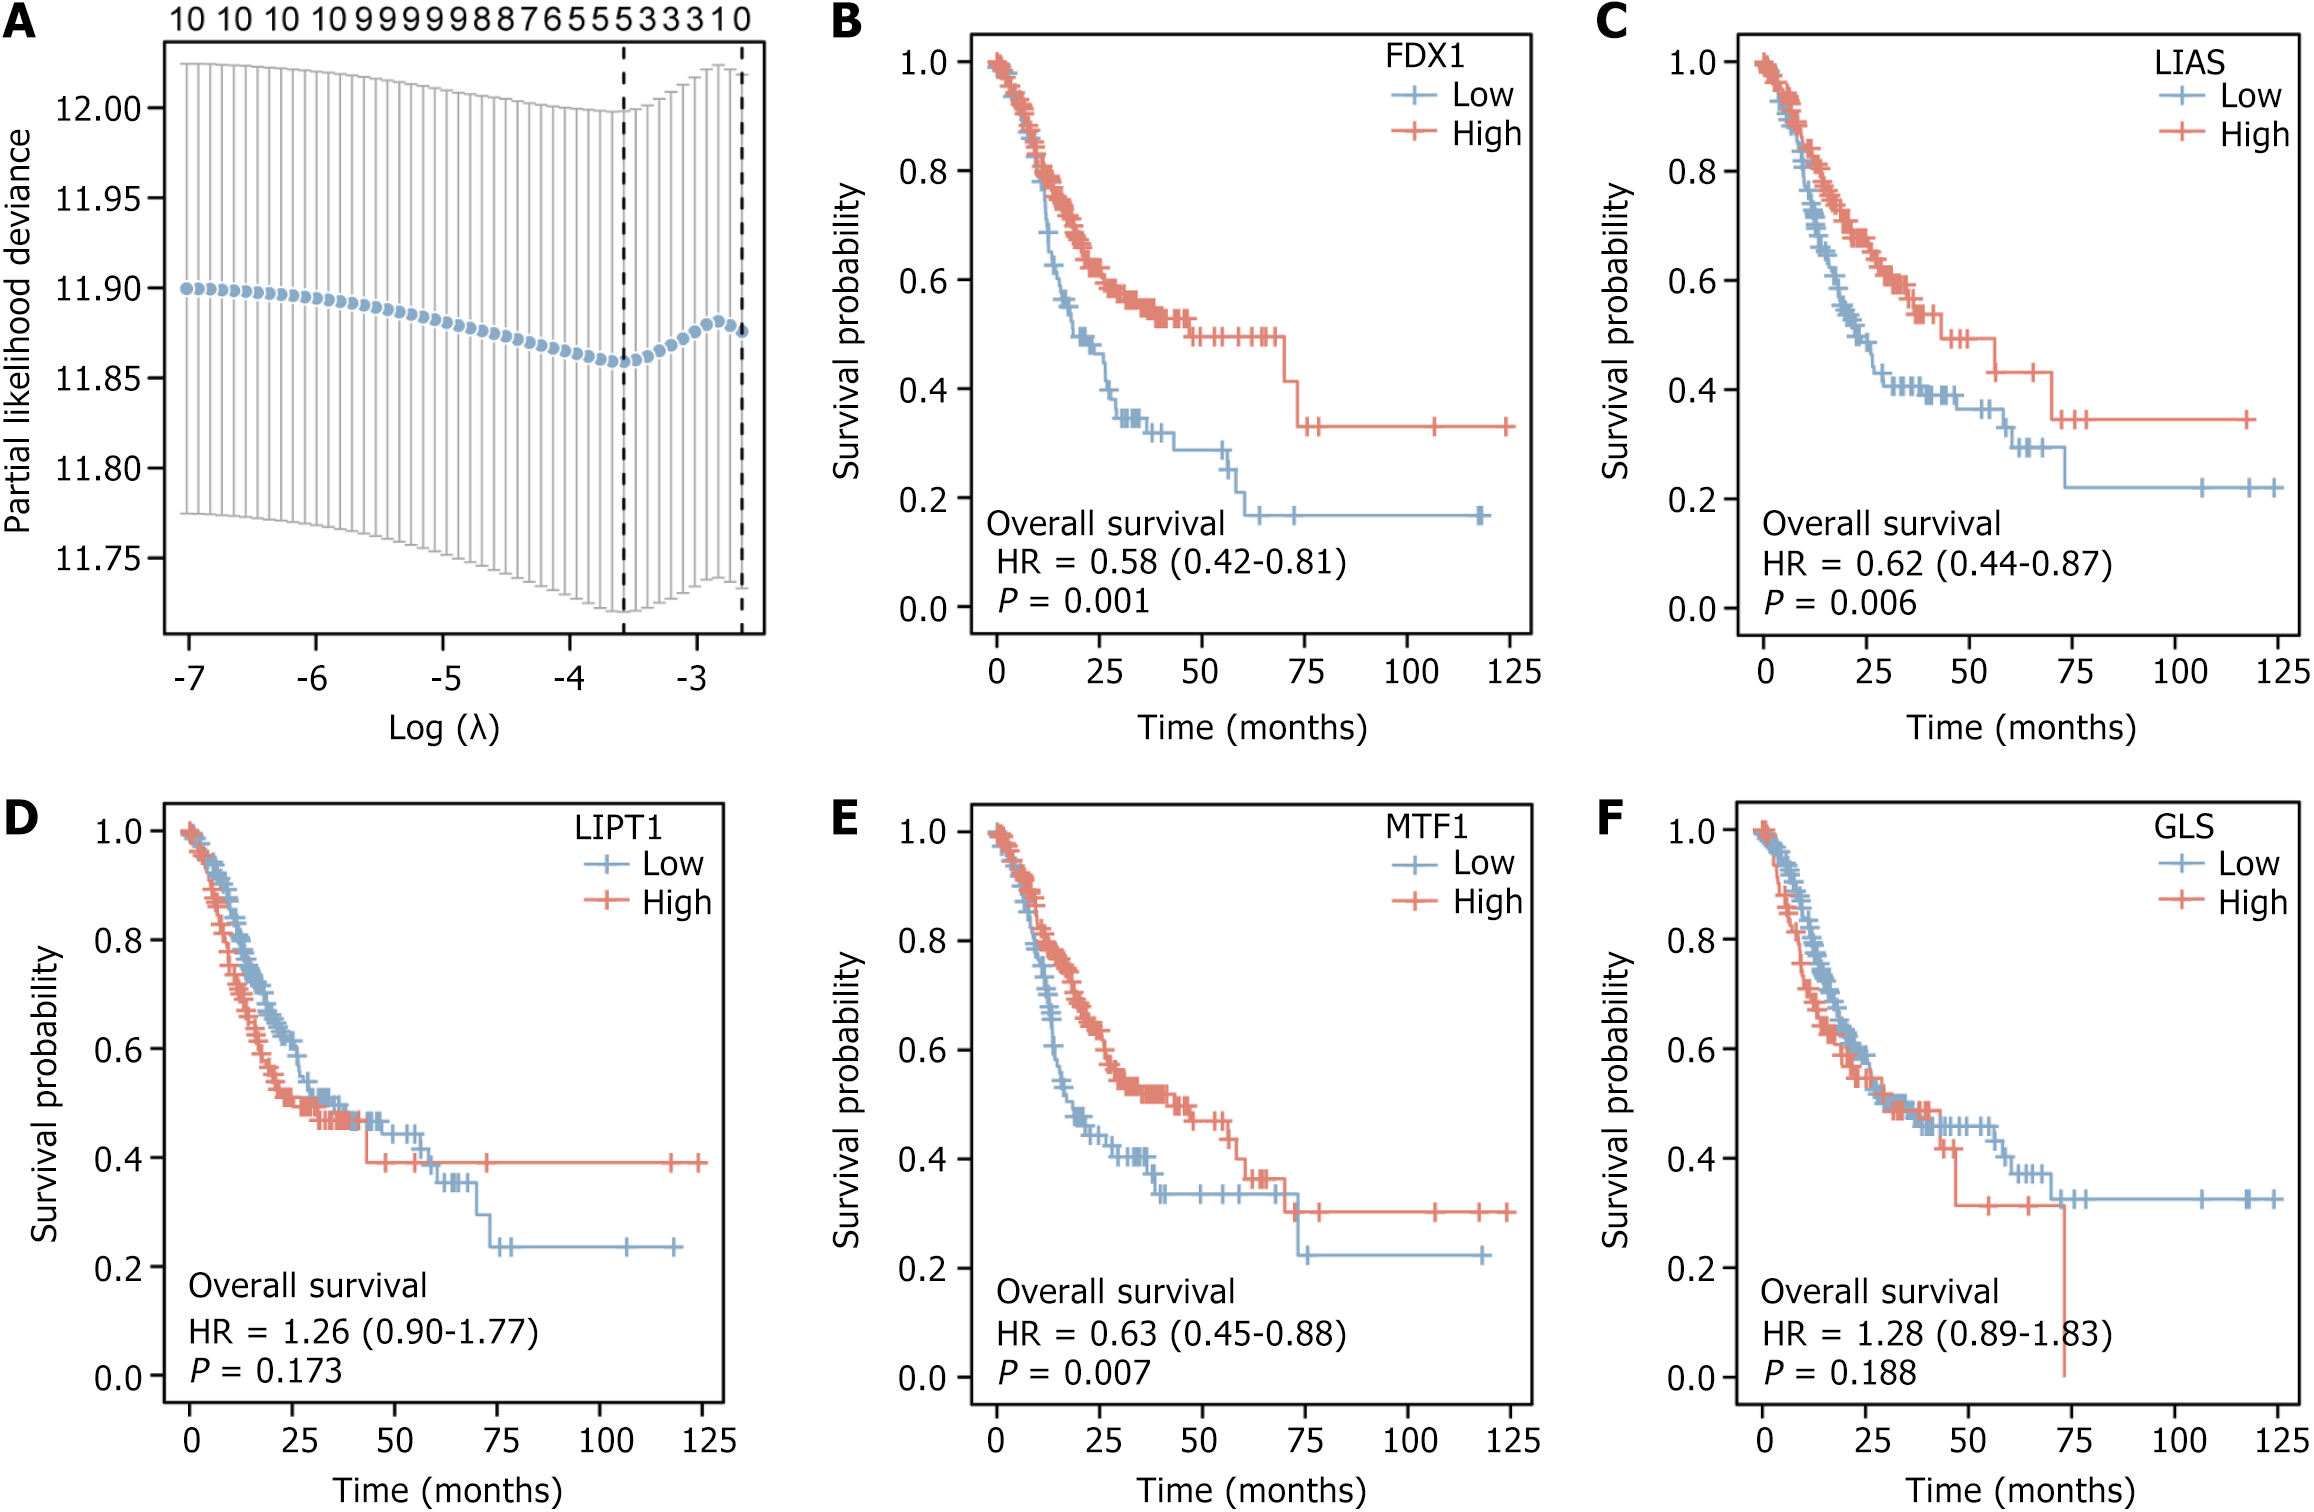
To obtain predictive models for genes connected to copper death, we selected the overall survival (OS) from the dataset TCGA-STAD clinical data and the expression profiles of genes linked to copper death (LASSO) from 353 samples of STAD for which clinical data were available in the dataset TCGA-STAD. Expression profiles of cuproptosis-related genes from 353 STAD samples with medical data in the dataset TCGA-STAD were selected utilizing a ten-fold cross-validation seed to apply LASSO regression for 2000. The results were visualized, prognosis-related genes for copper death were obtained, and Kaplan-Meier curves for prognosis-related genes were plotted.
We first utilized the limma package[13] to standardize the profile information of gene expression of 353 patients with STAD in the dataset TCGA-STAD. Depending on the risk scores from the Least Absolute Shrinkage and Selection Operator (LASSO) regression analysis, samples with risk scores more than the median were then used as a high-risk group, and samples with risk scores less than the median were used as the low-risk group, using the median risk score as the criterion. Differential analysis with subgroups of low and high risk was conducted to acquire all differentially expressed genes (DEGs) with |logFC| > 0 and P value < 0.05. The DEGs intersected with the prognosis-related genes of copper death to acquire the prognosis-related DEGs of copper death. Then the expression profile data of DEGs of copper death associated with the prognosis in the dataset TCGA-STAD were extracted and displayed in a heat map using the ComplexHeatmap package.
Gene Ontology (GO)[10] analysis is a frequent technique for large-scale functional enrichment investigations, like biological process (BP), MF and cellular component (CC). Kyoto Encyclopedia of Genes and Genomes (KEGG) is a broadly utilized database for keeping genomes, diseases, biological mechanisms, and medicines data. We initially conducted a molecular correlation study of prognosis-related DEGs for copper death using the dataset TCGA-STAD, taking P < 0.05 positive correlation Top5 genes and negative correlation Top5 genes, using the R package clusterProfiler KEGG and GO annotation analyses were conducted. Entry screening criteria were P value < 0.05, and false discovery rate (FDR) value (q value) < 0.05 was reflected as statistically significant, with P value correction by Benjamini-Hochberg (BH).
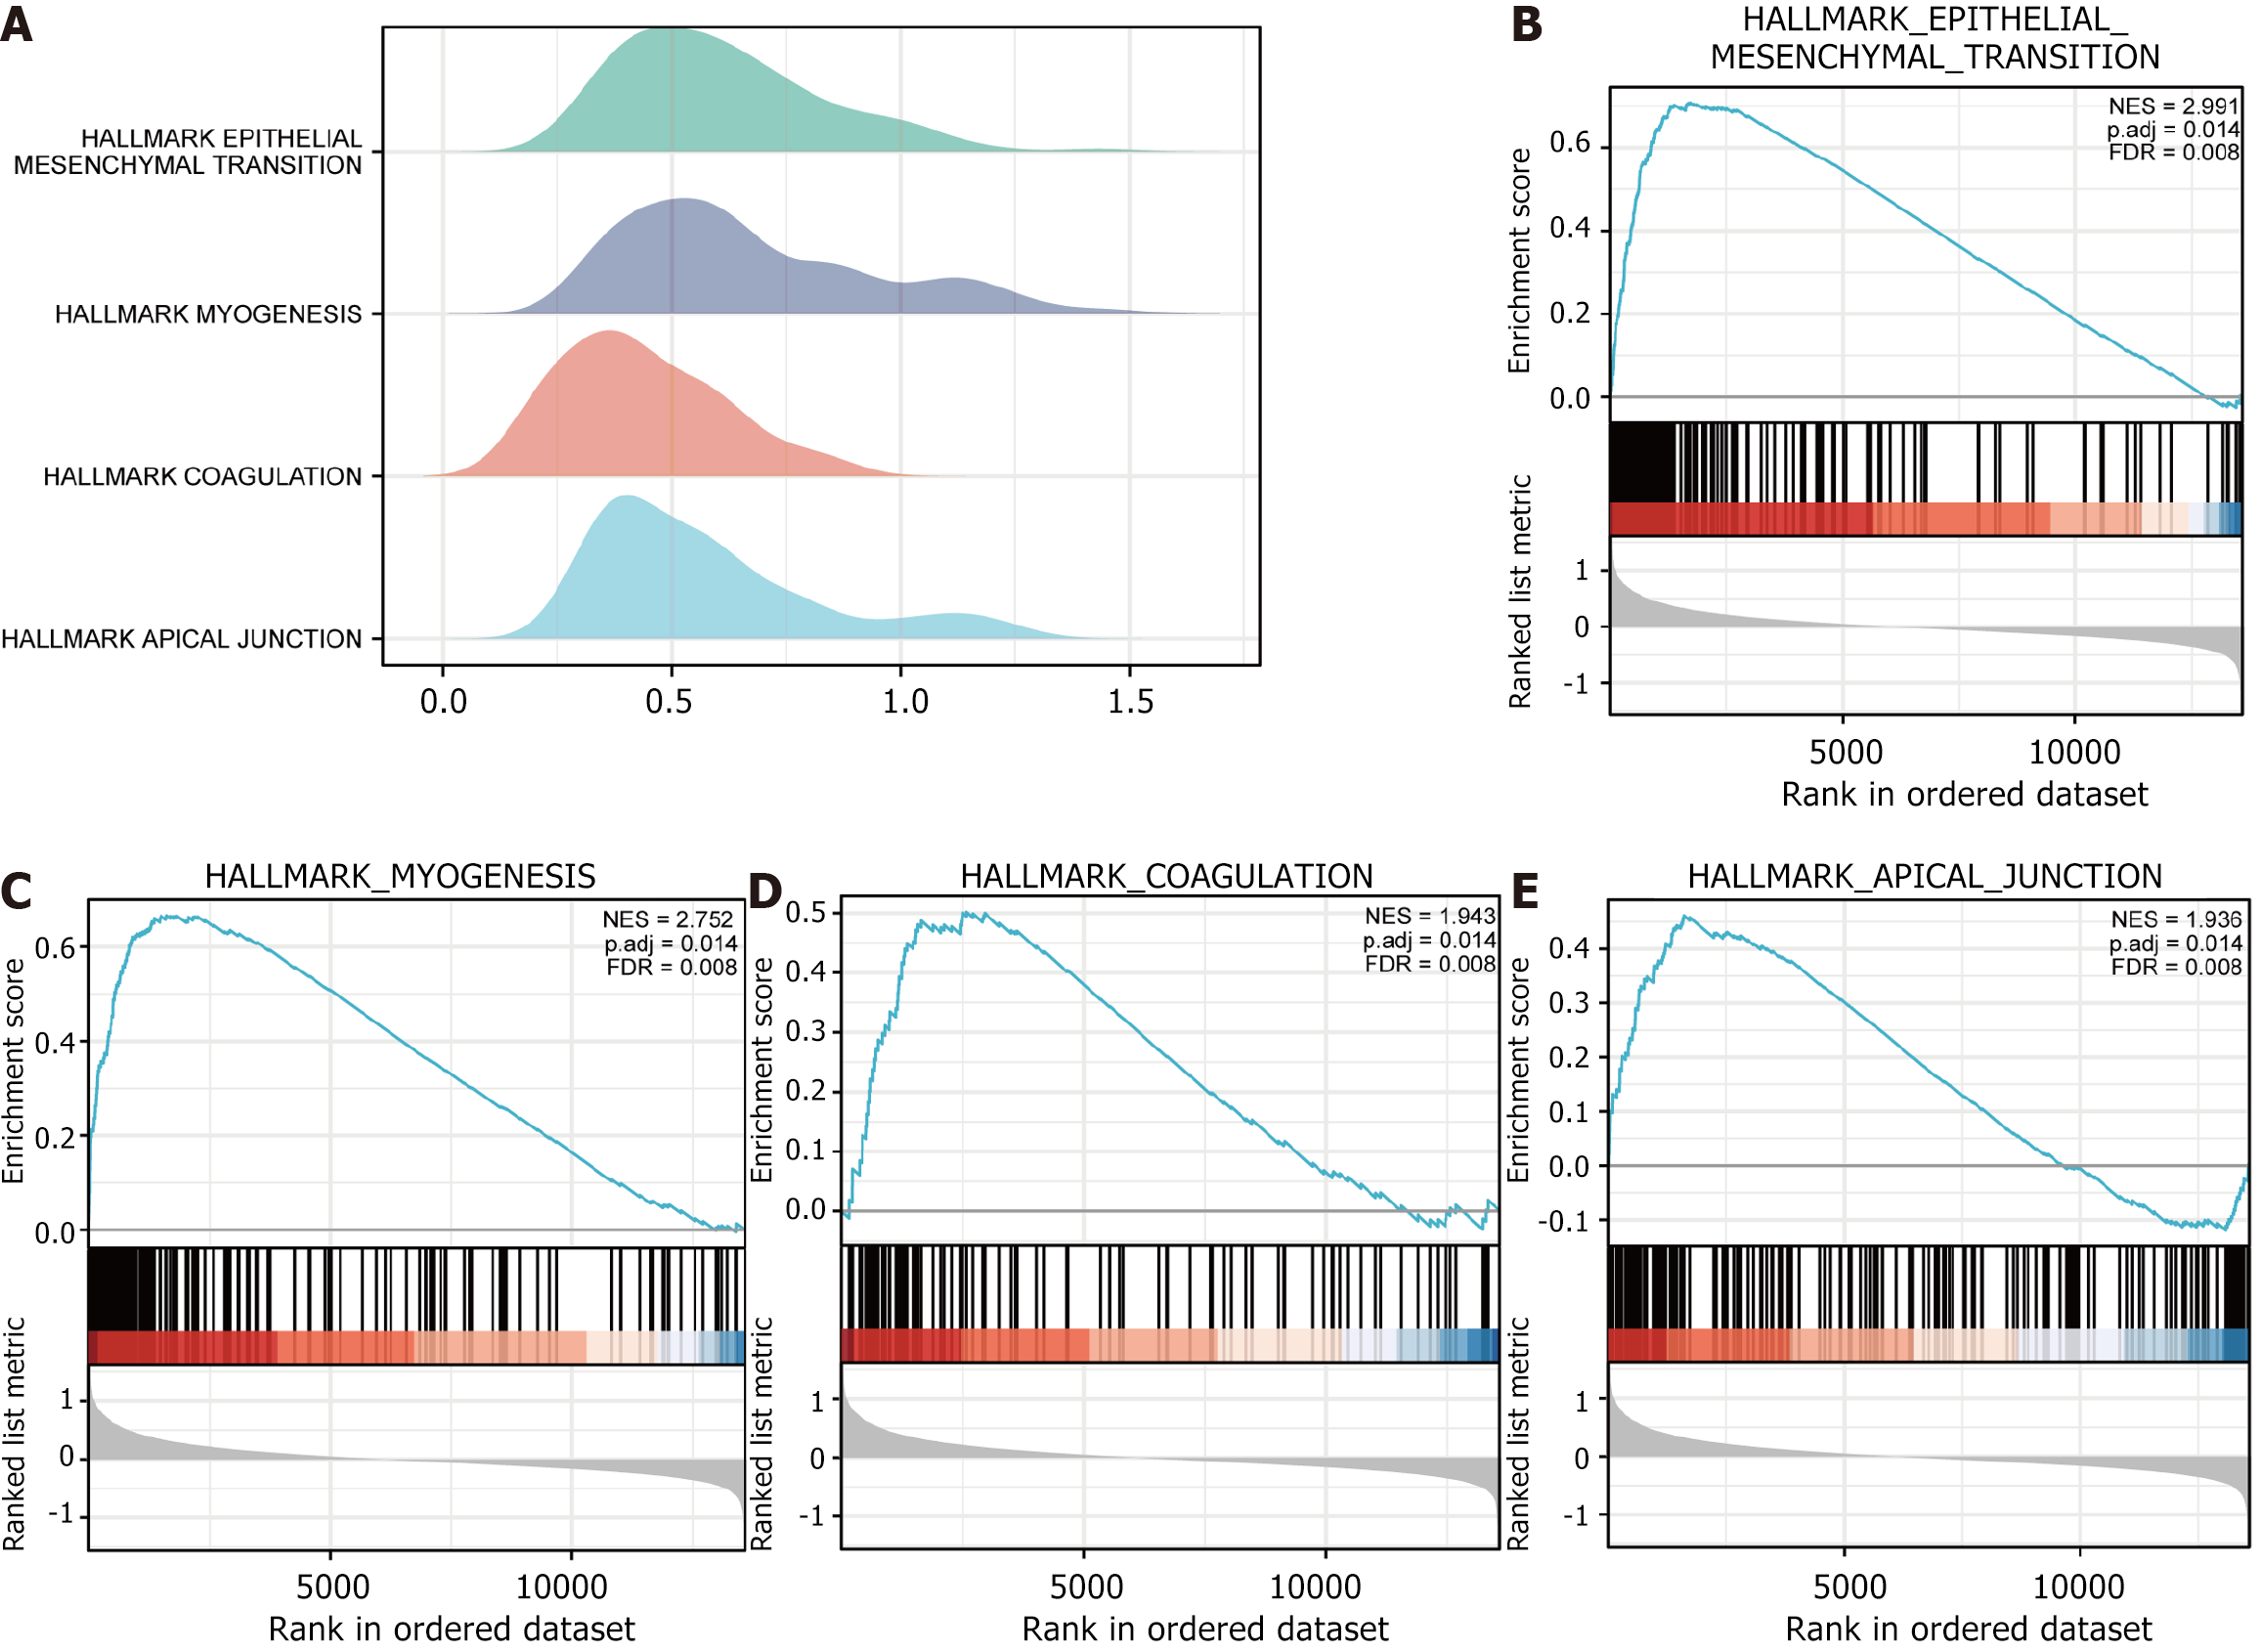
We extracted the gene expression profile data of 353 cases with STAD from the dataset TCGA-STAD for LASSO regression analysis. The median risk score was employed as the criterion for the outcome, with samples with risk scores more than the median as a group of high-risk and samples with risk scores less than the median were considered as the low-risk group. Then, the Molecular Signatures Database (MSigDB) was utilized to obtain the samples. The gene set "h.all.v7.5.2.symbols.gmt" was obtained from the MSigDB database as the reference gene set, and all genes in the gastric cancer dataset TCGA-STAD were enriched according to groups of low and high-risk utilizing the clusterProfiler package. The following were factors employed in this Gene Set Enrichment Analysis (GSEA): Seeds of 2000 with a count of 10000, a minimum of 10 genes, and a maximum of 500 genes per gene set, and a P value correction manner of BH. The screening criteria for significant enrichment were FDR and P values; both were less than 0.05. The Top4 results were visualized based on the NES.
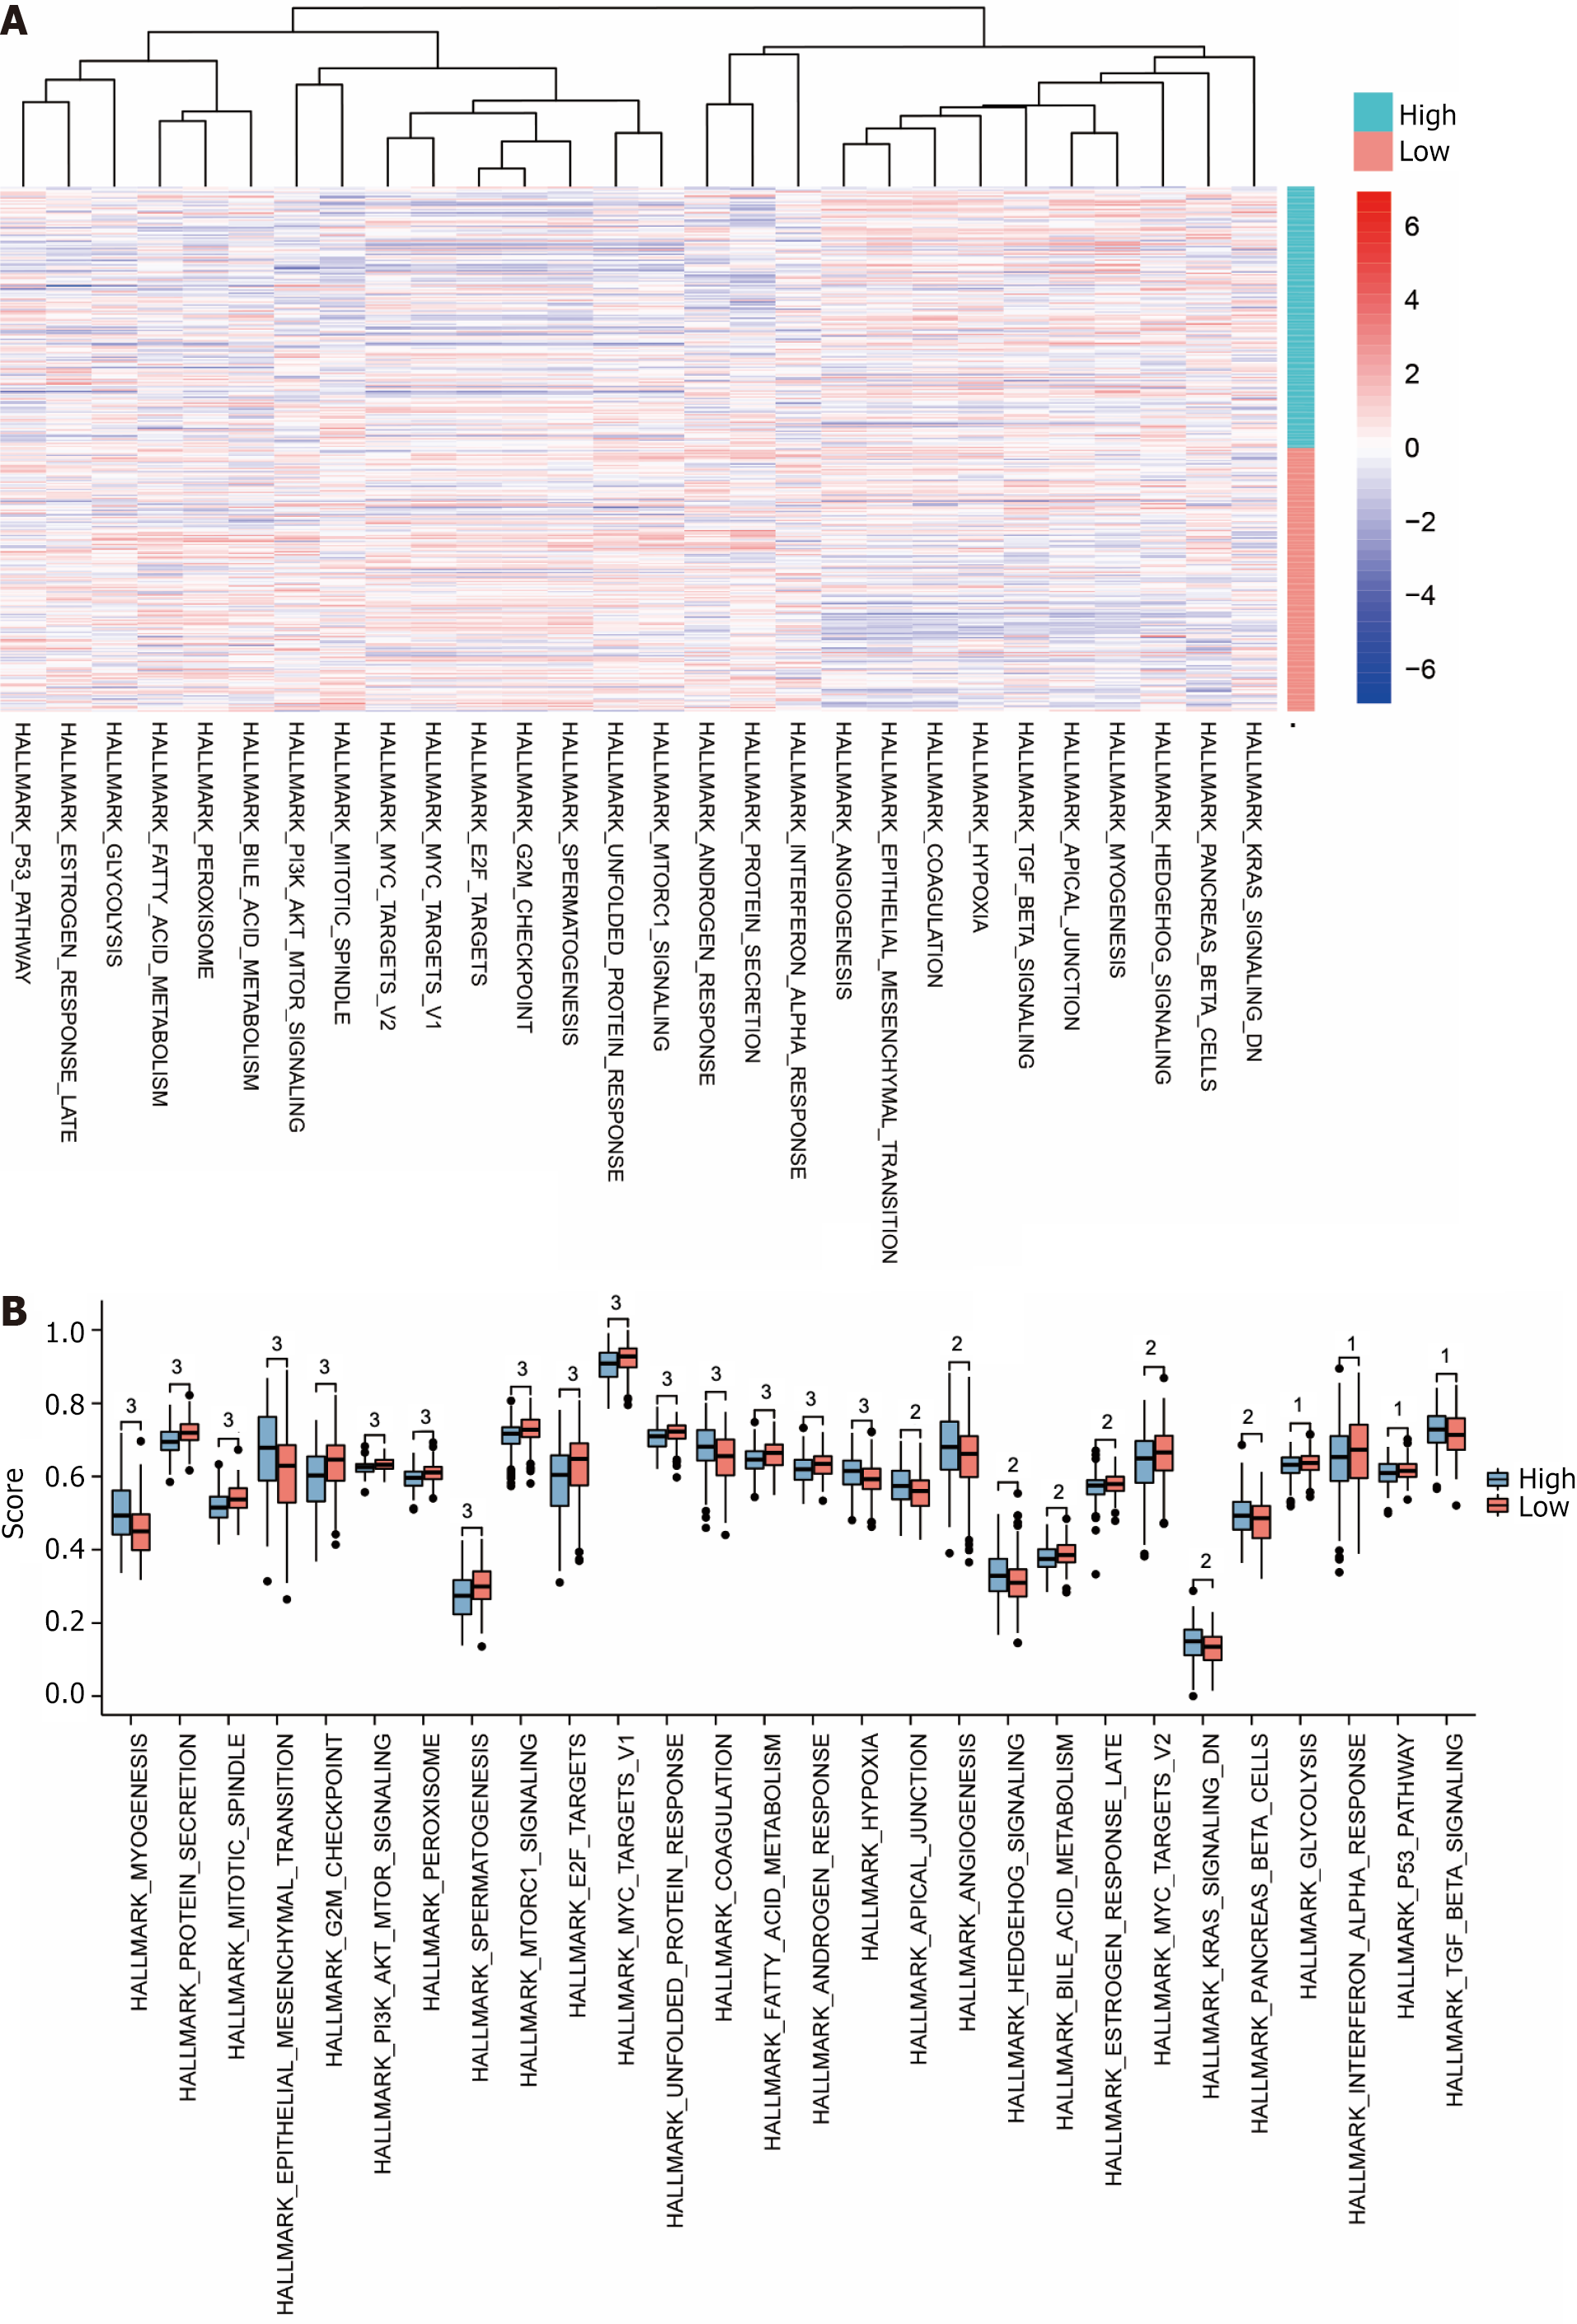
Gene Set Variation Analysis (GSVA) is an unsupervised non-parametric analysis method. Gene expression matrices between specimens are transformed into gene set expression matrices between samples to analyze the gene set enrichment outcomes of the microarray nuclear transcriptome. This is employed to assess whether different pathways are enriched among various models. We retrieved "h.all.v7.5.2.symbols.gmt" from the MSigDB database and conducted a GSVA study on the TCGA-STAD dataset. Analyze differences in functional enrichment between high- and low-risk groups in the dataset TCGA-STAD.
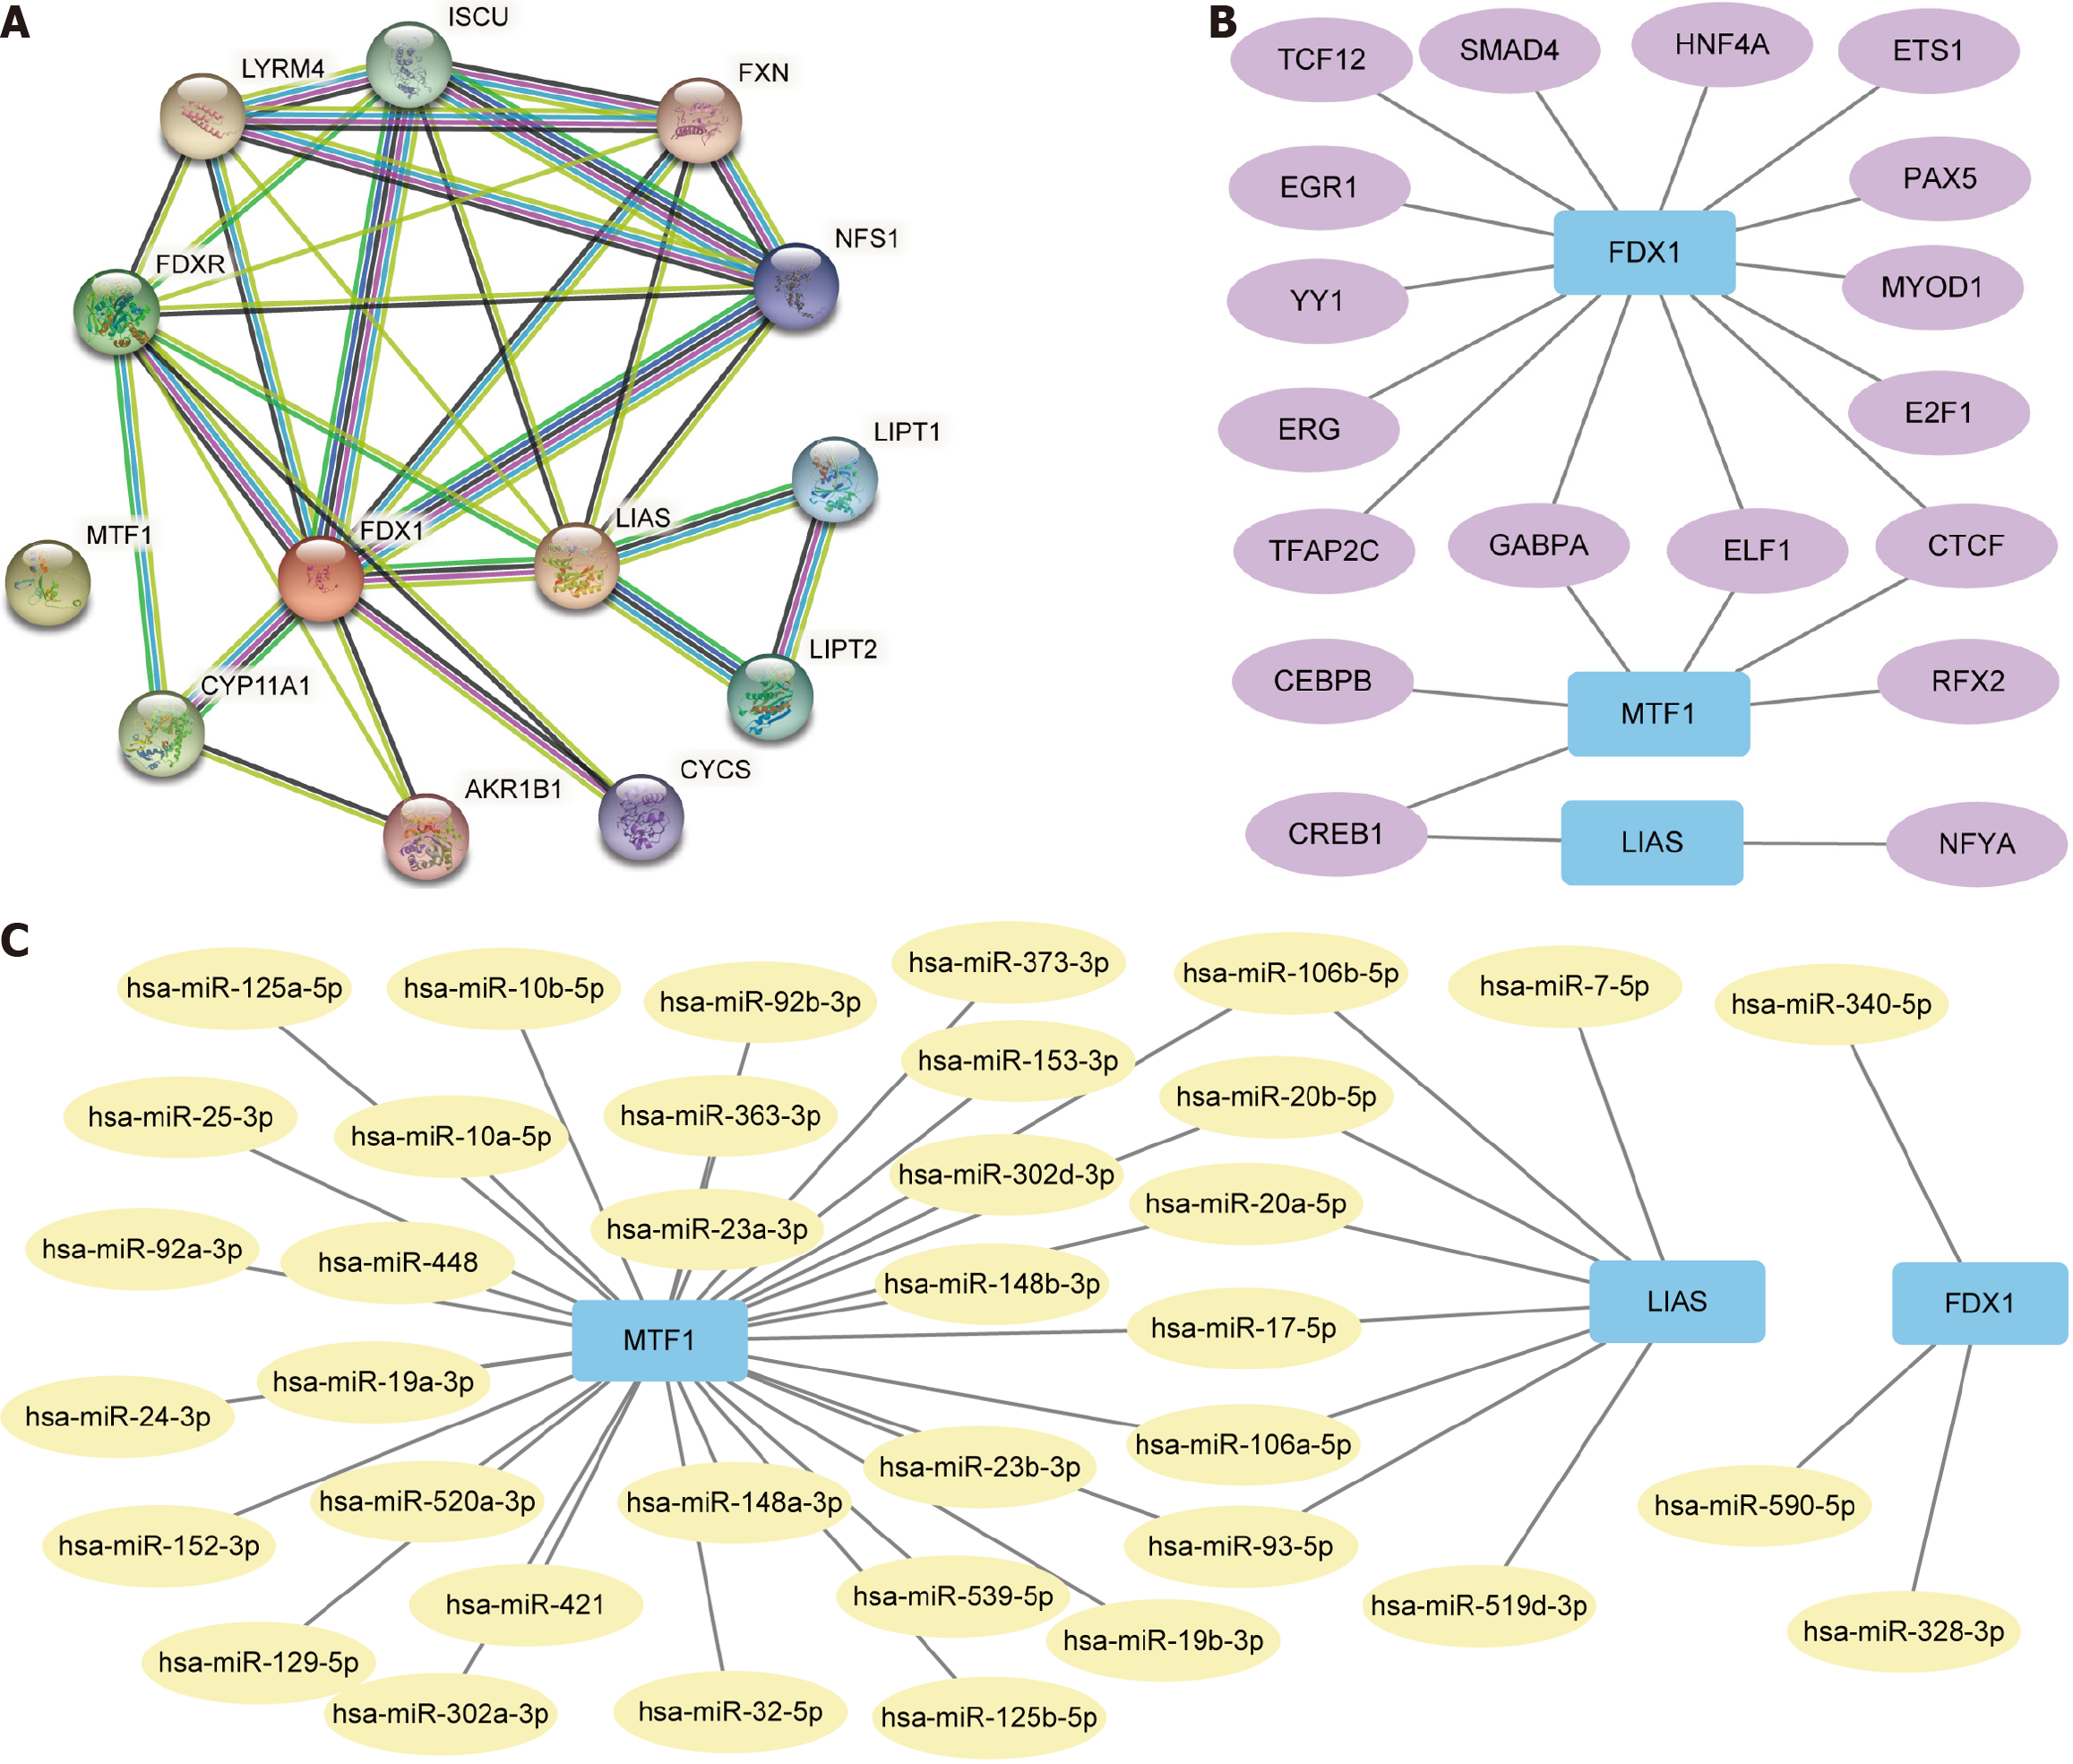
In the present investigation, we utilized the STRING database to obtain the top 10 genes with the least necessary interaction score for prognosis-related differential expression of genes associated with copper death to create a protein-protein interaction (PPI) network and use Cytoscape (version 3.9.1). Visualization of the PPI network model.
We used the Starbase and miRDB databases to predict miRNAs interacting with prognostically relevant DEGs for copper death. The intersection of the two database results was then taken, and the mRNA-miRNA interaction network was plotted using Cytoscape software.
Utilizing ChIP-seq data of DNA-binding proteins, the CHIPBase database (version 2.0; https://rna.sysu.edu.cn/chipbase/) detects thousands of binding motif matrices and their binding sites and anticipates millions of transcriptional regulatory connections between genes and transcription factors (TFs). hTFtarget database (http://bioinfo.life.hust.edu.cn/hTFtarget) is an extensive human TFs and their target modulation. Utilizing the Cytoscape program, we identified and visualized TFs that bind to DEGs linked to the prognosis of copper mortality using the hTFtarget and CHIPBase (version 2.0) databases.
Receiver operating characteristic curve (ROC) is a composite marker of a continuous variable of specificity and sensitivity, with values generally ranging from 0.5 to 1 of the area under curve (AUC). When the AUC is near 1, the diagnosis is more accurate. We plotted ROC curves for genes based on expression profile data of prognostically relevant DEGs for copper death in the dataset TCGA-STAD.
Utilizing the database of human protein atlas (HPA, www.proteinatlas.org/), DEGs’ expression connected to copper death prognosis in different human tissues was obtained, and the outcomes were displayed. We used the RCircos package. They were locating prognosis-associated DEGs in chromosomes. After using the expression profile data from the dataset TCGA-STAD to calculate the connection of other molecules in the dataset with prognosis-related DEGs, the positive Top5 and negative Top5 correlations were selected for protein-coding molecules of gene type to plot co-expression heatmaps. Then the positive Top5 and negative Top5 correlations were determined for LncRNA molecules of gene type to plot co-expression heatmaps.
To investigate the clinical predictive value of prognosis-related DEGs for copper death in STAD. We subjected prognosis-related DEGs for copper death in STAD to univariate Cox regression analysis. The factors with P < 0.05 were also selected for inclusion in the multi-factor Cox regression analysis to construct a multi-factor Cox regression model. We created a nomogram based on the one-way Cox regression analysis results to predict the survival of patients with STAD at one year, three years, and five years. Decision curve analysis (DCA) is a simple method for evaluating clinical predictive models, diagnostic tests, and molecular markers. We used the survival package to assess the effect of the nomogram model on patient survival at 1, 3, and 5 years. We analyzed the prognosis-related differential expression gene expression levels of copper death in STAD cancer tissues on the overall tumor survival overall survival, disease-specific survival, and progression-free interval effects.
The R programming (version 4.2.1) was employed for all data processing and analysis. Independent Student t-tests were utilized to determine the statistical significance of customarily distributed variables to compare two groups of continuous data. Mann-Whitney U-tests were utilized to examine differences between non-normally distributed data (i.e., Wilcoxon rank sum tests). To compare and analyze the statistical significance between the two groups of subjected prognosis-related DEGs for copper death in STAD to univariate Cox regression analysis was employed to conduct survival analysis, the Kaplan-Meier survival curve was utilized to detect changes in survival and the log-rank test was used to evaluate the statistical significance of variations in survival time between the two patient groups. The survival R program was the basis for the univariate and multifactorial Cox analyses, while the lasso analyses used the glmnet R package. At P < 0.05, each statistical P value was two-sided and statistically significant.
We selected the OS from the dataset TCGA-STAD clinical data and the expression profile data of genes connected to copper death (cuproptosis-related genes) from the dataset TCGA-STAD to construct the LASSO regression prognostic model to obtain five genes (FDX1, LIAS, LIPT1, MTF1, GLS, Figure 2A). Based on the prognostic information of the dataset TCGA-STAD, we plotted these five genes [FDX1 (P = 0.001, Figure 2B), LIAS (P = 0.006, Figure 2C), LIPT1(P = 0.173, Figure 2D), MTF1 (P = 0.007, Figure 2E), GLS (P = 0.188, Figure 2F)] K-M curves, of which we selected three genes
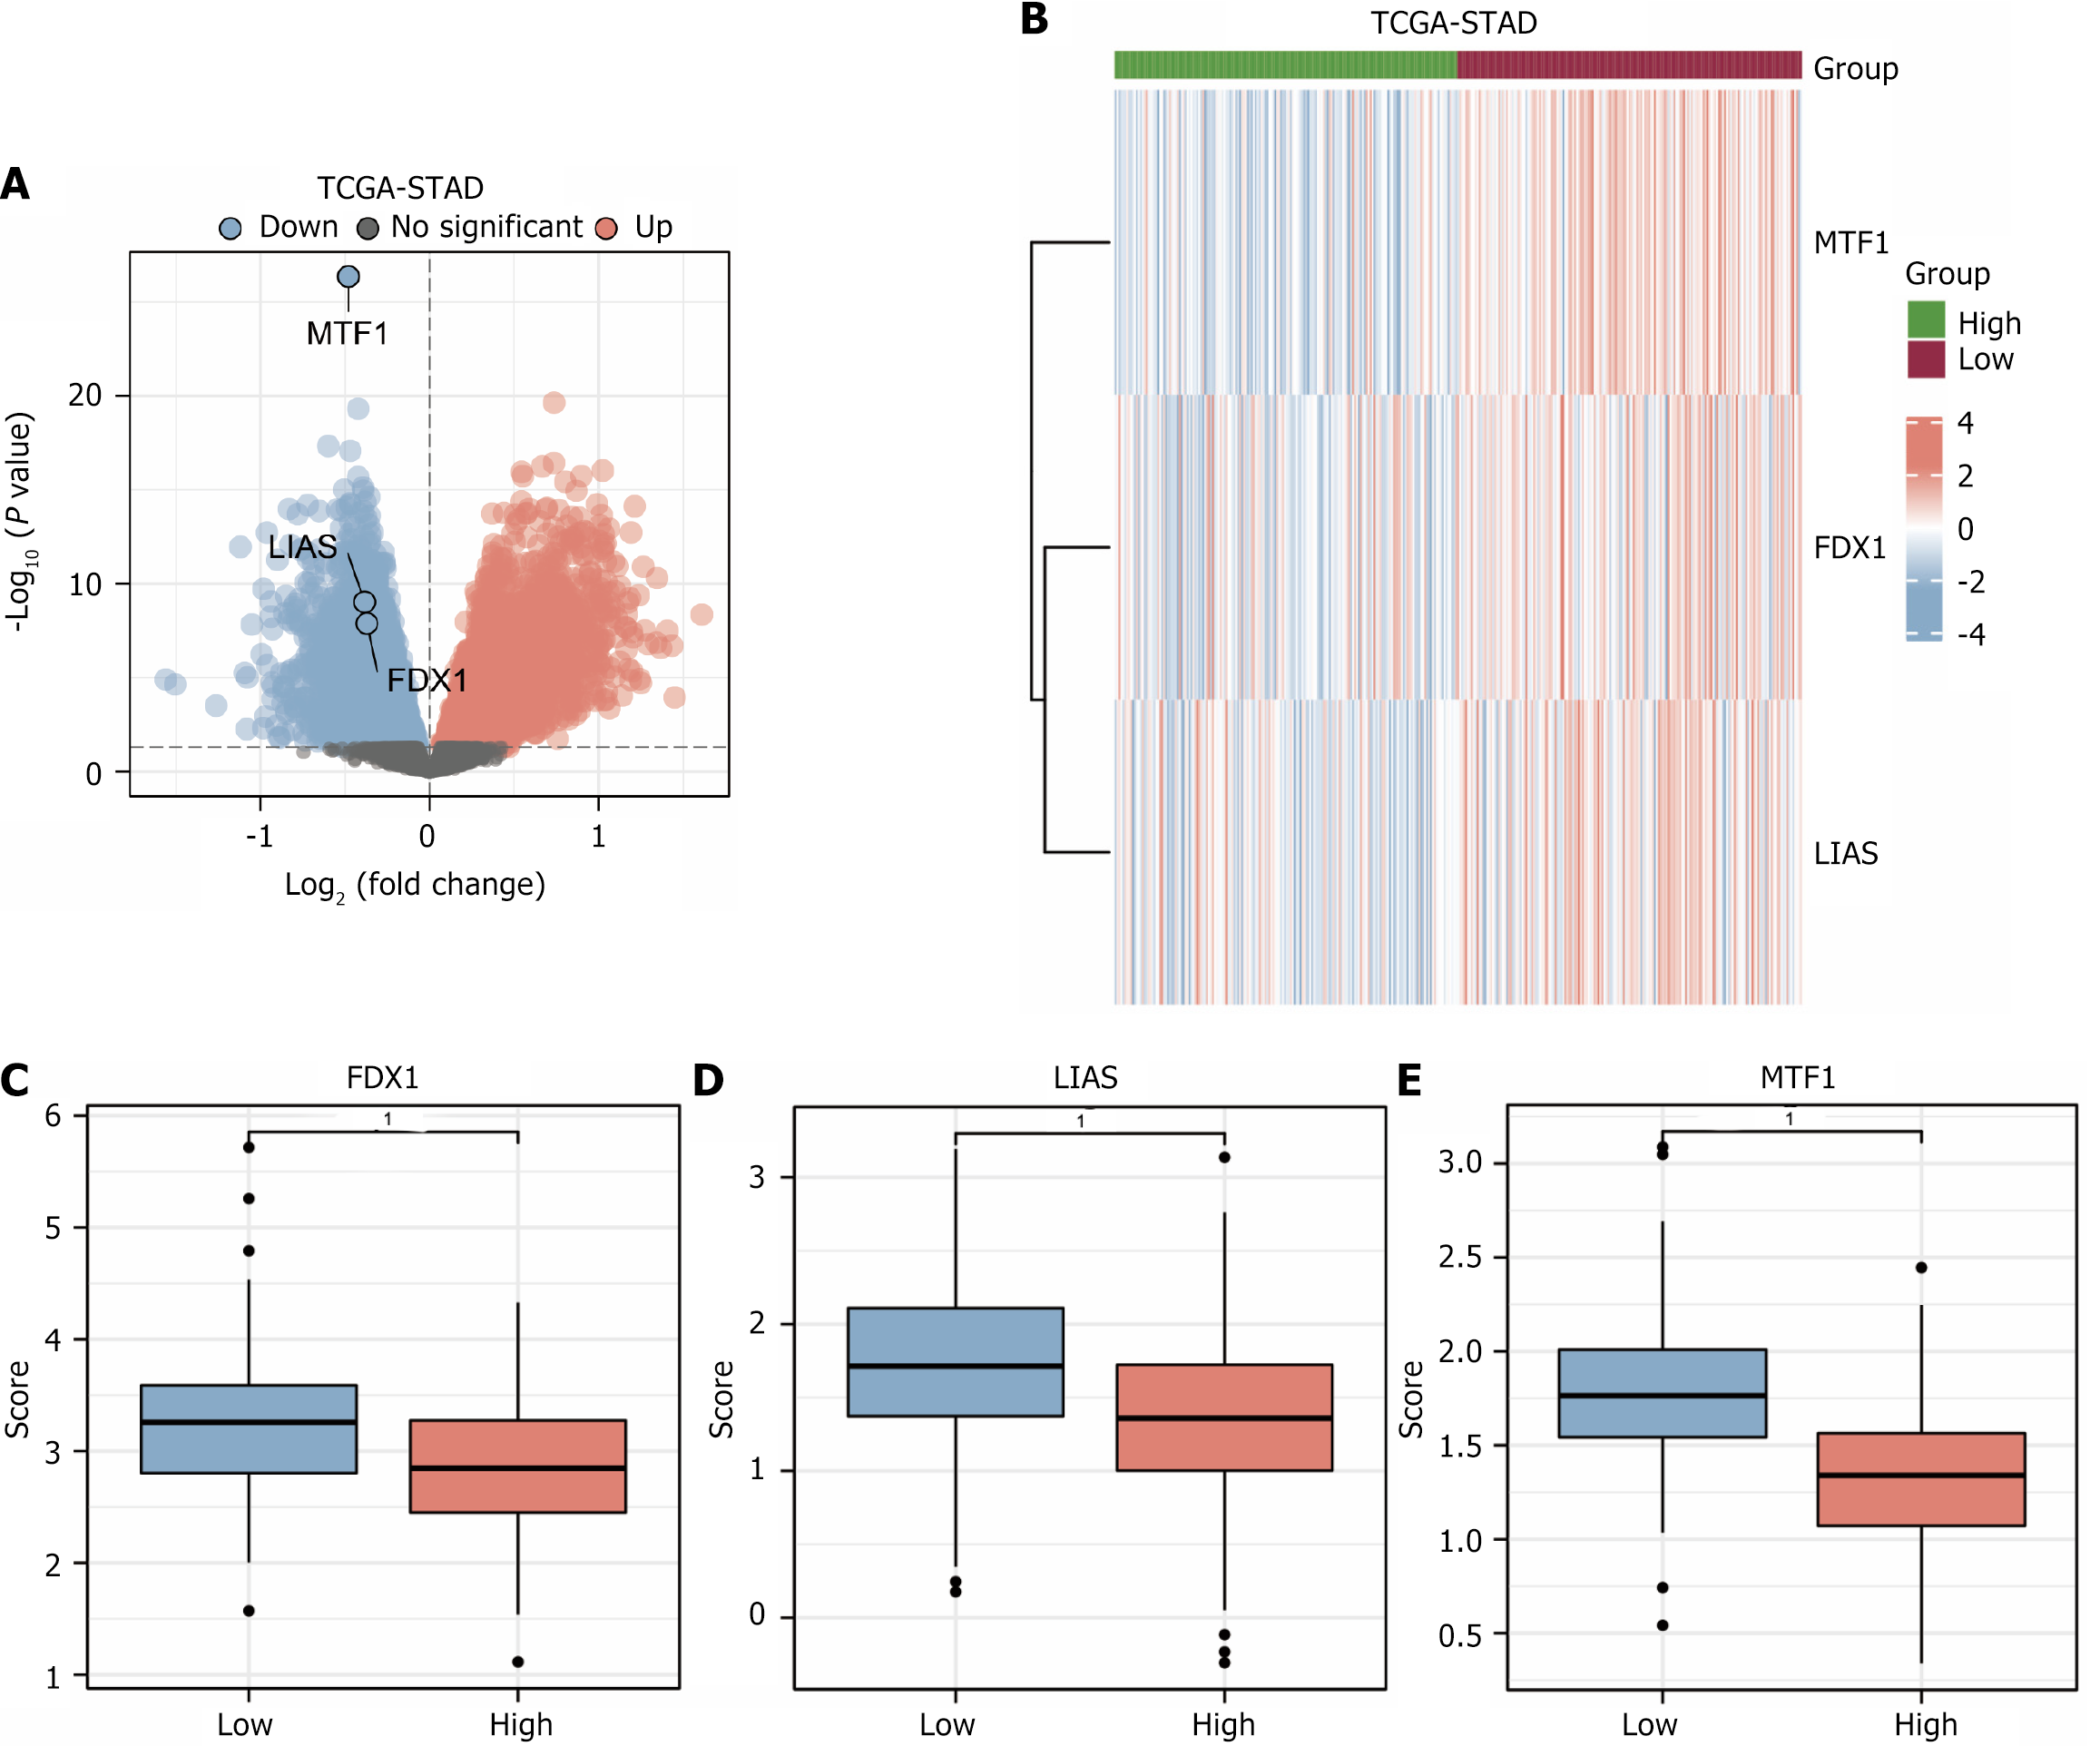
Using the limma package, we first normalized the GEP data of 353 subjects with STAD in the dataset TCGA-STAD. Then, depending on the risk scores from the LASSO regression analysis outcomes, the samples with risk scores more than the median were considered as the group of high risk, and those with risk scores less than the median were considered as the low-risk group. DEGs were obtained by differential analysis in low and high-risk groups and volcano plotting of the differential analysis results (Figure 3A). The results were as follows: the data set TCGA-STAD had a total of 7330 DEGs satisfying |logFC| > 0 and P value < 0.05. DEGs were intersected with copper death prognosis-related genes to obtain three copper death prognosis-related differentially expressed genes (FDX1, LIAS, MTF1). The expression profile data of copper death prognosis-related DEGs were then extracted, and heatmaps were drawn utilizing the ComplexHeatmap package (Figure 3B). To demonstrate the expression of copper death prognosis-related DEGs in the dataset TCGA-STAD. The outcomes show that gene FDX1, gene LIAS, and gene MTF1 are differentially expressed genes down-regulated in both high and low-risk groupings.
Finally, we plotted group comparison plots for gene FDX1 (Figure 3C), gene LIAS (Figure 3D), and gene MTF1 (Figure 3E) based on the different groupings in the dataset TCGA-STAD to demonstrate the DEGs linked with copper death prognosis in different sets of expression in various groups. The outcomes exhibited P < 0.001 for FDX1, LIAS, and MTF1 in the low and high-risk subgroups.
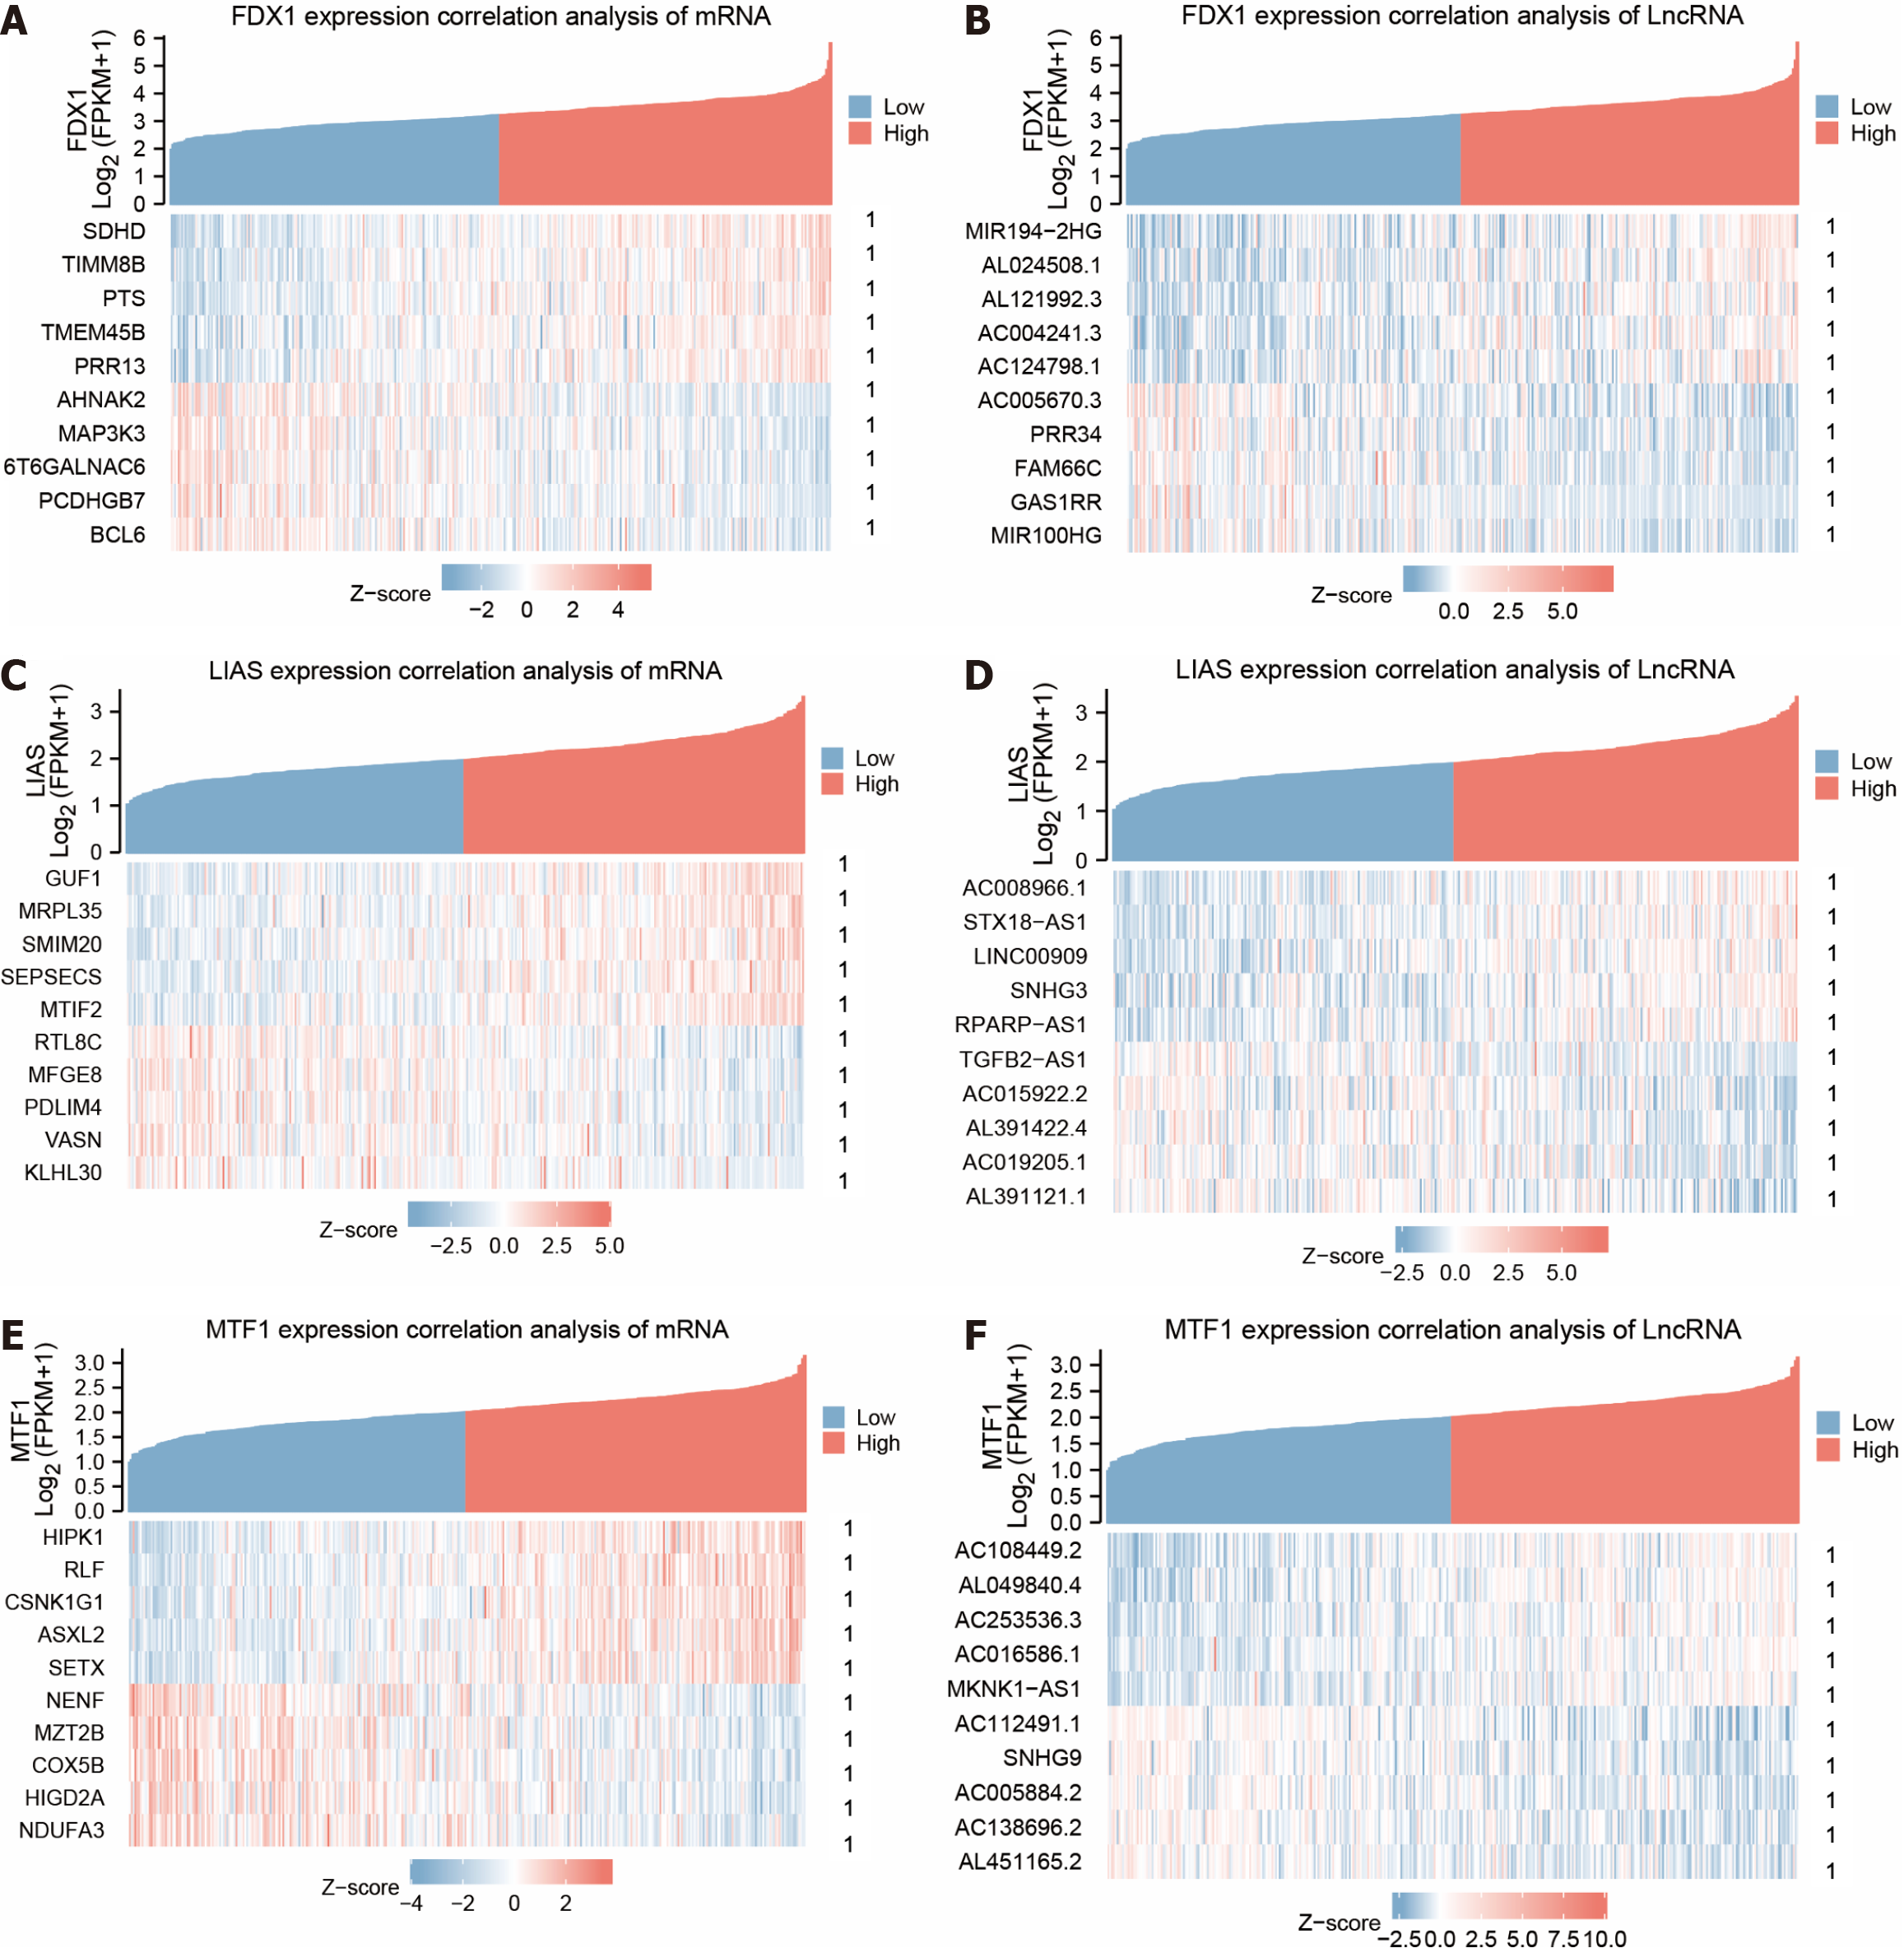
We used the expression profile data from the dataset TCGA-STAD to calculate the association of other molecules in the dataset with the gene FDX1, the gene LIAS and the gene MTF1. We selected the results of the correlation analysis of gene FDX1 in molecular type for protein-coding molecules (P < 0.05) to take positive correlation Top5 and negative correlation Top5 to plot the co-expression heat map of gene FDX1 in the dataset TCGA-STAD (Figure 4A). Then the molecules with gene type lncRNA (P < 0.05) were selected to take positive correlation Top5 and negative correlation Top5 to plot the co-expression heat map of gene FDX1 in the dataset TCGA-STAD (Figure 4B). The correlation analysis outcomes of gene LIAS were then selected for the molecular type of protein-coding molecules (P < 0.05) to plot the co-expression heat map of gene LIAS in the dataset TCGA-STAD by taking the positive correlation Top5 and negative correlation Top5 (Figure 4C). Then the molecules with gene type lncRNA (P < 0.05) were selected to take positive correlation Top5 and negative correlation Top5 to plot the co-expression heat map of gene LIAS in the dataset TCGA-STAD (Figure 4D). Finally, the results of correlation analysis of gene MTF1 were selected for the molecular type of protein-coding molecules (P < 0.05) to take positive correlation Top5 and negative correlation Top5 to plot the co-expression heat map of gene MTF1 in dataset TCGA-STAD (Figure 4E) After selecting molecules with gene type lncRNA (P < 0.05) taking positive correlation Top5 and negative correlation Top5 to plot the co-expression heat map of gene MTF1 in dataset TCGA-STAD (Figure 4F).
The correlation between gene LIAS and protein-coding molecules GUF1, MRPL35, SMIM20, SEPSECS, and MTIF2 gradually increased with increasing gene expression. In contrast, the association between gene LIAS and protein-coding molecules RTL8C, MFGE8, PDLIM4, VASN, KLHL30 gradually decreased with increasing gene expression. The connection between gene LIAS and LncRNA molecules AC008966.1, STX18-AS1, LINC00909, SNHG3, RPARP-AS1 gradually increased with increasing gene expression, and the relationship between gene LIAS and LncRNA molecules TGFB2-AS1, AC015922.2, AL391422.4 AC019205.1, AL391121.1 correlated progressively lower with increasing gene expression.
The association between gene MTF1 and protein-coding molecules HIPK1, RLF, CSNK1G1, ASXL2, and SETX gradually increased with increasing gene expression, and the connection between gene MTF1 and protein-coding molecules NENF, MZT2B, COX5B, HIGD2A, NDUFA3 gradually decreased with the increase in gene expression. The relationship between gene MTF1 and LncRNA molecules AC108449.2, AL049840.4, AC253536.3, AC016586.1, MKNK1-AS1 gradually increased with increasing gene expression, and the correlation between gene MTF1 and LncRNA molecules AC112491.1, SNHG9, AC005884.2 AC138696.2, AL451165.2 correlated progressively lower with increasing gene expression.
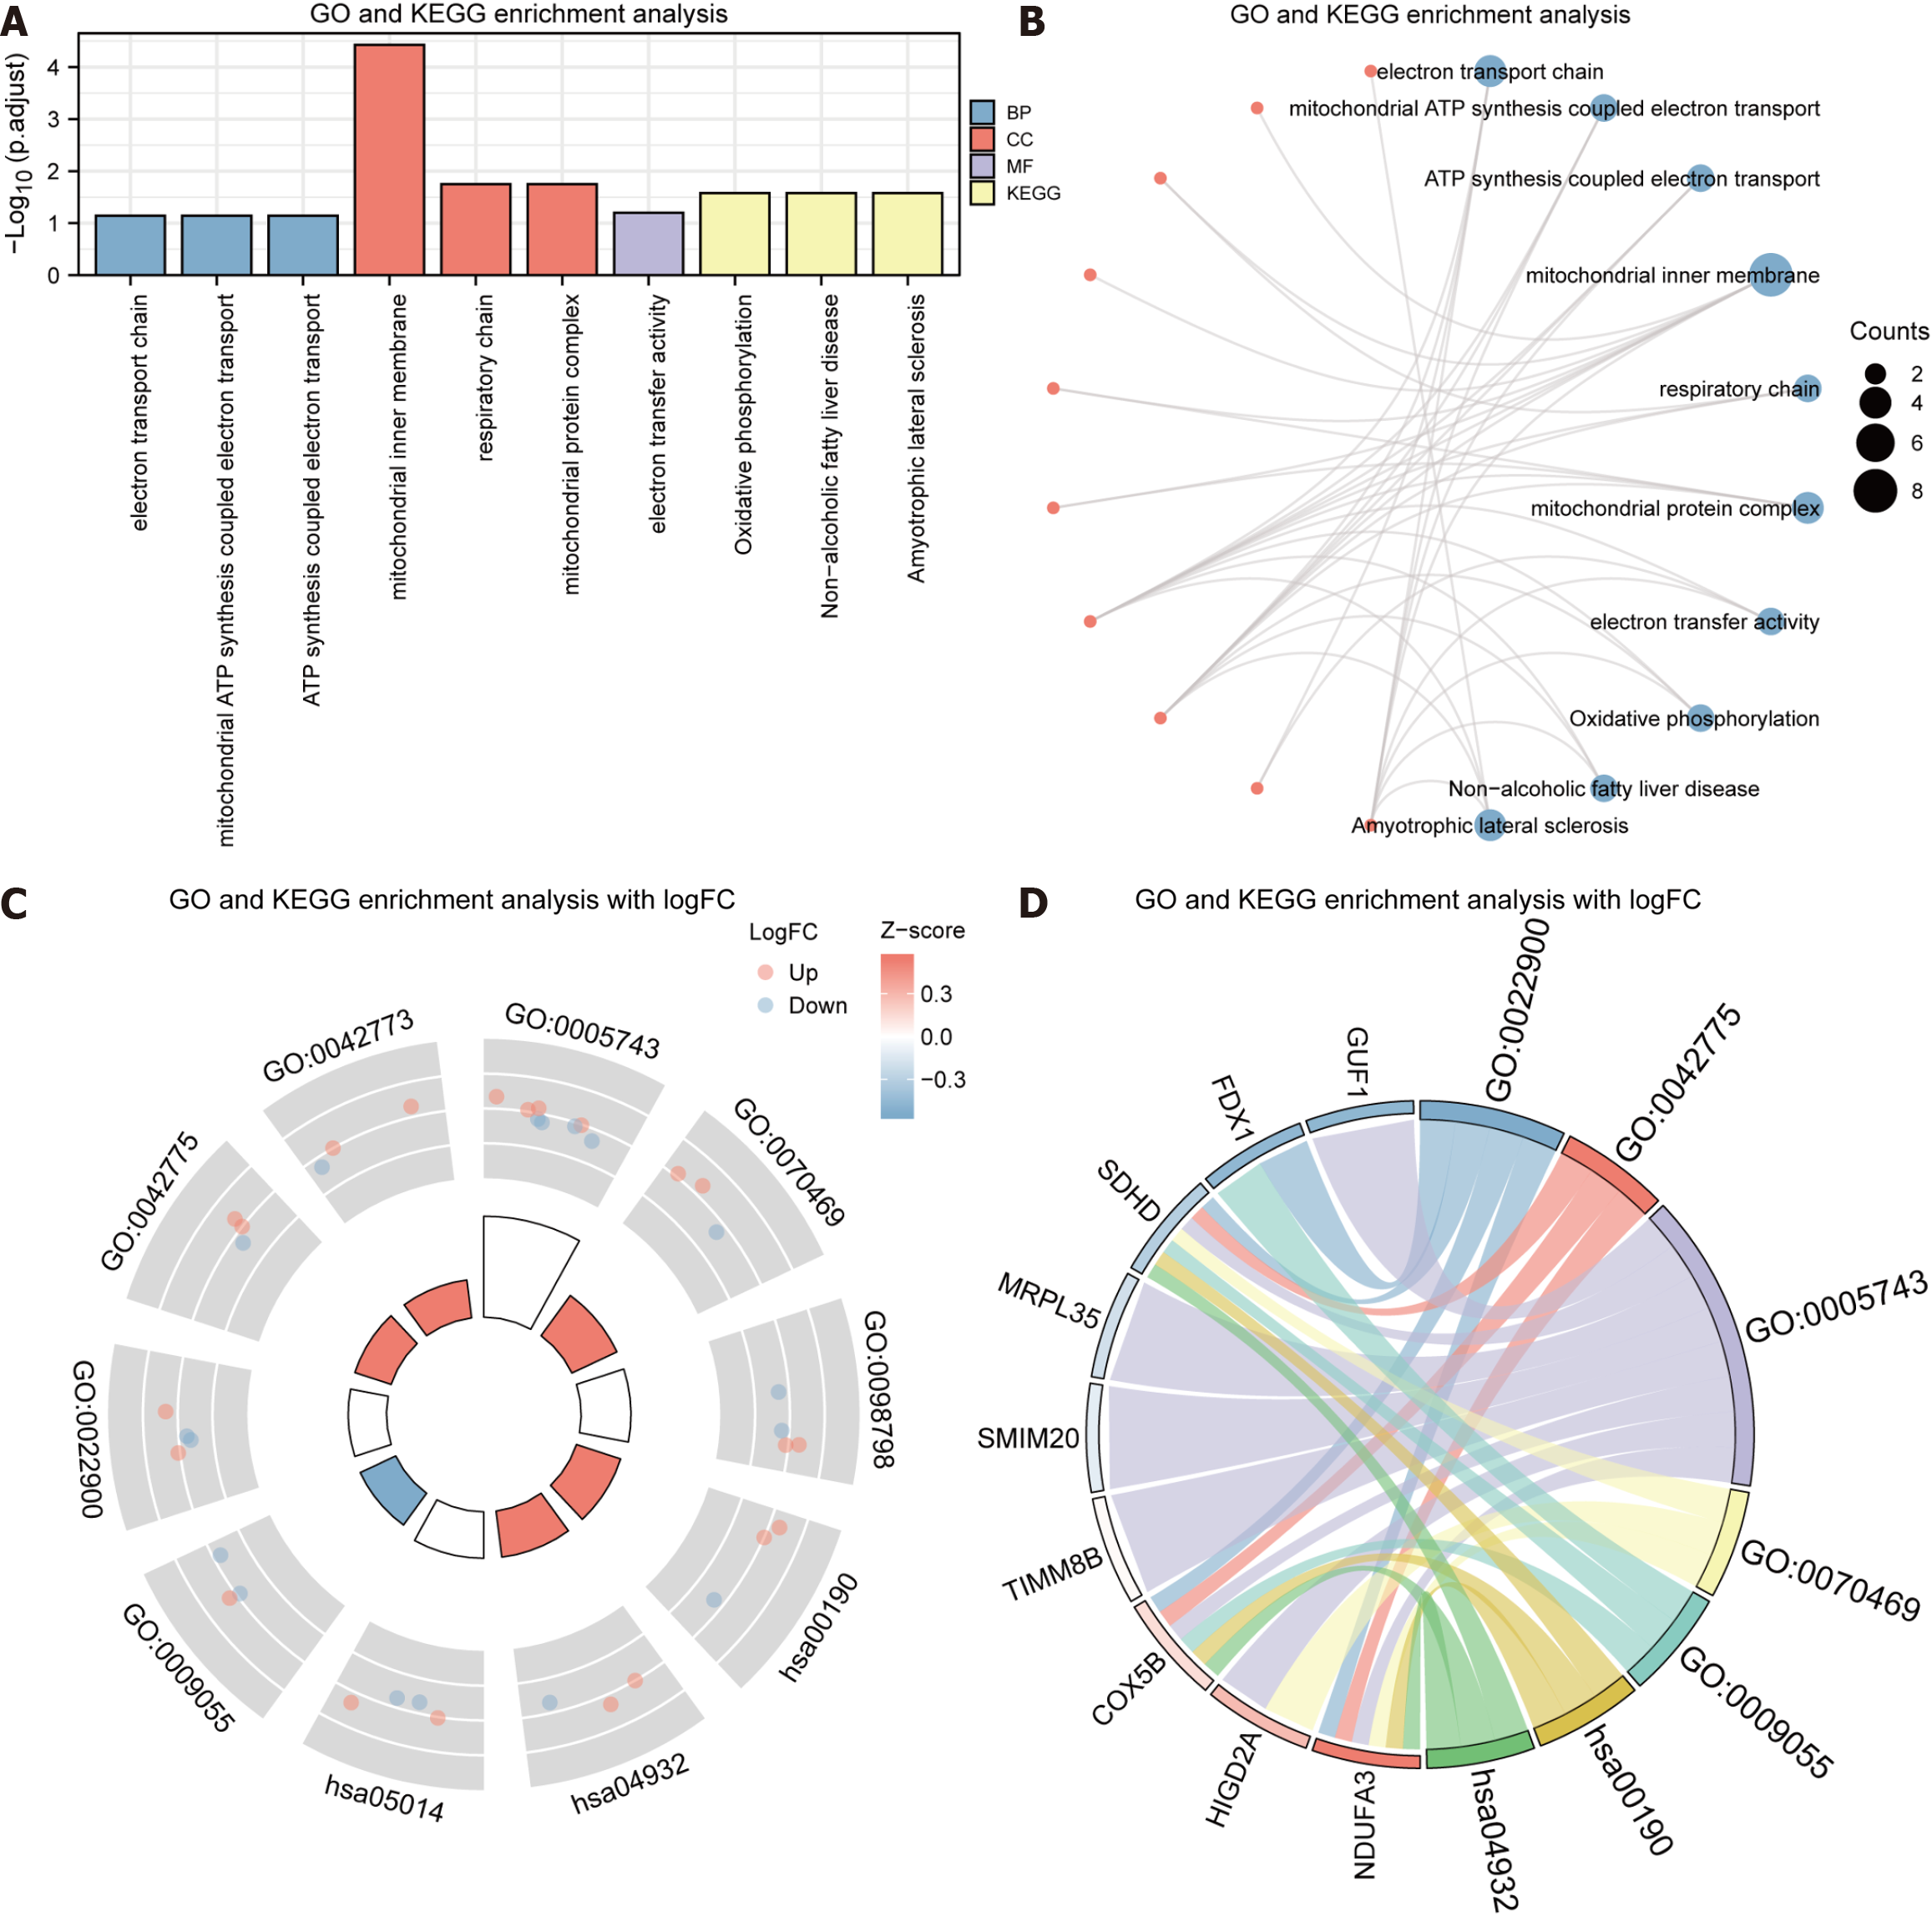
We selected the gene FDX1, the gene LIAS and the gene MTF1 with the molecule type used in the co-expression heat map drawn for the protein code as co-expressed genes for the three genes for 30 co-expressed genes. We enriched these 30 genes along with the three copper death prognosis-related DEGs for a total of 33 genes for analysis. These 33 genes were utilized for GO and KEGG gene functional enrichment analysis, which demonstrated that they were primarily enriched in the BP, including the ATP synthesis coupled electron transport, electron transport chain, mitochondrial ATP synthesis related electron transport, mitochondrial inner membrane, mitochondrial protein complex, respiratory chain CC, and MF of electron transfer activity. It was also enriched in KEGG pathways like Non-alcoholic fatty liver disorder and Oxidative phosphorylation. The GO and the KEGG gene functional enrichment analyses outcomes are visualized in a bar chart (Figure 5A and Table 2).
| Ontology | ID | Description | P value | P adjust | Q value |
| BP | GO: 0022900 | Electron transport chain | 1.62e-04 | 0.072 | 0.060 |
| BP | GO: 0042775 | Mitochondrial ATP synthesis coupled electron transport | 4.05e-04 | 0.072 | 0.060 |
| BP | GO: 0042773 | ATP synthesis coupled electron transport | 4.18e-04 | 0.072 | 0.060 |
| BP | GO: 2000773 | Negative regulation of cellular senescence | 4.92e-04 | 0.072 | 0.060 |
| BP | GO: 0022904 | Respiratory electron transport chain | 7.01e-04 | 0.078 | 0.065 |
| CC | GO: 0005743 | Mitochondrial inner membrane | 5.02e-07 | 3.72e-05 | 3.07e-05 |
| CC | GO: 0070469 | Respiratory chain | 5.13e-04 | 0.018 | 0.015 |
| CC | GO: 0098798 | Mitochondrial protein complex | 7.23e-04 | 0.018 | 0.015 |
| MF | GO: 0009055 | Electron transfer activity | 8.42e-04 | 0.063 | 0.047 |
| KEGG | hsa00190 | Oxidative phosphorylation | 0.001 | 0.026 | 0.016 |
| KEGG | hsa04932 | Non-alcoholic fatty liver disease | 0.002 | 0.026 | 0.016 |
| KEGG | hsa05014 | Amyotrophic lateral sclerosis | 0.003 | 0.026 | 0.016 |
| KEGG | hsa04714 | Thermogenesis | 0.007 | 0.046 | 0.028 |
| KEGG | hsa05012 | Parkinson disease | 0.008 | 0.046 | 0.028 |
Meanwhile, network diagrams were drawn based on the outcomes of GO functional and KEGG pathway enrichment analyses (Figure 5B). The connecting lines illustrate the corresponding molecules and the annotations of the related entries; the more significant the node, the greater the number of molecules contained in the entry. Finally, we used the logFC values of 32 of these 33 genes from the TCGA-STAD differential analysis to perform a combined logFC analysis of function enrichment and KEGG pathway enrichment, and depending on the enrichment analysis, the logFC of the molecules was employed to detect the standard score (Z-score) for each entry) and visualized by circle plot (Figure 5C) and chord plot (Figure 5D).
To detect all gene impacts on pathway expression levels in the STAD dataset TCGA-STAD, we used the cluster profile package to perform GSEA on all genes in the dataset TCGA-STAD according to groups of low and high risk. GSEA was conducted to take the NES of the star pathways and plot the mountain range (Figure 6A) are significantly enriched in HALLMARK EPITHELIAL MESENCHYMAL TRANSITION (Figure 6B), HALLMARK MYOGENESIS (Figure 6C), HALLMARK COAGULATION (Figure 6D) HALLMARK_APICAL_JUNCTION (Figure 6E) and other biologically relevant functions and signaling pathways.
To explore the variations in the hallmark gene sets between high and low-risk groups for STAD, we conducted a GSVA of all genes expression data in the dataset TCGA-STAD according to the standard and high-risk groups for STAD samples. The outcomes showed that a total of 28 hallmark gene sets showed variations (P < 0.05) among the high and low-risk groups. Subgroup comparison plots (Figure 7A) and heat maps (Figure 7B) of the outcomes of the differences between the groups of high and low risk for these 28 gene sets were plotted (Table 3).
| ID | Enrichment score | NES | P value | Q values |
| HALLMARK_EPITHELIAL_MESENCHYMAL_TRANSITION | 0.708105259 | 2.990707978 | 0.001305483 | 0.008457298 |
| HALLMARK_HYPOXIA | 0.403129656 | 1.699699999 | 0.00130719 | 0.008457298 |
| HALLMARK_APICAL_JUNCTION | 0.461587301 | 1.935939035 | 0.001310616 | 0.008457298 |
| HALLMARK_MYOGENESIS | 0.66612 | 2.752470842 | 0.001331558 | 0.008457298 |
| HALLMARK_COAGULATION | 0.50179623 | 1.942687567 | 0.00143472 | 0.008457298 |
| HALLMARK_UV_RESPONSE_DN | 0.406876695 | 1.662984536 | 0.002702703 | 0.009857419 |
| hallmark_interferon_alpha_response | -0.423867587 | -1.8197451 | 0.003257329 | 0.009857419 |
| HALLMARK_G2M_CHECKPOINT | -0.566300626 | -2.681102853 | 0.004255319 | 0.009857419 |
| hallmark_interferon_gamma_response | -0.329292011 | -1.559005425 | 0.004255319 | 0.009857419 |
| HALLMARK_E2F_TARGETS | -0.562672699 | -2.6759039 | 0.004329004 | 0.009857419 |
| HALLMARK_MYC_TARGETS_V1 | -0.454693047 | -2.162384814 | 0.004329004 | 0.009857419 |
| HALLMARK_MITOTIC_SPINDLE | -0.367141984 | -1.748758241 | 0.004347826 | 0.009857419 |
| HALLMARK_MTORC1_SIGNALING | -0.385874626 | -1.837984926 | 0.004347826 | 0.009857419 |
| HALLMARK_MYC_TARGETS_V2 | -0.448665513 | -1.728129282 | 0.005617978 | 0.011827321 |
| HALLMARK_INFLAMMATORY_RESPONSE | -0.318801368 | -1.472576393 | 0.00862069 | 0.016938899 |
| HALLMARK_PROTEIN_SECRETION | -0.367157298 | -1.567228573 | 0.009771987 | 0.018001029 |
| HALLMARK_ANGIOGENESIS | 0.547725076 | 1.690092924 | 0.014802632 | 0.025664005 |
| HALLMARK_IL6_JAK_STAT3_SIGNALING | -0.367388389 | -1.508170458 | 0.018181818 | 0.029771398 |
| HALLMARK_KRAS_SIGNALING_DN | 0.371059103 | 1.431772189 | 0.024425287 | 0.037786775 |
| hallmark_estrogen_response_late | -0.291604703 | -1.348128819 | 0.025641026 | 0.037786775 |
| HALLMARK_UNFOLDED_PROTEIN_RESPONSE | -0.323403998 | -1.423443484 | 0.029315961 | 0.041145208 |
| HALLMARK_HEDGEHOG_SIGNALING | 0.472117157 | 1.469309232 | 0.045602606 | 0.0610944 |
The results show that: gene sets HALLMARK_GLYCOLYSIS, HALLMARK_INTERFERON_ALPHA_RESPONSE, HALLMARK_P53_PATHWAY, HALLMARK_TGF_BETA_SIGNALING in the high and low risk groups of dataset TCGA-STAD between P < 0.05. Gene sets HALLMARK_ANGIOGENESIS, HALLMARK_HEDGEHOG_SIGNALING, HALLMARK_BILE_ACID_METABOLISM, HALLMARK_ESTROGEN_ RESPONSE_LATE, HALLMARK_MYC_TARGETS_V2, HALLMARK_KRAS_SIGNALING_DN, HALLMARK_PANCREAS_BETA_CELLS between high and low risk groups in dataset TCGA-STAD P < 0.01. Gene sets HALLMARK_MYOGENESIS, HALLMARK_PROTEIN_SECRETION, HALLMARK_MITOTIC_SPINDLE, HALLMARK_EPITHELIAL_ME
Protein-protein interactions were analyzed for three copper death prognosis-related DEGs (FDX1, LIAS, MTF1) utilizing the STRING database, and the interactions were visualized employing Cytoscape software (Figure 8A). The target and CHIPBase (version 2.0) databases were used to find TF that bind to three copper death prognosis-related DEGs (FDX1, LIAS, MTF1). In the CHIPBase database, we used D1kbToTalSite > 1 as the screening principle to acquire 29 pairs of mRNA-TF, and in the target database, we used NO of dataset > 1 as the screening principle to receive 476 pairs of mRNA-TF. Typically, 23 mRNA-TF pairs were obtained by intersecting the results of the two databases. The Cytoscape program was utilized to display the mRNA-TF interaction network (Figure 8B). We used mRNA-miRNA data from the Starbase and the miRDB databases to anticipate miRNAs interacting with these three copper death prognosis-related DEGs (FDX1, LIAS, MTF1). In the Starbase database, we screened for cancernum > 0 to obtain 92 pairs of mRNA-miRNAs, and in the miRDB database, to obtain 515 pairs of mRNA-miRNAs. The intersection of the two databases resulted in 43 teams of mRNA-miRNAs. The mRNA-miRNA interaction network was mapped by Cytoscape software for visualization (Figure 8C).
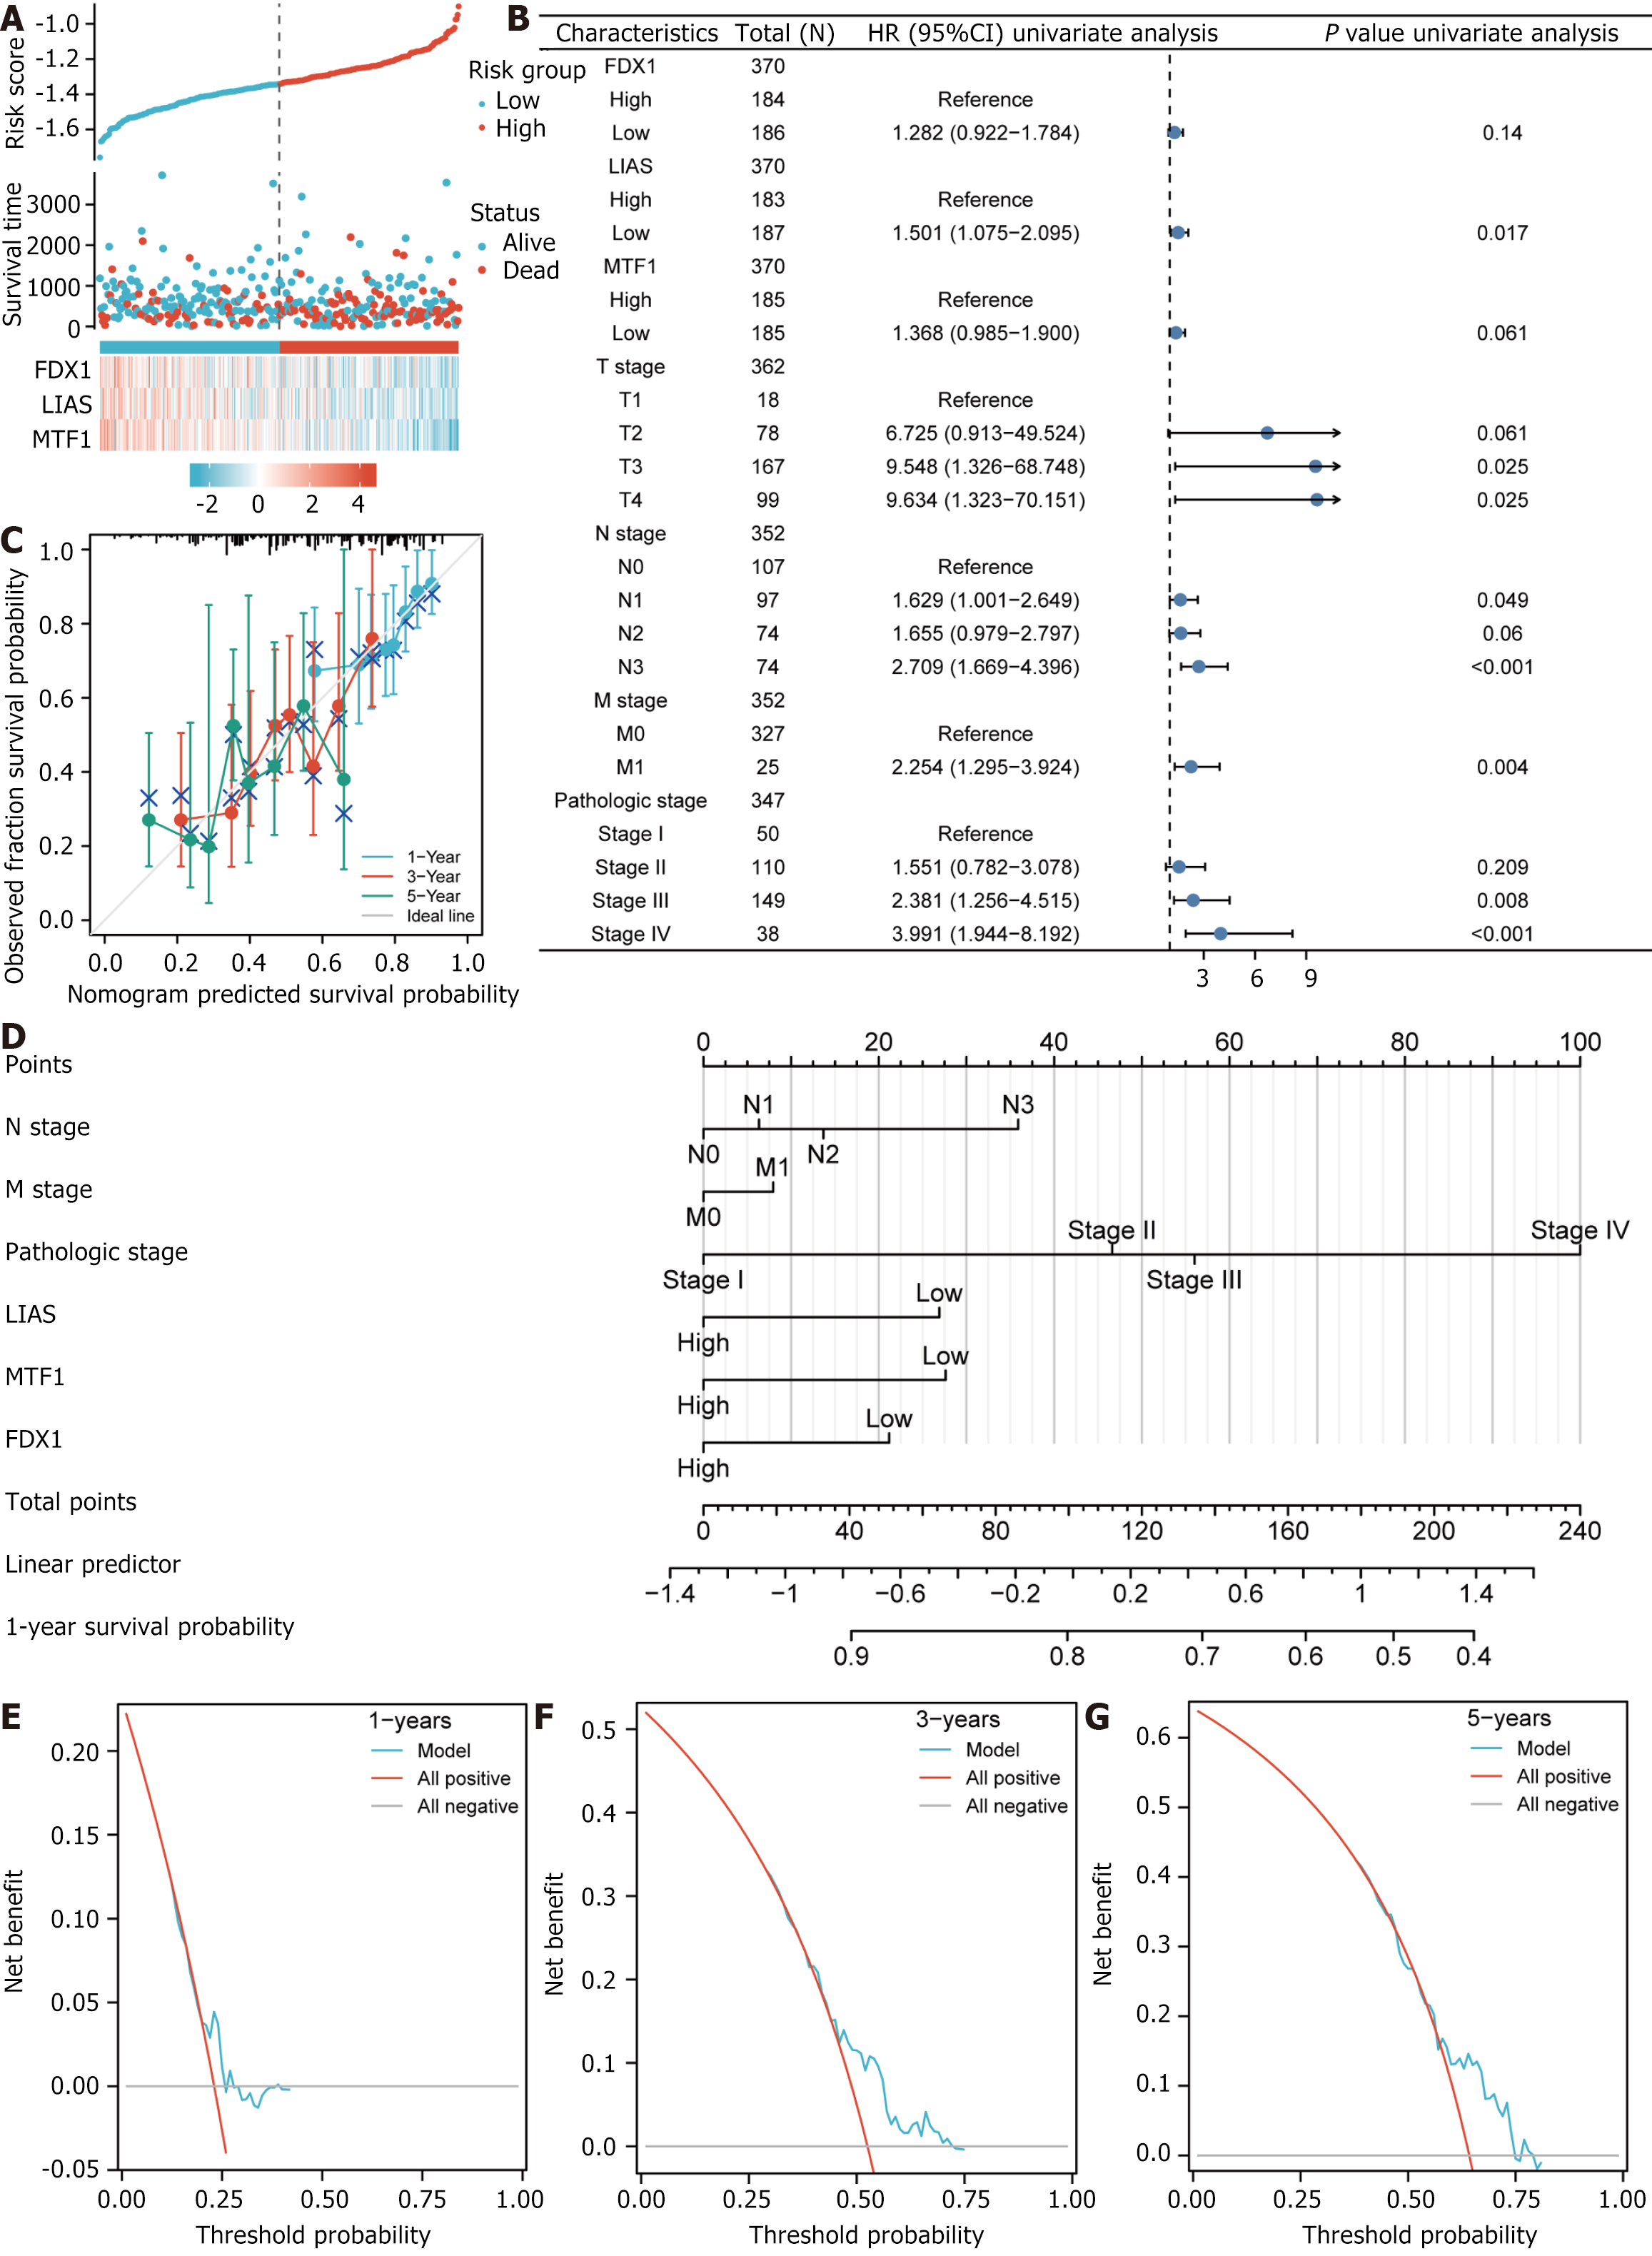
Using risk factor plots, we visualized the risk factor groupings of the created LASSO regression predictive model (Figure 9A). Then, to validate our LASSO regression predictive model, we employed multivariate and univariate Cox regressions in the TCGA-STAD dataset to clinically analyze the association between increased and reduced DEGs expression associated with copper death prognosis and prognosis. We selected the statistically significant (P < 0.05) parts of the results from the univariate Cox regressions in the form of forest plots for presentation (Figure 9B).
In addition, we performed Calibration analyses and plotted calibration curves for the 1-, 3- and 5-year prognosis of the statistically significant (P <0 .05) factors in the univariate and multivariate Cox regression analyses of the one-way outcomes (Figure 9C), and analyzed and plotted nomogram for these univariate outcome nomograms based on prognostic information (Figure 9D). The results show that the best fit was achieved for the 1-year model constructed.
Finally, we used DCA to assess the medical efficacy of the constructed LASSO regression predictive model at one year (Figure 9E), three years (Figure 9F), and five years (Figure 9G). The results showed that the LASSO regression prognostic model with DEGs (FDX1, LIAS, MTF1) associated with copper death prognosis as variables predicted gastric cancer better with increasing disease duration.
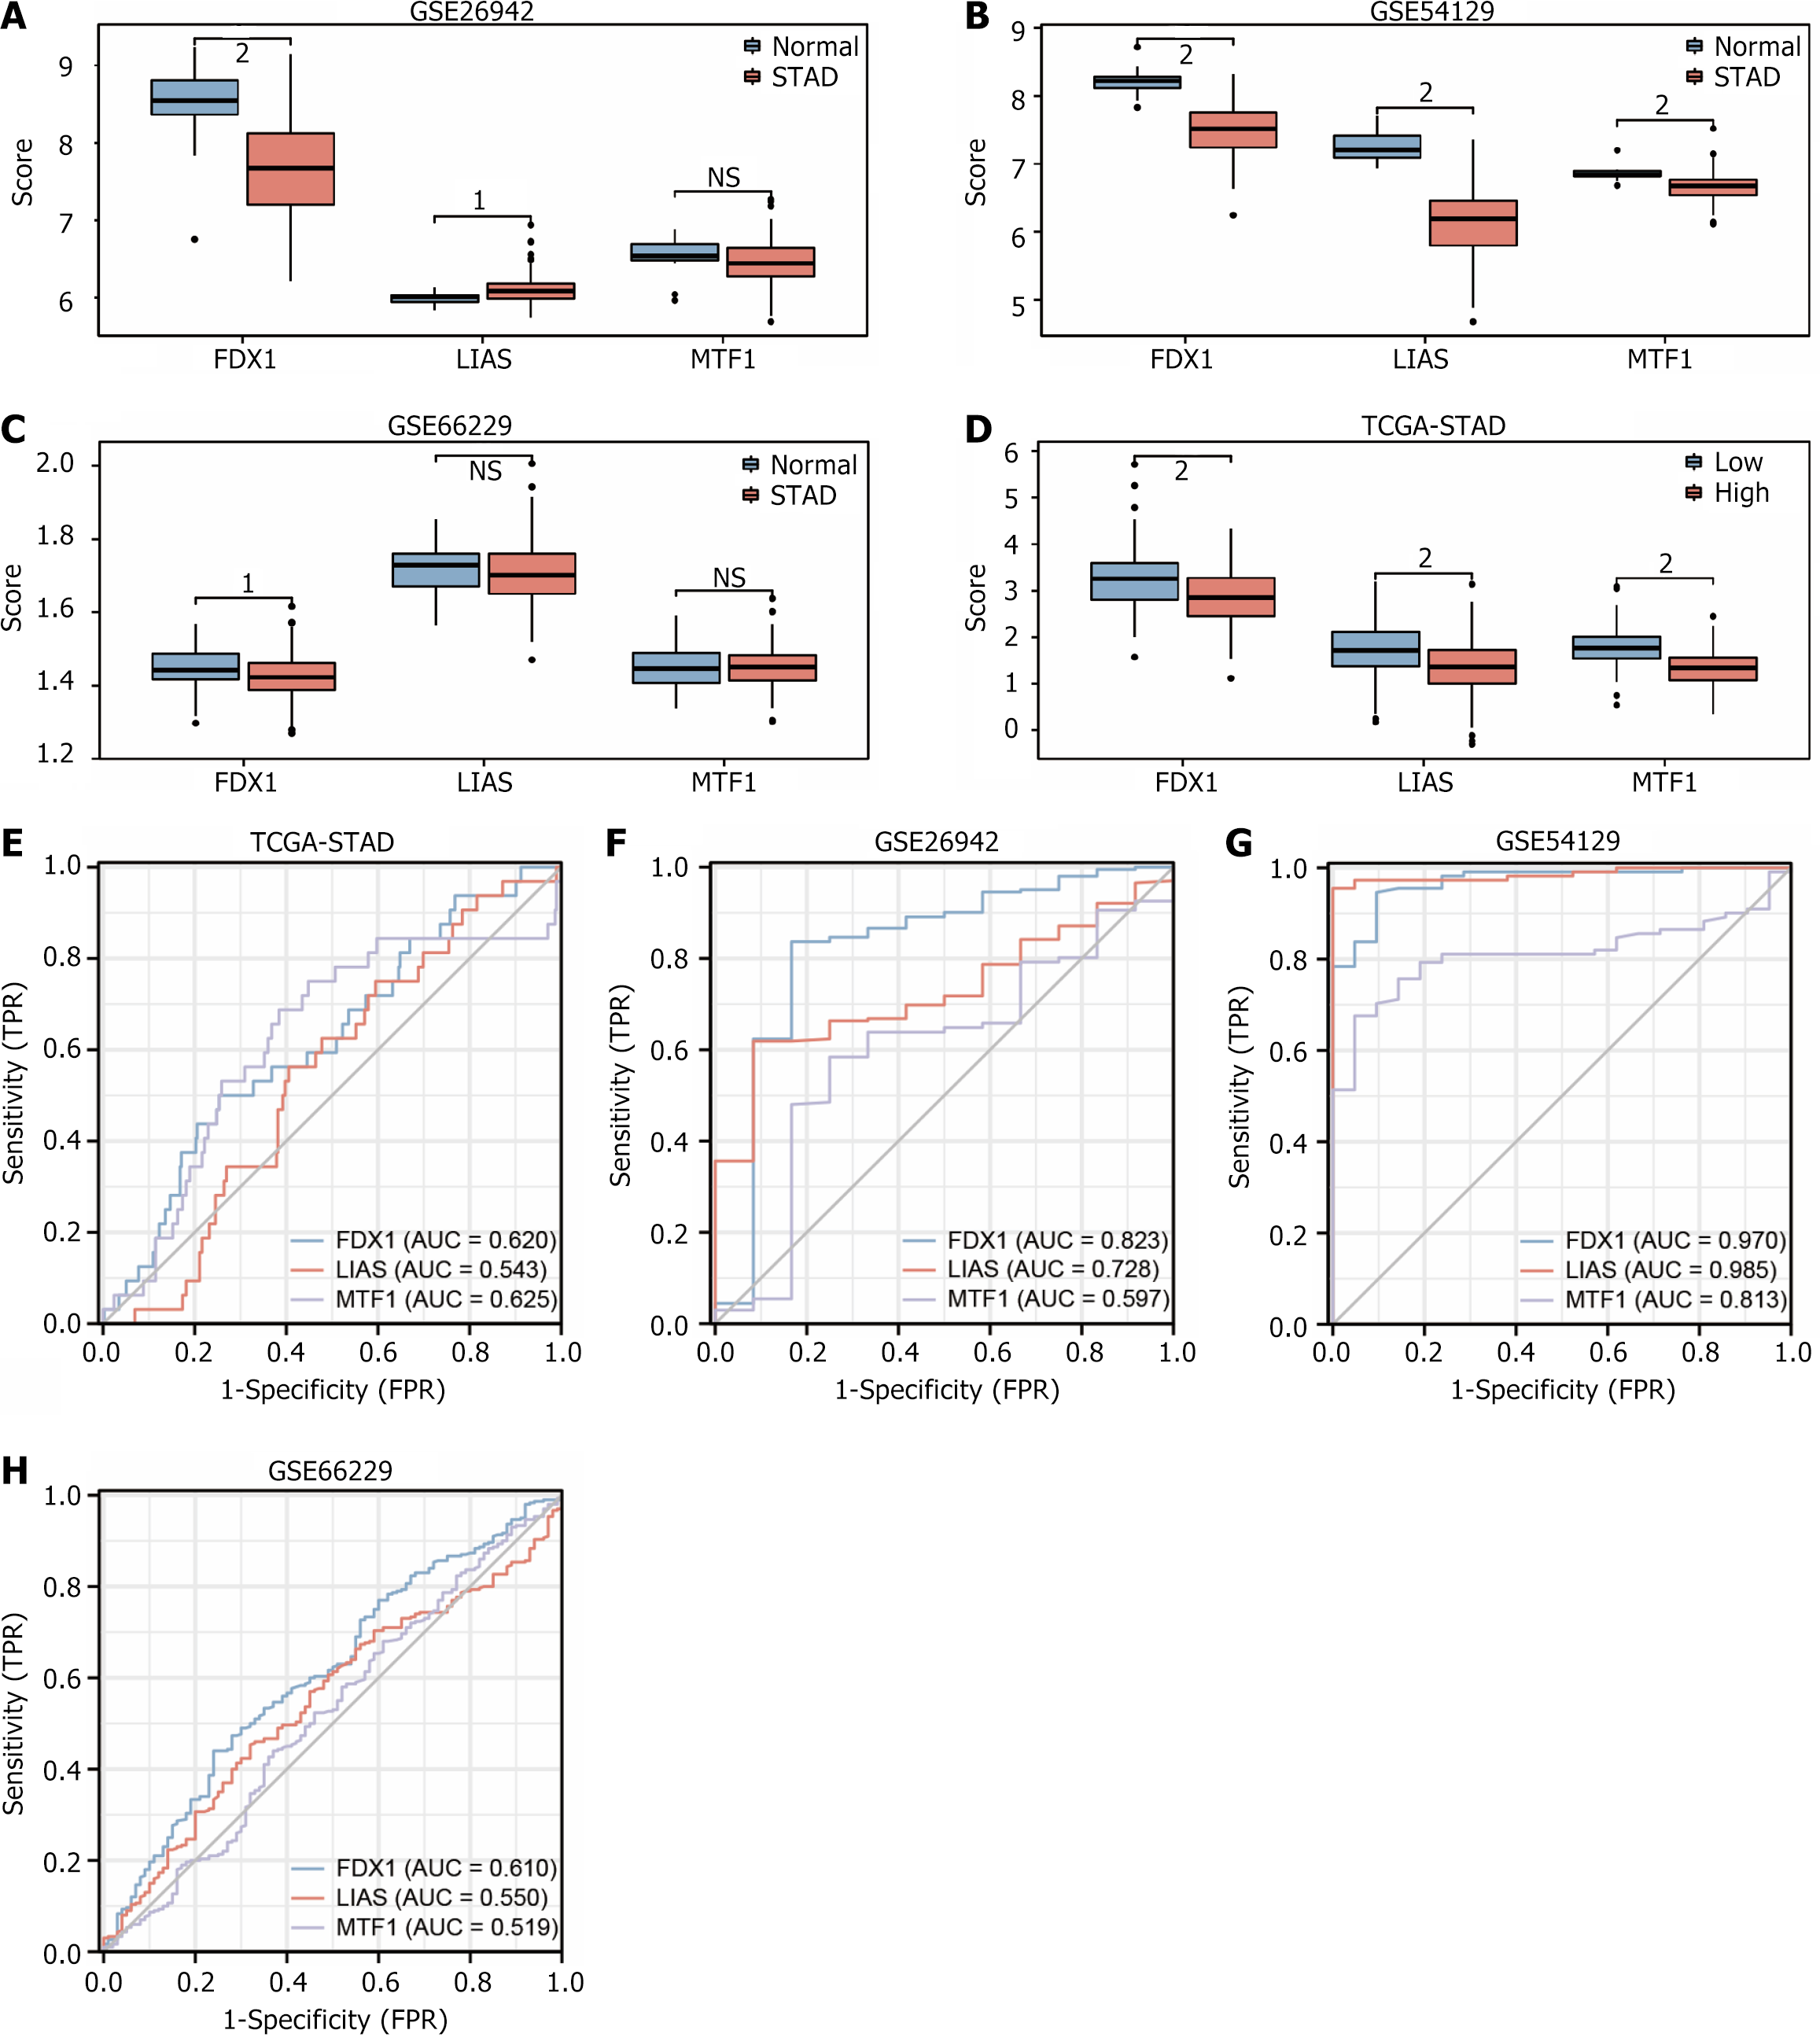
We initially standardized the GEO datasets GSE26942, GSE54129, and GSE66229 using the limma package to plot three copper deaths using STAD samples and control samples as subgroups prognosis-related DEGs (FDX1, LIAS, MTF1) in data GSE26942 (Figure 10A), dataset GSE54129 (Figure 10B) and dataset GSE66229 (Figure 10C) respectively, before plotting group comparison for dataset TCGA-STAD based on grouping of low and high risk (Figure 10D). The differential expression of three copper death prognosis-related DEGs in STAD was verified to be significant. The outcomes exhibited that the gene FDX1 was statistically significant and was lowly expressed in STAD samples, and it could be concluded that the gene FDX1 is an oncogene in STAD.
Finally, we used 407 samples from dataset TCGA-STAD (Figure 10E), dataset GSE26942 (Figure 10F), dataset GSE54129 (Figure 10G), and dataset GSE66229 (Figure 10H) to draw ROC curves based on STAD samples and control samples were grouped to plot ROC curves for the DEGs (FDX1, LIAS, MTF1) connected with copper death prognosis. The results showed that the genes FDX1 (AUC = 0.823) and LIAS (AUC = 0.728) had some accuracy, and MTF1 (AUC = 0.597) had low accuracy in STAD sample and control sample subgroups of dataset GSE26942. Gene FDX1 (AUC = 0.970), and LIAS (AUC = 0.985) had high accuracy, and gene MTF1 (AUC = 0.813) had some accuracy in the STAD sample and control sample subgroup of the dataset GSE54129. Gene FDX1 (AUC = 0.610), LIAS (AUC = 0.550), and MTF1 (AUC = 0.519) had low accuracy STAD sample and control sample of the dataset GSE66229. Gene FDX1 (AUC = 0.620), LIAS (AUC = 0.543), and TF1 (AUC = 0.625) had low accuracy in STAD sample and control sample subgroup of the GSETCGA-STAD dataset. In summary, the gene FDX1 had the highest diagnostic accuracy in STAD (Table 4).
| Characteristics | Total (n) | Univariate analysis | Multivariate analysis | ||
| Hazard ratio (95%CI) | P value | Hazard ratio (95%CI) | P value | ||
| FDX1 | 370 | ||||
| High | 184 | Reference | |||
| Low | 186 | 1.282 (0.922-1.784) | 0.140 | ||
| LIAS | 370 | ||||
| High | 183 | Reference | |||
| Low | 187 | 1.501 (1.075-2.095) | 0.017 | 1.414 (0.981-2.038) | 0.063 |
| MTF1 | 370 | ||||
| High | 185 | Reference | |||
| Low | 185 | 1.368 (0.985-1.900) | 0.061 | 1.346 (0.936-1.936) | 0.109 |
| T stage | 362 | ||||
| T1 | 18 | Reference | |||
| T2 | 78 | 6.725 (0.913-49.524) | 0.061 | 4.323 (0.548-34.111) | 0.165 |
| T3 | 167 | 9.548 (1.326-68.748) | 0.025 | 5.338 (0.613-46.515) | 0.129 |
| T4 | 99 | 9.634 (1.323-70.151) | 0.025 | 5.141 (0.576-45.881) | 0.143 |
| N stage | 352 | ||||
| N0 | 107 | Reference | |||
| N1 | 97 | 1.629 (1.001-2.649) | 0.049 | 1.152 (0.578-2.296) | 0.688 |
| N2 | 74 | 1.655 (0.979-2.797) | 0.060 | 1.298 (0.553-3.050) | 0.549 |
| N3 | 74 | 2.709 (1.669-4.396) | < 0.001 | 1.818 (0.772-4.281) | 0.171 |
| M stage | 352 | ||||
| M0 | 327 | Reference | |||
| M1 | 25 | 2.254 (1.295-3.924) | 0.004 | 1.038 (0.430-2.504) | 0.935 |
| Pathologic stage | 347 | ||||
| Stage I | 50 | Reference | |||
| Stage II | 110 | 1.551 (0.782-3.078) | 0.209 | 1.132 (0.399-3.212) | 0.816 |
| Stage III | 149 | 2.381 (1.256-4.515) | 0.008 | 1.181 (0.304-4.588) | 0.810 |
| Stage IV | 38 | 3.991 (1.944-8.192) | < 0.001 | 2.082 (0.513-8.445) | 0.305 |
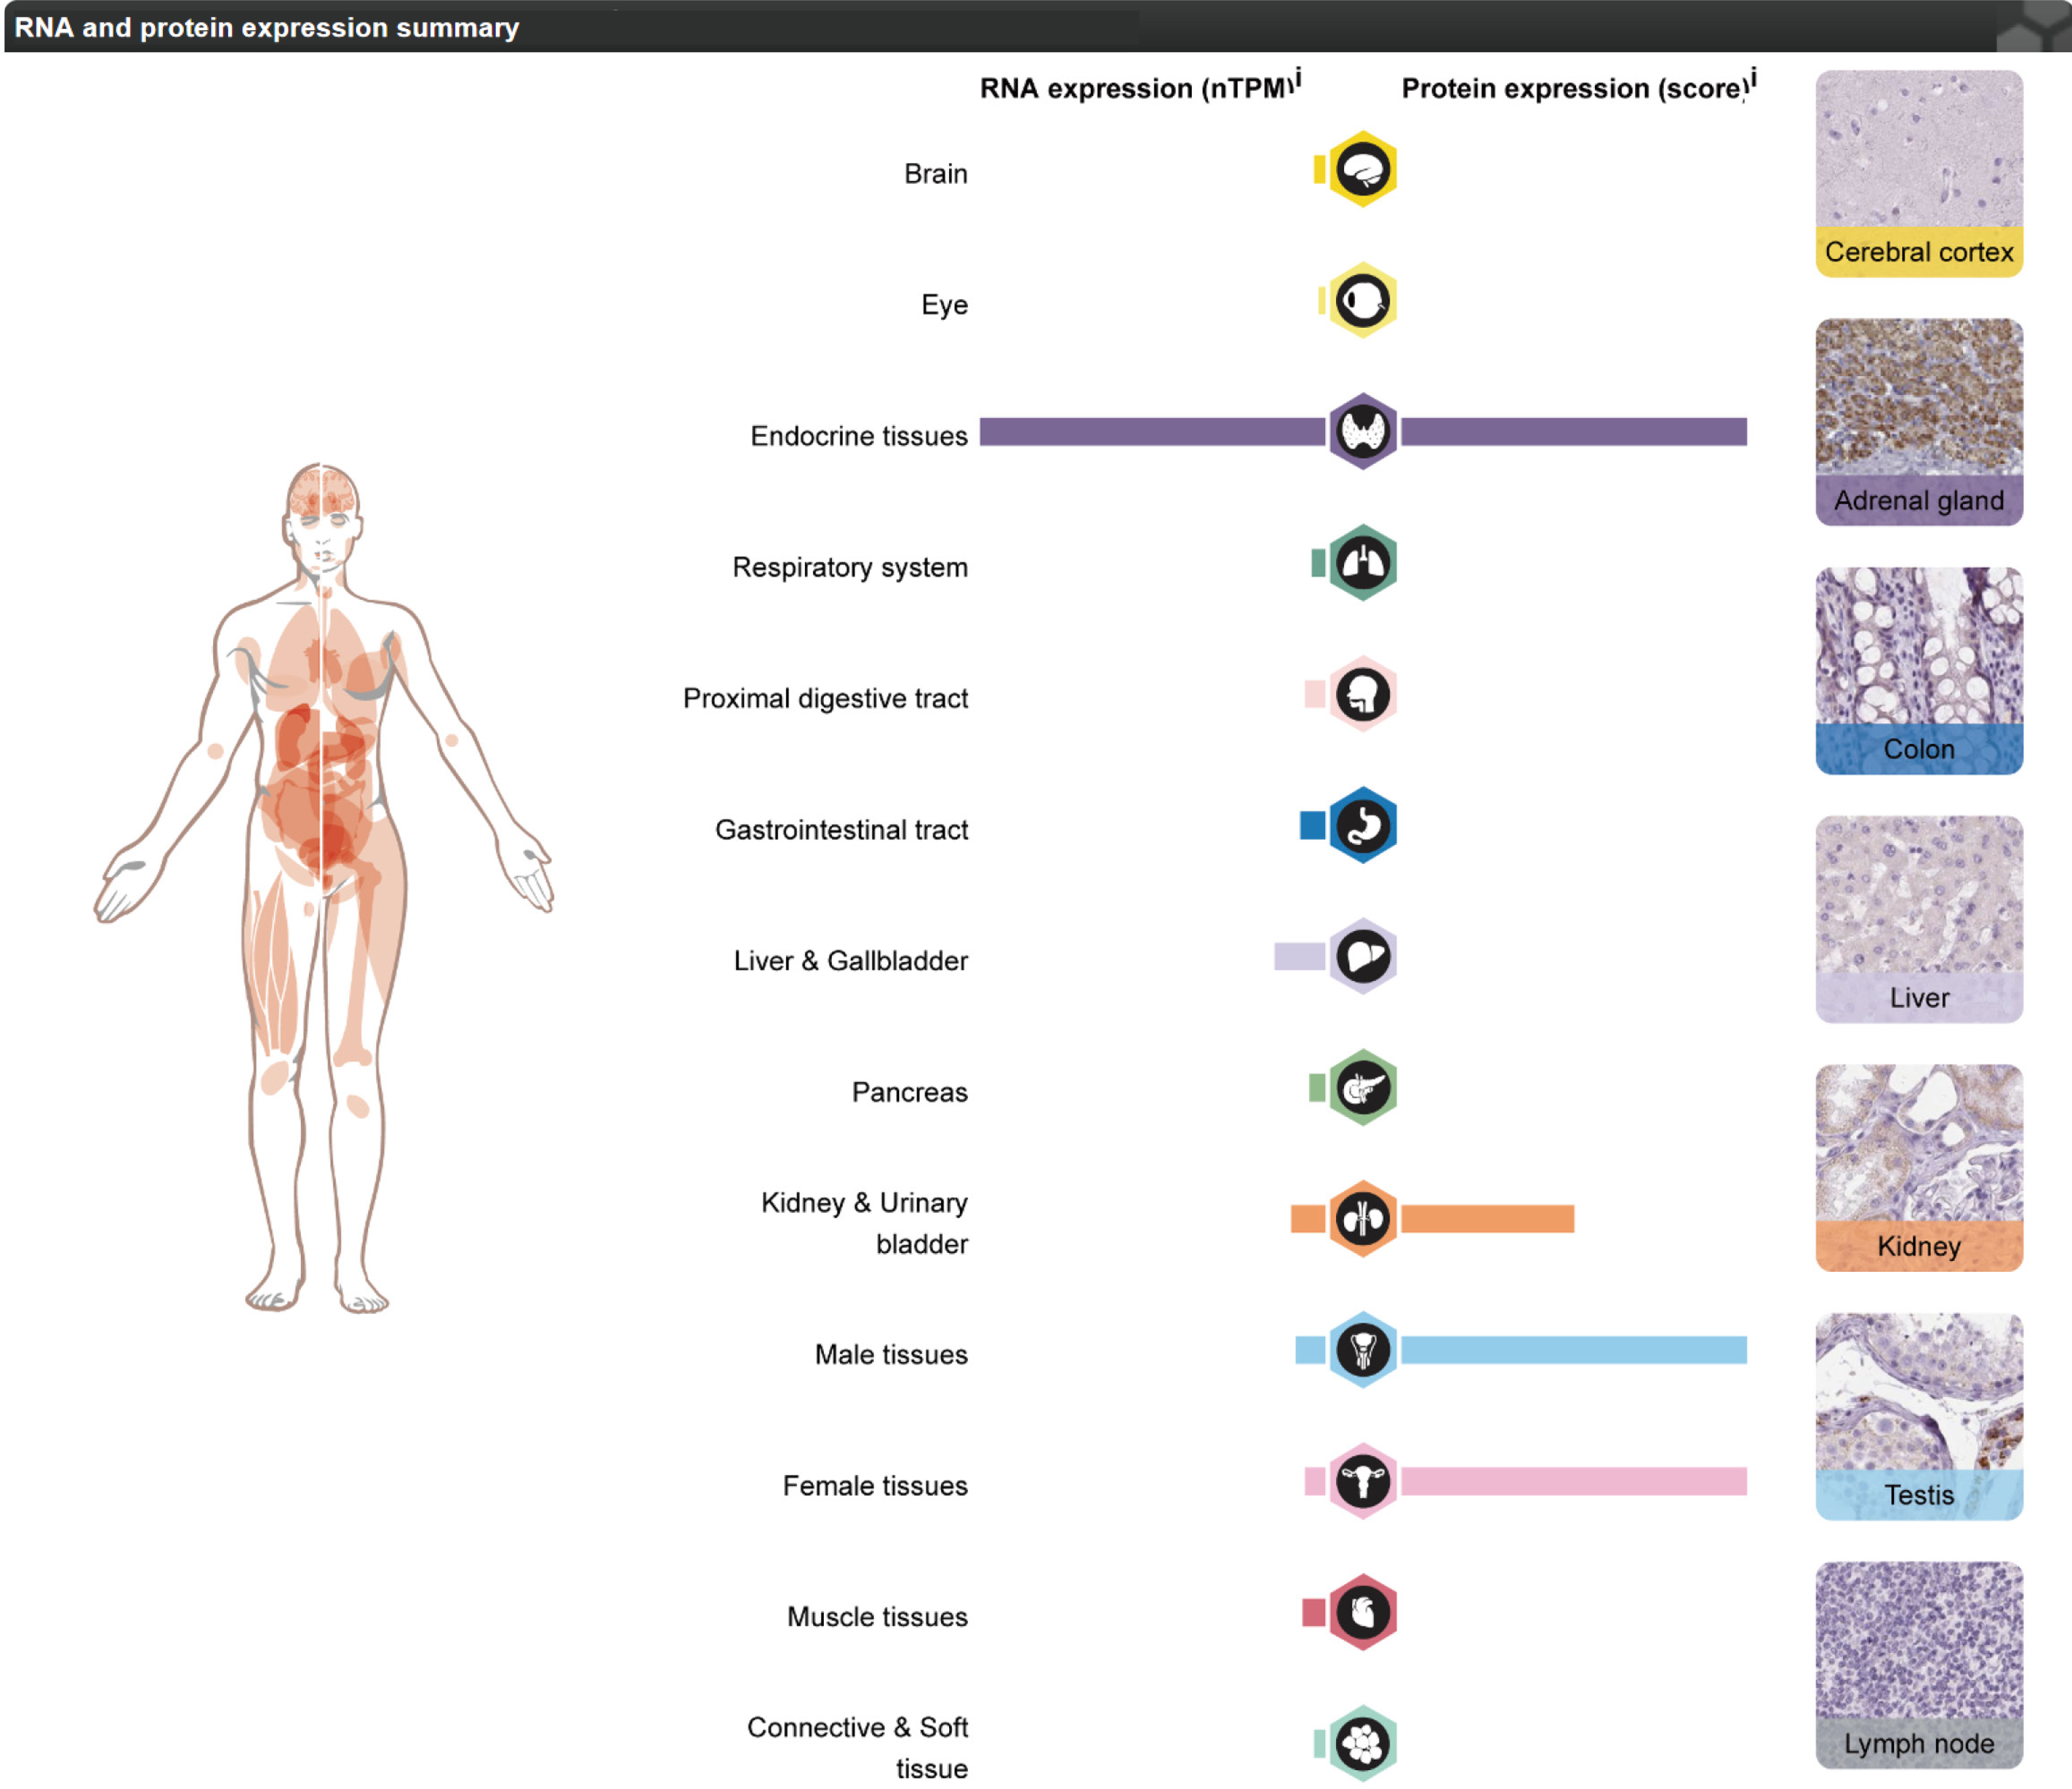
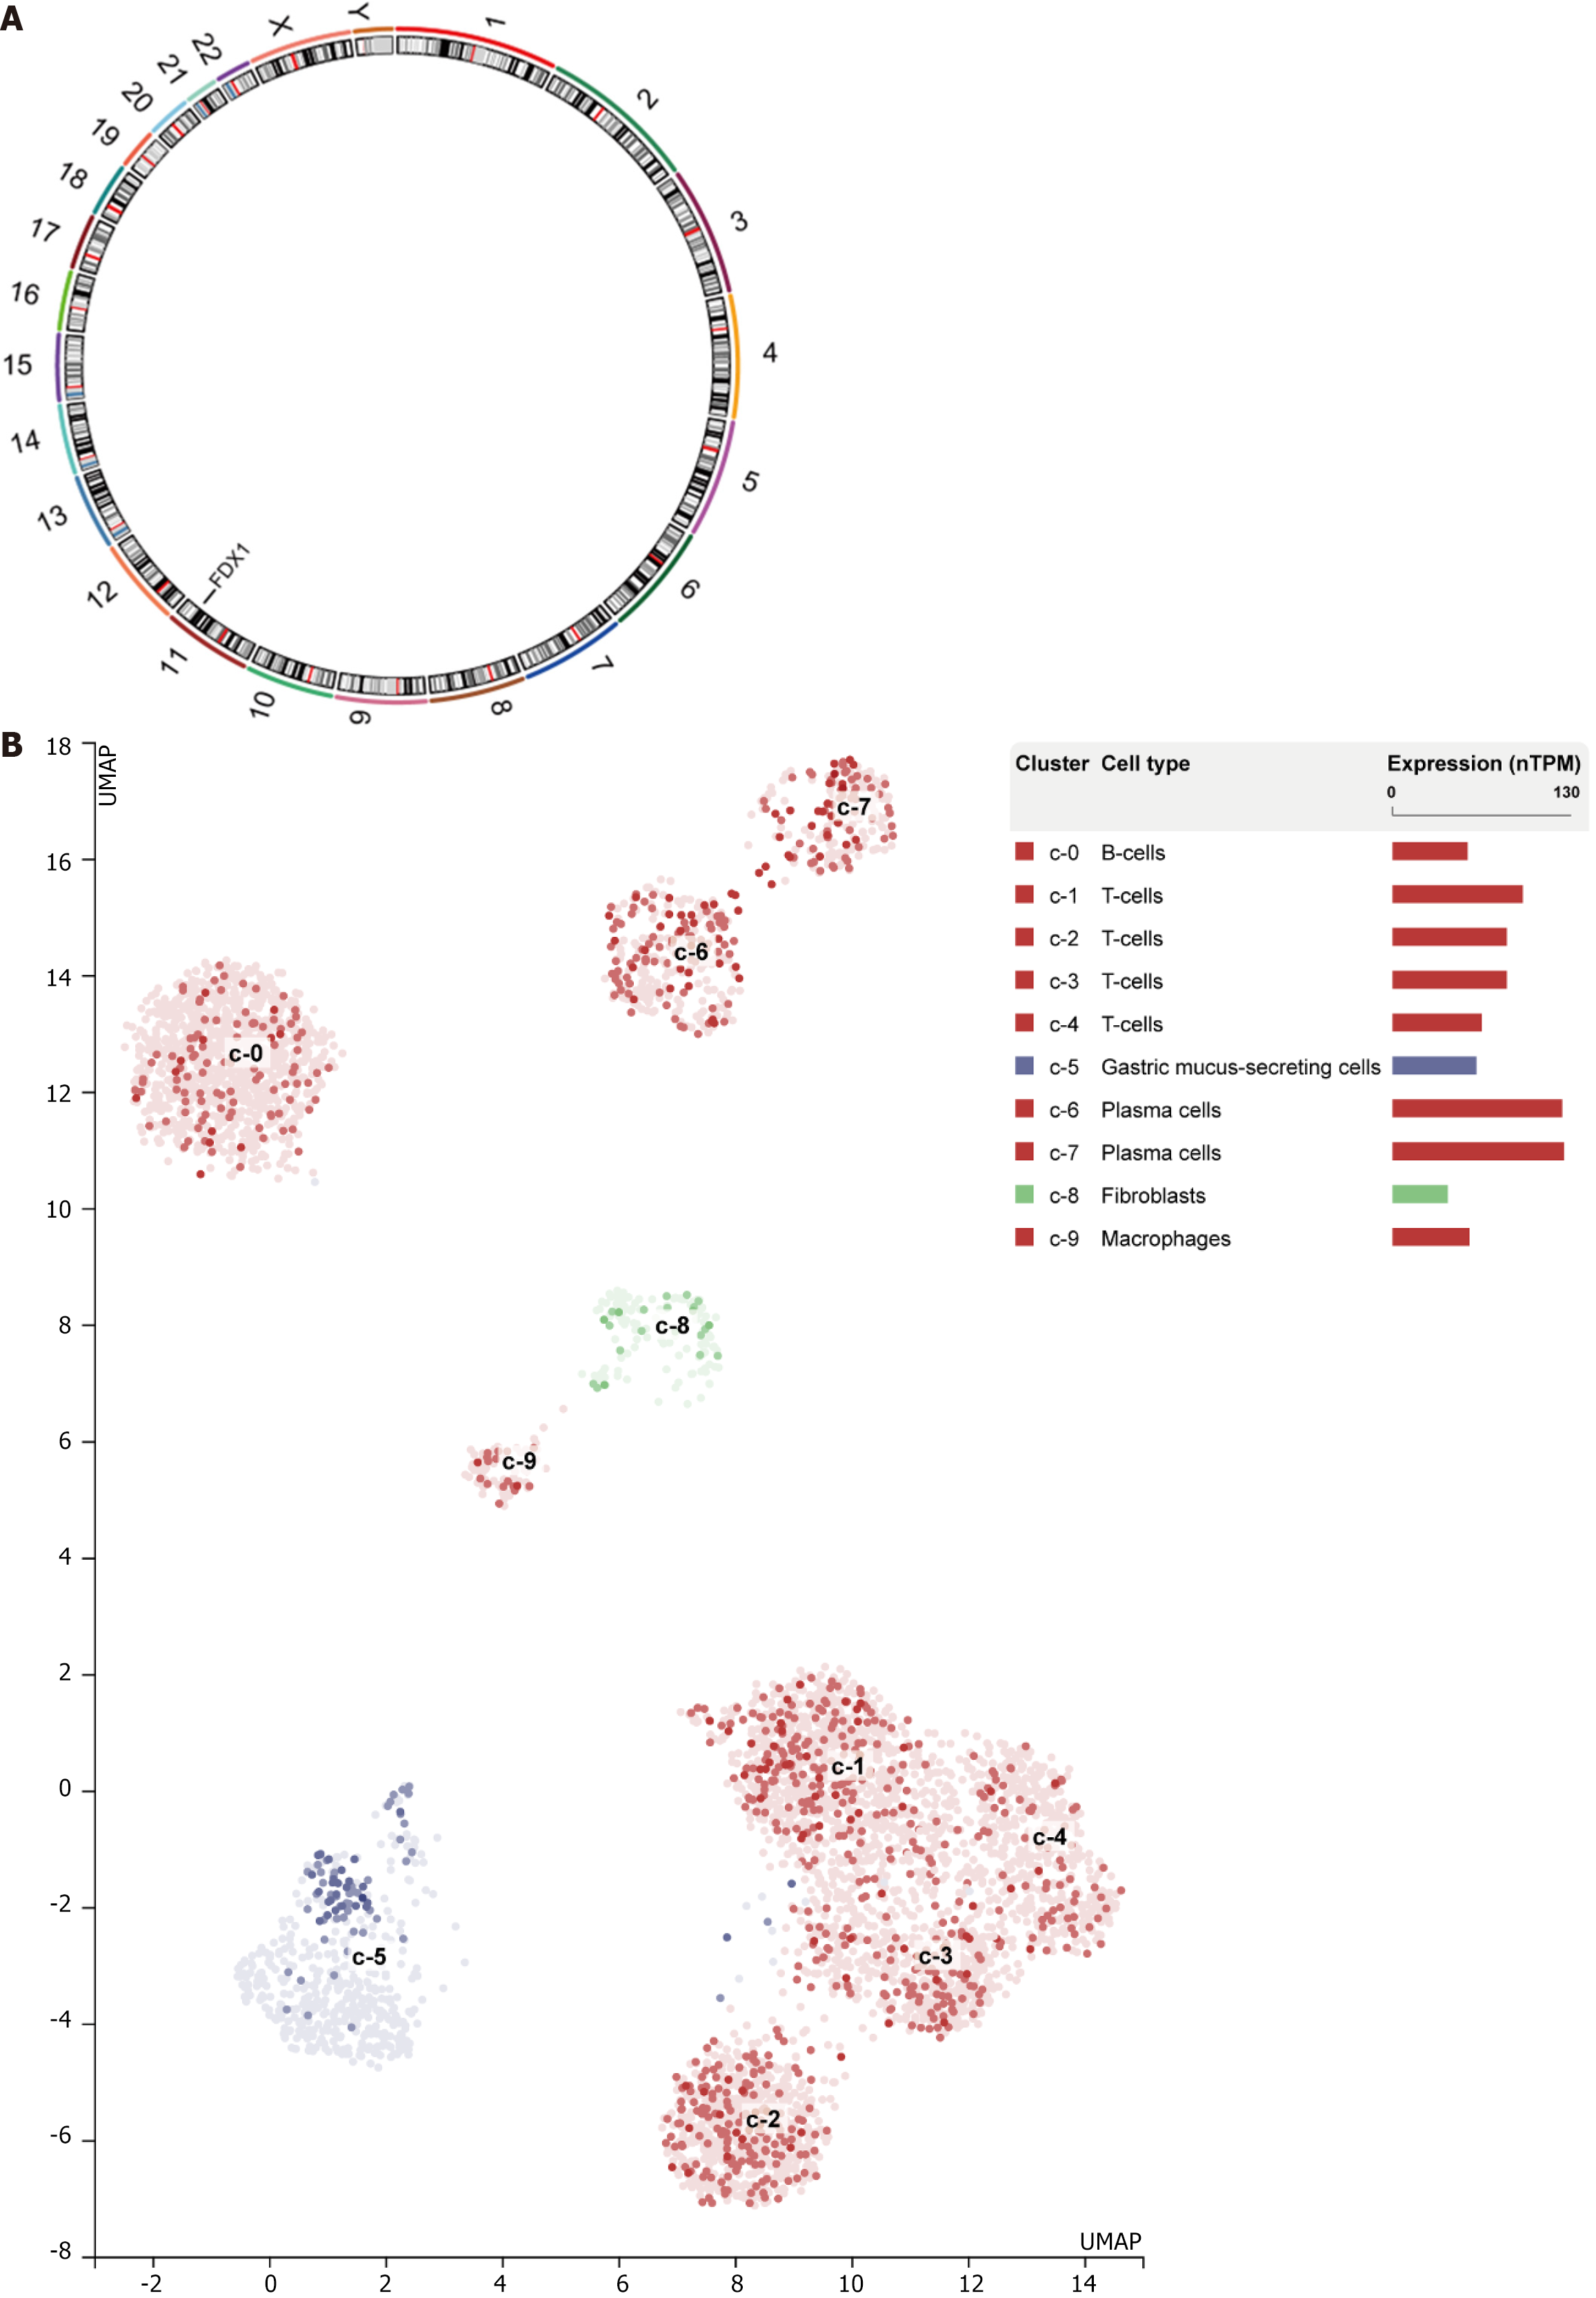
We obtained gene FDX1 expression in different human tissues (Figure 11) and among different STAD single-cell subpopulations (Figure 12A) through the HPA database and visualized the results. The results show that gene FDX1 has high expression of both RNA and protein in endocrine tissues, higher protein expression in kidney and urinary bladder tissues, and high protein expression in male and female tissues. Gene FDX1 was highly expressed in gastric cancer cell lines, mainly in T-cells, Plasma cells. We utilized the RCircos package to localize prognosis related DEGs in chromosomes (Figure 12) The results show that the gene FDX1 is on chromosome 11.
STAD is a widespread malignant tumor with a worse prognosis and an elevated rate of death. Intestinal mucosa cancer cells that grow abnormally and create ulcers are the causes of STAD. Diagnosis is always delayed since this process is often slower and difficult to identify at an early phase[11]. Though the occurrence and death rates of STAD have decreased over the past century, the total cases of gastric cancer numbers continue to increase due to the aging population[12]. Moreover, the healthcare burden of gastric cancer is high, accounting for 20% of the total global cancer burden[14]. Despite advances in targeted therapy over the past decades, surgery is still considered to be the only curative treatment for gastric cancer to date.
Furthermore, metastasis of cancer cells and resistance to chemotherapy are the main barriers limiting malignancy treatment efficacy[15]. Unfortunately, despite substantial efforts in preclinical and clinical studies, the STAD prognosis is still unsatisfactory, with a 5-year survival rate of only 20%-30% for patients with progressive STAD[16]. Therefore, new strategies and directions for the treatment of STAD are urgently needed.
A new investigation explored that an imbalance in intracellular copper ion accumulation triggers mitochondrial lipoproteins aggregation, causing a distinct type of cell death known as copper death[9]. Copper death largely depends on mitochondrial respiration, unlike apoptosis, scorch death, necrosis, and iron death[17]. Upon excessive accumulation of Cu2+ in cells dependent on mitochondrial respiration (Cu2+ is transferred into cells via copper ion carriers), Cu2+ binds to thioredoxylated DLAT, inducing heterodimerization of DLAT. The insoluble DLAT rise causes cytotoxicity and induces cell death[18]. More interestingly, in some cancers, we found higher levels of copper ions in tumor tissue and the serum of tumor patients than in normal subjects[19]. Breast cancer and cuproptosis-related genes are also very closely related[20]. However, the relationship between gastric adenocarcinoma and copper death-related genes and prognosis has not been elucidated.
In our investigation, we explored the CRGs’ differential expression in STAD and healthy samples and identified three important prognostic genes, FDX1, LIAS and MTF1, by univariate cox regression analysis. These genes have previously been informed to have a crucial function in cancer progression.
FDX1 is a mitochondrial iron-oxygen-reducing protein with essential roles in steroid synthesis, heme, and Fe/S cluster biosynthesis. FDX1 is important in steroid synthesis, hemoglobin, and Fe/S cluster biosynthesis[21]. It also reduces steroid synthesis by mitochondrial cytochrome P450[22]. FDX1 is also an important biomarker in clear renal cell carcinoma[23]. The protein encoded by LIAS is related to the biotin and lipoic acid synthase family. FDX1 regulates cellular proteolipid acylation by binding directly to LIAS[24].
Furthermore, LIAS is essential in identifying cupulocyte-associated subtypes of gastric cancer and constructing predictive models[25]. MTF1 induces the expression of metallothionein and other genes related to metal homeostasis in reaction to heavy metals like copper, zinc, cadmium, and silver. It could bind to the metal response element in the promoter and activate the transcription of metallothionein genes such as metallothionein-2/MT2A[26]. In lung adenocarcinoma, MTF1 is vital in identifying two molecular subtypes and developing predictive models[27]. Another study revealed that zinc promotes epithelial cell transformation to mesenchymal stromal cells (EMT) through an MTF1-dependent pathway, contributing to ovarian tumor metastasis[28]. In summary, FDX1, LIAS, and MTF1 play essential roles in cancer and are likely potential targets for STAD.
Functional enrichment analysis using GO and KEGG exhibited that these genes are enriched in mitochondrial ATP synthesis coupled electron transport, electron transport chain, ATP synthesis coupled electron transport and are closely related to STAD development. The enzymes on the electron transport chain catalyze the oxidation of biological substrates and the synthesis of ATP and are involved in bioenergetic conversion[29]. It has been shown that H. pylori infection of gastric adenocarcinoma cells leads to mitochondrial DNA mutations and reduced mitochondrial DNA content, affecting the ATP synthesis coupled electron transport pathway and reducing the level and activity of the electron transport chain complex I[30].
This research established a new predictive model dependent on three prognostic CRGs (i.e., FDX1, LIAS, and MTF1) by LASSO-Cox regression, univariate, and multivariate Cox regression analyses. The outcomes exhibited that patients who died were primarily concentrated in the high-risk group and that the expression levels of DEGs associated with copper death prognosis were lower in the high-risk group than in the low-risk group. To validate our LASSO regression predictive model, we also employed univariate and multivariate Cox regression in the TCGA-STAD dataset to analyze the relationship between elevated and decreased expression of DEGs associated with copper death prognosis and clinical prognosis, showing that the 1-year model was the best fit and that FDX1, LIAS, and MTF1 as variables predicted gastric cancer with increasing duration of disease The better the model indicated.
Most importantly, we finally validated FDX1, LIAS, and MTF1 in data sets GSE26942 and GSE54129. Data set GSE66229, respectively, and the results showed that P < 0.001 for gene FDX1 in data set GSE26942, P < 0.01 for gene LIAS, and P& gt;0.05. in dataset GSE54129 P for gene FDX1, P for gene LIAS and P for gene MTF1 were all less than 0.001. in dataset GSE66229 P < 0.01 for gene FDX1, P > 0.05 for gene LIAS and P > 0.05 for gene MTF1. And, in dataset TCGA- P for gene FDX1, gene LIAS, and gene MTF1 were all less than 0.001 in the data set STAD. In summary, gene FDX1 could be considered an oncogene of gastric cancer.
FDX1, a protein-coding gene, has been associated with iron death and copper death[31]. FDX1 encodes a small iron-sulfur protein that transfers electrons from NADPH to mitochondrial cytochrome P450 via adrenocortical ferric oxidoreductase and is involved in steroid, vitamin D, and bile acid metabolism[21]. Our study above suggests that FDX1 is a key gene associated with copper death. Bioinformatics and clinical tissue validation revealed that FDX1 was highly expressed in STAD tumor tissues, and it was hypothesized that FDX1 might function in STAD treatment. Furthermore, previous studies by Yang et al[32] found that FDX1 was poorly expressed in most malignancies but highly expressed in gastric adenocarcinoma, glioblastoma, and endometrial cancer of the uterine corpus. And it was demonstrated by in vitro experiments that FDX1 down-regulation inhibited cell viability in bladder malignancy, clear cell renal cell carcinoma, and prostate tumor cells. They inferred that FDX1 could be a potential therapeutic target for STAD. Their findings are consistent with our conclusions, which validate our data mining results.
We obtained the gene FDX1 expression in different human tissues and, among other gastric cancer, single-cell subpopulations utilizing the HPA database and visualized the outcomes. The results show that gene FDX1 is greatly expressed in T-cells, Plasma cells in gastric cancer cell lines. In conclusion, these studies were analyzed in conjunction with relevant clinical data, further strengthening the convincing case and confirming our speculation above about the role of CRGs in STAD.
Of course, the absence of experimental conditions to further validate this with experiments is a limitation of this study. This is a pity for researchers. And there needs to be more appropriate clinical correlation studies that can be analyzed in conjunction with clinical information. And the large number of data sets for this analysis may cause unavoidable inter-batch differences. Next, we will elucidate the role of related genes in STAD onset, migration, and invasion by further exploration.
This investigation systematically revealed the function of copper death-related genes in STAD, providing a reliable, comprehensive analysis. Moreover, we established a CRGs score predictive model including these three prognostic markers (FDX1, LIAS, and MTF1), which indicated good validity in predicting survival outcomes in the STAD cohort. Most importantly, we identified FDX1 as an independent factor influencing STAD prognosis. These outcomes provide novel visions into the molecular mechanisms of STAD and contribute to the STAD diagnosis development and new therapeutic strategies.
I would like to express my gratitude to all those helped me during the writing of this thesis. I acknowledge the help of my colleagues. They have offered me suggestion in academic studies.
Provenance and peer review: Unsolicited article; Externally peer reviewed.
Peer-review model: Single blind
Specialty type: Gastroenterology and hepatology
Country of origin: China
Peer-review report’s classification
Scientific Quality: Grade C
Novelty: Grade B
Creativity or Innovation: Grade B
Scientific Significance: Grade B
P-Reviewer: Takegawa N, Japan S-Editor: Lin C L-Editor: A P-Editor: Zhang XD
| 1. | Trama A, Botta L, Foschi R, Ferrari A, Stiller C, Desandes E, Maule MM, Merletti F, Gatta G; EUROCARE-5 Working Group. Survival of European adolescents and young adults diagnosed with cancer in 2000-07: population-based data from EUROCARE-5. Lancet Oncol. 2016;17:896-906. [RCA] [PubMed] [DOI] [Full Text] [Cited by in Crossref: 156] [Cited by in RCA: 209] [Article Influence: 23.2] [Reference Citation Analysis (0)] |
| 2. | Zheng P, Chen L, Yuan X, Luo Q, Liu Y, Xie G, Ma Y, Shen L. Exosomal transfer of tumor-associated macrophage-derived miR-21 confers cisplatin resistance in gastric cancer cells. J Exp Clin Cancer Res. 2017;36:53. [RCA] [PubMed] [DOI] [Full Text] [Full Text (PDF)] [Cited by in Crossref: 326] [Cited by in RCA: 489] [Article Influence: 61.1] [Reference Citation Analysis (0)] |
| 3. | Banks M, Graham D, Jansen M, Gotoda T, Coda S, di Pietro M, Uedo N, Bhandari P, Pritchard DM, Kuipers EJ, Rodriguez-Justo M, Novelli MR, Ragunath K, Shepherd N, Dinis-Ribeiro M. British Society of Gastroenterology guidelines on the diagnosis and management of patients at risk of gastric adenocarcinoma. Gut. 2019;68:1545-1575. [RCA] [PubMed] [DOI] [Full Text] [Full Text (PDF)] [Cited by in Crossref: 425] [Cited by in RCA: 409] [Article Influence: 68.2] [Reference Citation Analysis (1)] |
| 4. | Tsugane S, Sasazuki S. Diet and the risk of gastric cancer: review of epidemiological evidence. Gastric Cancer. 2007;10:75-83. [RCA] [PubMed] [DOI] [Full Text] [Cited by in Crossref: 290] [Cited by in RCA: 326] [Article Influence: 18.1] [Reference Citation Analysis (0)] |
| 5. | Kim BE, Nevitt T, Thiele DJ. Mechanisms for copper acquisition, distribution and regulation. Nat Chem Biol. 2008;4:176-185. [RCA] [PubMed] [DOI] [Full Text] [Cited by in Crossref: 847] [Cited by in RCA: 1038] [Article Influence: 61.1] [Reference Citation Analysis (0)] |
| 6. | Wang F, Zhang S, Jeon R, Vuckovic I, Jiang X, Lerman A, Folmes CD, Dzeja PD, Herrmann J. Interferon Gamma Induces Reversible Metabolic Reprogramming of M1 Macrophages to Sustain Cell Viability and Pro-Inflammatory Activity. EBioMedicine. 2018;30:303-316. [RCA] [PubMed] [DOI] [Full Text] [Full Text (PDF)] [Cited by in Crossref: 158] [Cited by in RCA: 218] [Article Influence: 31.1] [Reference Citation Analysis (0)] |
| 7. | Wang Y, Zhang L, Zhou F. Cuproptosis: a new form of programmed cell death. Cell Mol Immunol. 2022;19:867-868. [RCA] [PubMed] [DOI] [Full Text] [Cited by in Crossref: 240] [Cited by in RCA: 229] [Article Influence: 76.3] [Reference Citation Analysis (0)] |
| 8. | Tsvetkov P, Coy S, Petrova B, Dreishpoon M, Verma A, Abdusamad M, Rossen J, Joesch-Cohen L, Humeidi R, Spangler RD, Eaton JK, Frenkel E, Kocak M, Corsello SM, Lutsenko S, Kanarek N, Santagata S, Golub TR. Copper induces cell death by targeting lipoylated TCA cycle proteins. Science. 2022;375:1254-1261. [RCA] [PubMed] [DOI] [Full Text] [Cited by in Crossref: 282] [Cited by in RCA: 2482] [Article Influence: 827.3] [Reference Citation Analysis (1)] |
| 9. | Ge EJ, Bush AI, Casini A, Cobine PA, Cross JR, DeNicola GM, Dou QP, Franz KJ, Gohil VM, Gupta S, Kaler SG, Lutsenko S, Mittal V, Petris MJ, Polishchuk R, Ralle M, Schilsky ML, Tonks NK, Vahdat LT, Van Aelst L, Xi D, Yuan P, Brady DC, Chang CJ. Connecting copper and cancer: from transition metal signalling to metalloplasia. Nat Rev Cancer. 2022;22:102-113. [RCA] [PubMed] [DOI] [Full Text] [Cited by in Crossref: 228] [Cited by in RCA: 761] [Article Influence: 253.7] [Reference Citation Analysis (0)] |
| 10. | Mi H, Muruganujan A, Ebert D, Huang X, Thomas PD. PANTHER version 14: more genomes, a new PANTHER GO-slim and improvements in enrichment analysis tools. Nucleic Acids Res. 2019;47:D419-D426. [RCA] [PubMed] [DOI] [Full Text] [Full Text (PDF)] [Cited by in Crossref: 1665] [Cited by in RCA: 2047] [Article Influence: 409.4] [Reference Citation Analysis (0)] |
| 11. | Zhang L, Kang W, Lu X, Ma S, Dong L, Zou B. Weighted gene co-expression network analysis and connectivity map identifies lovastatin as a treatment option of gastric cancer by inhibiting HDAC2. Gene. 2019;681:15-25. [RCA] [PubMed] [DOI] [Full Text] [Cited by in Crossref: 59] [Cited by in RCA: 54] [Article Influence: 9.0] [Reference Citation Analysis (0)] |
| 12. | Smyth EC, Nilsson M, Grabsch HI, van Grieken NC, Lordick F. Gastric cancer. Lancet. 2020;396:635-648. [RCA] [PubMed] [DOI] [Full Text] [Cited by in Crossref: 1150] [Cited by in RCA: 2852] [Article Influence: 570.4] [Reference Citation Analysis (5)] |
| 13. | Ritchie ME, Phipson B, Wu D, Hu Y, Law CW, Shi W, Smyth GK. limma powers differential expression analyses for RNA-sequencing and microarray studies. Nucleic Acids Res. 2015;43:e47. [RCA] [PubMed] [DOI] [Full Text] [Full Text (PDF)] [Cited by in Crossref: 16184] [Cited by in RCA: 25678] [Article Influence: 2567.8] [Reference Citation Analysis (0)] |
| 14. | Soerjomataram I, Lortet-Tieulent J, Parkin DM, Ferlay J, Mathers C, Forman D, Bray F. Global burden of cancer in 2008: a systematic analysis of disability-adjusted life-years in 12 world regions. Lancet. 2012;380:1840-1850. [RCA] [PubMed] [DOI] [Full Text] [Cited by in Crossref: 407] [Cited by in RCA: 427] [Article Influence: 32.8] [Reference Citation Analysis (0)] |
| 15. | Norouzi S, Gorgi Valokala M, Mosaffa F, Zirak MR, Zamani P, Behravan J. Crosstalk in cancer resistance and metastasis. Crit Rev Oncol Hematol. 2018;132:145-153. [RCA] [PubMed] [DOI] [Full Text] [Cited by in Crossref: 30] [Cited by in RCA: 52] [Article Influence: 7.4] [Reference Citation Analysis (0)] |
| 16. | Howlader N, Ries LA, Stinchcomb DG, Edwards BK. The impact of underreported Veterans Affairs data on national cancer statistics: analysis using population-based SEER registries. J Natl Cancer Inst. 2009;101:533-536. [RCA] [PubMed] [DOI] [Full Text] [Cited by in Crossref: 50] [Cited by in RCA: 62] [Article Influence: 3.9] [Reference Citation Analysis (0)] |
| 17. | Ren F, Logeman BL, Zhang X, Liu Y, Thiele DJ, Yuan P. X-ray structures of the high-affinity copper transporter Ctr1. Nat Commun. 2019;10:1386. [RCA] [PubMed] [DOI] [Full Text] [Full Text (PDF)] [Cited by in Crossref: 61] [Cited by in RCA: 91] [Article Influence: 15.2] [Reference Citation Analysis (0)] |
| 18. | Li SR, Bu LL, Cai L. Cuproptosis: lipoylated TCA cycle proteins-mediated novel cell death pathway. Signal Transduct Target Ther. 2022;7:158. [RCA] [PubMed] [DOI] [Full Text] [Full Text (PDF)] [Cited by in Crossref: 41] [Cited by in RCA: 195] [Article Influence: 65.0] [Reference Citation Analysis (0)] |
| 19. | da Silva DA, De Luca A, Squitti R, Rongioletti M, Rossi L, Machado CML, Cerchiaro G. Copper in tumors and the use of copper-based compounds in cancer treatment. J Inorg Biochem. 2022;226:111634. [RCA] [PubMed] [DOI] [Full Text] [Cited by in Crossref: 17] [Cited by in RCA: 135] [Article Influence: 33.8] [Reference Citation Analysis (0)] |
| 20. | Deng J, Fu F, Zhang F, Xia Y, Zhou Y. Construct ceRNA Network and Risk Model of Breast Cancer Using Machine Learning Methods under the Mechanism of Cuproptosis. Diagnostics (Basel). 2023;13. [RCA] [PubMed] [DOI] [Full Text] [Reference Citation Analysis (0)] |
| 21. | Sheftel AD, Stehling O, Pierik AJ, Elsässer HP, Mühlenhoff U, Webert H, Hobler A, Hannemann F, Bernhardt R, Lill R. Humans possess two mitochondrial ferredoxins, Fdx1 and Fdx2, with distinct roles in steroidogenesis, heme, and Fe/S cluster biosynthesis. Proc Natl Acad Sci U S A. 2010;107:11775-11780. [RCA] [PubMed] [DOI] [Full Text] [Cited by in Crossref: 190] [Cited by in RCA: 295] [Article Influence: 19.7] [Reference Citation Analysis (0)] |
| 22. | Strushkevich N, MacKenzie F, Cherkesova T, Grabovec I, Usanov S, Park HW. Structural basis for pregnenolone biosynthesis by the mitochondrial monooxygenase system. Proc Natl Acad Sci U S A. 2011;108:10139-10143. [RCA] [PubMed] [DOI] [Full Text] [Cited by in Crossref: 213] [Cited by in RCA: 253] [Article Influence: 18.1] [Reference Citation Analysis (0)] |
| 23. | Jiang A, Ye J, Zhou Y, Zhu B, Lu J, Ge S, Qu L, Xiao J, Wang L, Cai C. Copper Death Inducer, FDX1, as a Prognostic Biomarker Reshaping Tumor Immunity in Clear Cell Renal Cell Carcinoma. Cells. 2023;12. [RCA] [PubMed] [DOI] [Full Text] [Cited by in RCA: 19] [Reference Citation Analysis (0)] |
| 24. | Dreishpoon MB, Bick NR, Petrova B, Warui DM, Cameron A, Booker SJ, Kanarek N, Golub TR, Tsvetkov P. FDX1 regulates cellular protein lipoylation through direct binding to LIAS. J Biol Chem. 2023;299:105046. [RCA] [PubMed] [DOI] [Full Text] [Full Text (PDF)] [Cited by in Crossref: 19] [Cited by in RCA: 70] [Article Influence: 35.0] [Reference Citation Analysis (0)] |
| 25. | Wang J, Qin D, Tao Z, Wang B, Xie Y, Wang Y, Li B, Cao J, Qiao X, Zhong S, Hu X. Identification of cuproptosis-related subtypes, construction of a prognosis model, and tumor microenvironment landscape in gastric cancer. Front Immunol. 2022;13:1056932. [RCA] [PubMed] [DOI] [Full Text] [Full Text (PDF)] [Cited by in RCA: 37] [Reference Citation Analysis (0)] |
| 26. | Brugnera E, Georgiev O, Radtke F, Heuchel R, Baker E, Sutherland GR, Schaffner W. Cloning, chromosomal mapping and characterization of the human metal-regulatory transcription factor MTF-1. Nucleic Acids Res. 1994;22:3167-3173. [RCA] [PubMed] [DOI] [Full Text] [Cited by in Crossref: 162] [Cited by in RCA: 149] [Article Influence: 4.8] [Reference Citation Analysis (0)] |
| 27. | Zhou J, Chen D, Zhang S, Wang C, Zhang L. Identification of two molecular subtypes and a novel prognostic model of lung adenocarcinoma based on a cuproptosis-associated gene signature. Front Genet. 2022;13:1039983. [RCA] [PubMed] [DOI] [Full Text] [Reference Citation Analysis (0)] |
| 28. | Zhang X, Yang Q. Association between serum copper levels and lung cancer risk: A meta-analysis. J Int Med Res. 2018;46:4863-4873. [RCA] [PubMed] [DOI] [Full Text] [Full Text (PDF)] [Cited by in Crossref: 33] [Cited by in RCA: 91] [Article Influence: 13.0] [Reference Citation Analysis (0)] |
| 29. | Sazanov LA, Hinchliffe P. Structure of the hydrophilic domain of respiratory complex I from Thermus thermophilus. Science. 2006;311:1430-1436. [RCA] [PubMed] [DOI] [Full Text] [Cited by in Crossref: 678] [Cited by in RCA: 627] [Article Influence: 33.0] [Reference Citation Analysis (0)] |
| 30. | Machado AM, Desler C, Bøggild S, Strickertsson JA, Friis-Hansen L, Figueiredo C, Seruca R, Rasmussen LJ. Helicobacter pylori infection affects mitochondrial function and DNA repair, thus, mediating genetic instability in gastric cells. Mech Ageing Dev. 2013;134:460-466. [RCA] [PubMed] [DOI] [Full Text] [Cited by in Crossref: 31] [Cited by in RCA: 42] [Article Influence: 3.5] [Reference Citation Analysis (0)] |
| 31. | Zhang C, Zeng Y, Guo X, Shen H, Zhang J, Wang K, Ji M, Huang S. Pan-cancer analyses confirmed the cuproptosis-related gene FDX1 as an immunotherapy predictor and prognostic biomarker. Front Genet. 2022;13:923737. [RCA] [PubMed] [DOI] [Full Text] [Full Text (PDF)] [Cited by in Crossref: 2] [Cited by in RCA: 53] [Article Influence: 17.7] [Reference Citation Analysis (0)] |
| 32. | Yang L, Zhang Y, Wang Y, Jiang P, Liu F, Feng N. Ferredoxin 1 is a cuproptosis-key gene responsible for tumor immunity and drug sensitivity: A pan-cancer analysis. Front Pharmacol. 2022;13:938134. [RCA] [PubMed] [DOI] [Full Text] [Full Text (PDF)] [Cited by in Crossref: 41] [Cited by in RCA: 44] [Article Influence: 14.7] [Reference Citation Analysis (0)] |


