Published online Jun 27, 2024. doi: 10.4240/wjgs.v16.i6.1571
Revised: March 16, 2024
Accepted: April 25, 2024
Published online: June 27, 2024
Processing time: 154 Days and 20.1 Hours
Synchronous liver metastasis (SLM) is a significant contributor to morbidity in colorectal cancer (CRC). There are no effective predictive device integration algorithms to predict adverse SLM events during the diagnosis of CRC.
To explore the risk factors for SLM in CRC and construct a visual prediction model based on gray-level co-occurrence matrix (GLCM) features collected from magnetic resonance imaging (MRI).
Our study retrospectively enrolled 392 patients with CRC from Yichang Central People’s Hospital from January 2015 to May 2023. Patients were randomly divided into a training and validation group (3:7). The clinical parameters and GLCM features extracted from MRI were included as candidate variables. The prediction model was constructed using a generalized linear regression model, random forest model (RFM), and artificial neural network model. Receiver operating characteristic curves and decision curves were used to evaluate the prediction model.
Among the 392 patients, 48 had SLM (12.24%). We obtained fourteen GLCM imaging data for variable screening of SLM prediction models. Inverse difference, mean sum, sum entropy, sum variance, sum of squares, energy, and difference variance were listed as candidate variables, and the prediction efficiency (area under the curve) of the subsequent RFM in the training set and internal validation set was 0.917 [95% confidence interval (95%CI): 0.866-0.968] and 0.09 (95%CI: 0.858-0.960), respectively.
A predictive model combining GLCM image features with machine learning can predict SLM in CRC. This model can assist clinicians in making timely and personalized clinical decisions.
Core Tip: Our predictive model for synchronous liver metastasis (SLM) in colorectal cancer (CRC) patients can screen reliable predictive variables based on clinical features. This is crucial for predicting SLM in CRC and improving patient prognosis. Imaging omics is a discipline that has developed in recent years. Based on advanced deep learning algorithms, extracting imaging features will have practical clinical value for constructing prediction models for SLM in CRC. This study combines imaging and deep learning to construct an early warning prediction model, to provide necessary auxiliary predictions for the occurrence of SLM and guide clinical decision-making.
- Citation: Yang KF, Li SJ, Xu J, Zheng YB. Machine learning prediction model for gray-level co-occurrence matrix features of synchronous liver metastasis in colorectal cancer. World J Gastrointest Surg 2024; 16(6): 1571-1581
- URL: https://www.wjgnet.com/1948-9366/full/v16/i6/1571.htm
- DOI: https://dx.doi.org/10.4240/wjgs.v16.i6.1571
Colorectal cancer (CRC), the third most common malignant tumor worldwide, has a high incidence and mortality rate[1]. Approximately 25%-30% of patients with CRC experience synchronous liver metastasis (SLM), and SLM is one of the most common causes of death in this disease[2,3]. However, despite advancements in surgical interventions, only about 25% of patients are suitable for resection surgery, which is considered a major curative treatment for SLM in CRC[4-6]. As such, early detection of SLM from CRC is important for diagnosis, treatment, and improvement of patient prognosis.
Deep learning algorithms use reliable algorithm development that integrates computing, storage, networking, and other technologies. Machine learning (ML) is a branch of artificial intelligence that focuses on predicting patterns in data through the use of mathematical algorithms. These algorithms are popular for accurately calculating and predicting cancer risk events by combining potential risk factors of tumor development[7]. Existing research has focused on the deep learning applications and integration of different data types to develop decision support tools. However, the lack of alternative candidate parameters for predicting disease urgently needs to be addressed. Imaging is a major component of cancer screening, staging, monitoring, and the evaluation of the aforementioned[8]. In this study, we extracted grayscale features from magnetic resonance imaging (MRI) images from patients with CRC and constructed a gray-level co-occurrence matrix (GLCM) to quantitatively measure texture characteristics.
We utilized GLCM features to capture texture information and image texture specificity to screen candidate variables and to establish a prediction model for SLM that helps clinicians make decisions and provides guidance for early clinical diagnosis and treatment decisions.
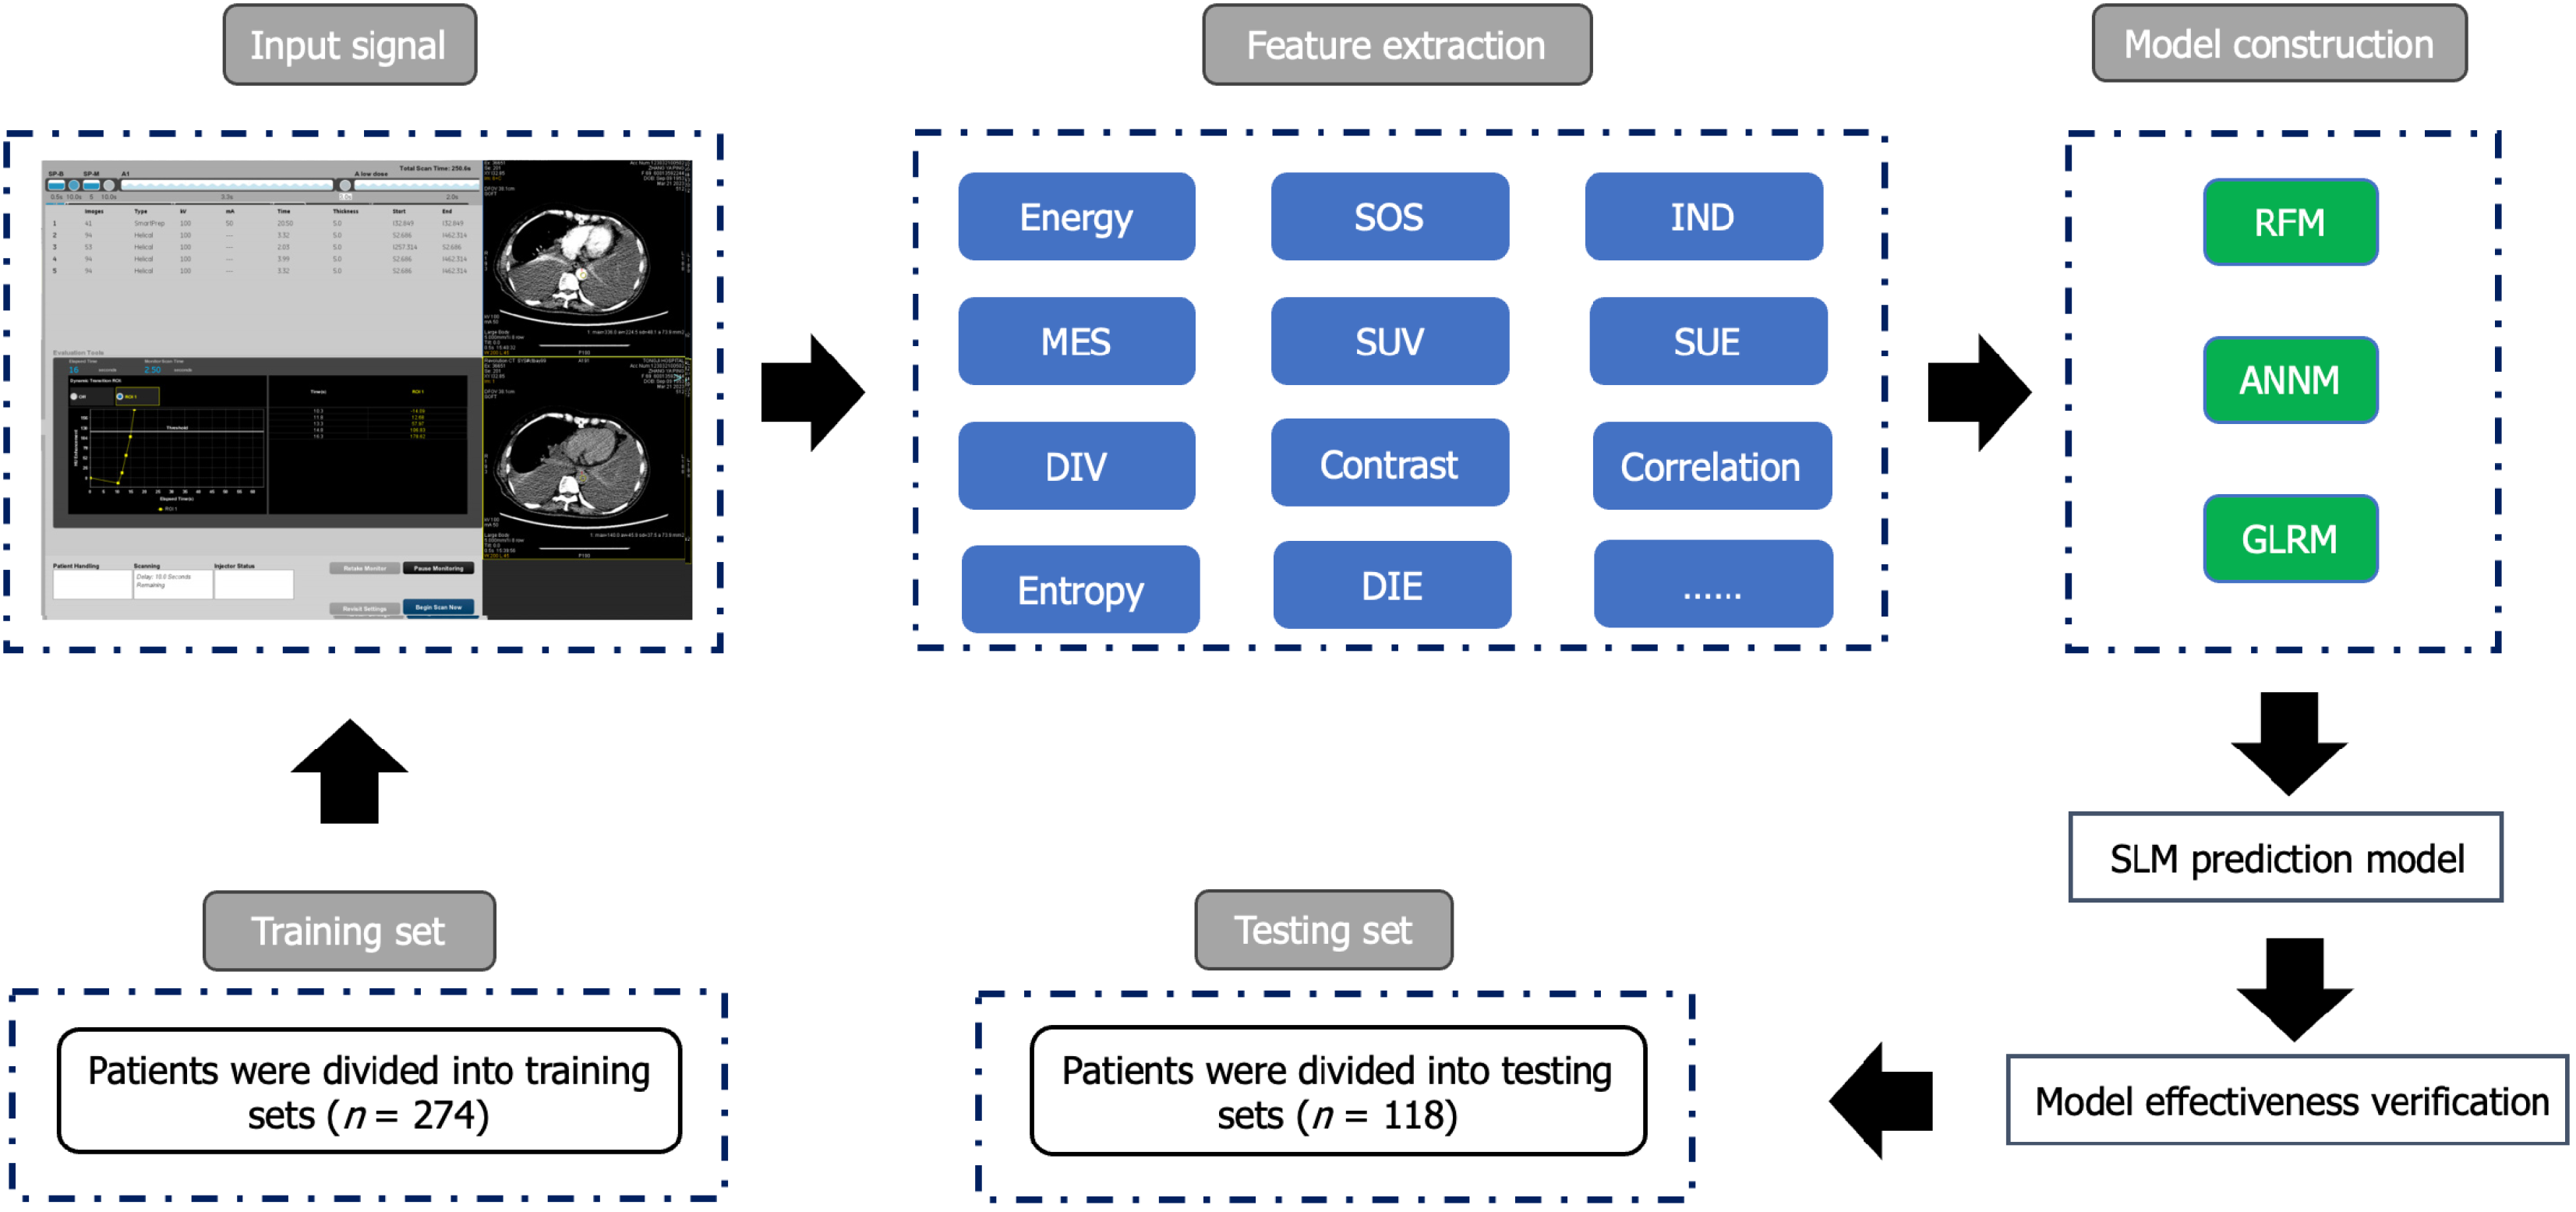
We retrospectively selected 392 patients with CRC from the Gastrointestinal Surgery Department of Yichang Central People’s Hospital from January 2015 to May 2023. The inclusion criteria were as follows: (1) Patients diagnosed with CRC and undergoing surgery; (2) patients aged ≥ 18 years old; (3) patients with complete postoperative pathological information; (4) CRC is the only primary malignant tumor; and (5) patients undergoing preoperative MRI. The exclusion criteria included: (1) Patients who received neoadjuvant radiotherapy and chemotherapy before surgery; (2) patients with incomplete recorded baseline and pathological data; and (3) patients with positive surgical margins and distant metastasis other than SLM after tumor surgery. This retrospective study was approved by the Ethics Committee of Yichang Central People’s Hospital, and the research protocol conforms to the accuracy of artificial intelligence model training while ensuring the confidentiality of personal privacy of all patients included in the study. The study received an informed consent exemption from the Ethics Committee. The process of incorporating patients and building prediction models is shown in Figure 1 and Supplementary Figure 1.
Synchronous detection of liver metastasis was defined as SLM detected before or during the resection of the primary tumor, and in the case of unresectable patients, it was defined as SLM detected before or simultaneously with the primary tumor.
We used Skyra 3.0T or Avanto 1.5T MRI instruments (provided by Siemens) to perform abdominal imaging examinations. The parameter settings were as follows: T2W1, TR 2500 ms, TE 83 ms, layer spacing 1.8 mm, layer thickness 6.0 mm, matrix 352 × 352, FOV 36 cm × 36 cm; The b values of DWI were set to 50 and 800, respectively. A vibe sequence was used for enhanced scanning, with TR 3.97 ms, TE 1.29 ms, and FOV 36 cm × 36 cm. Glucosamine gadolinium pentobate
To ensure the accuracy of data input, we used the following strategies. Firstly, the clinical baseline data and imaging data of patients were independently entered by two people, and the final analysis was proofread. Secondly, both imaging data and review were completed by two senior radiologists (with more than 7 years of experience). If there was a disagreement between the two during the film review, a third party made a ruling. Finally, all records included in this study had less than 5% missing data. Candidate variables exceeding this threshold were imputed using missing values
We automatically extracted imageomics features (i.e., T2W1 and VP images) from the VOIs of each patient’s enhanced venous phase MRI image, including first-order features, morphological features, texture features, and filter-based higher-order features. These features were obtained by analyzing the original image and applying multiple filters to the derived images, including exponential filters, square filters, square root filters, logarithmic filters, and wavelet decomposition. Image texture features (i.e., exponent, square, square root, logarithm, and wavelet transform) were divided into three subgroups: GLCM, including the sum of squares (SOS), mean sum (MES), the inverse difference (IND), sum entropy (SUE), correlation, sum variance (SUV), difference entropy (DIE), difference variance (DIV), energy, entropy, entropy, and contrast, grayscale length matrix, and grayscale shape matrix. In addition, wavelet decomposition included three-dimensional wavelet transform with low-pass filtering and high-pass filtering to quantitatively capture MRI image features.
We adopted a random grouping method (70% and 30% were included in the training and internal validation sets, respectively). In addition, we use lasso regression (i.e., with minimum penalty coefficient and Pearson correlation coefficient) to select candidate predictive variables to use to construct SLM prediction models. We used three popular ML algorithms, namely the generalized linear regression model (GLRM), random forest model (RFM), and artificial neural network model (ANNM), to construct a visual prediction model for SLM[9-12]. We chose the minimum absolute shrinkage and selection operator algorithm and then constructed an SLM prediction model based on MRI features[13]. We used decision curve analysis (DCA)[14], receiver operating characteristic (ROC), and clinical impact curves (CIC) to evaluate the predictive performance of each predictive model[15].
The categorical variables and continuous variables involved in this statistical analysis were tested using the chi-square test, Wilcoxon rank sum test, or T-test, respectively. As for the correlation analysis between two continuous variables, we used the Pearson correlation coefficient evaluation[16]. We used R studio software for data visualization and statistical analysis. A P value less than 0.05 was considered statistically significant.
In the study, a total of 392 patients with CRC were included for SLM prediction model construction. Among them, 48 and 344 patients were assigned to the SLM group and non-SLM group, respectively. The incidence of SLM in the training and validation sets was 13.87% (38/274) and 8.47% (10/118), respectively. The baseline data of the two groups of patients with CRC are summarized in Table 1 and Supplementary Table 1.
| Variables | Overall (n = 392) |
| Age, yr | |
| ≥ 60 | 215 (54.8) |
| < 60 | 177 (45.2) |
| Sex | |
| Male | 194 (49.5) |
| Female | 198 (50.5) |
| BMI, kg/m2 | |
| ≤ 18.5 | 101 (25.8) |
| 18.5-23.9 | 89 (22.7) |
| 24.0-27.9 | 104 (26.5) |
| ≥ 28.0 | 98 (25.0) |
| Smoking | |
| Yes | 201 (51.3) |
| No | 191 (48.7) |
| Drinking | |
| Yes | 222 (56.6) |
| No | 170 (43.4) |
| Intestinal polyp | |
| Yes | 180 (45.9) |
| No | 212 (54.1) |
| AST, U/L | |
| < 40 | 203 (51.8) |
| ≥ 40 | 189 (48.2) |
| ALT, U/L | |
| < 50 | 179 (45.7) |
| ≥ 50 | 213 (54.3) |
| Hypertension | |
| Yes | 180 (45.9) |
| No | 212 (54.1) |
| Diabetes | |
| Yes | 183 (46.7) |
| No | 209 (53.3) |
| CEA, ng/mL | |
| Normal | 216 (55.1) |
| Abnormal | 176 (44.9) |
| CA199, U/mL | |
| Normal | 194 (49.5) |
| Abnormal | 198 (50.5) |
| AFP, ng/mL | |
| ≤ 100 | 191 (48.7) |
| > 100 | 201 (51.3) |
| HbsAg | |
| Yes | 203 (51.8) |
| No | 189 (48.2) |
| Tumor type | |
| Adenocarcinoma | 211 (53.8) |
| Mucinous adenocarcinoma | 181 (46.2) |
| Tumor size, cm | |
| < 5 | 204 (52.0) |
| ≥ 5 | 188 (48.0) |
| NI | |
| Yes | 180 (45.9) |
| No | 212 (54.1) |
| VI | |
| Yes | 134 (34.2) |
| No | 258 (65.8) |
| Energy, median [IQR] | 3.91 [2.55, 5.62] |
| SOS, median [IQR] | 0.88 [0.69, 1.05] |
| IND, median [IQR] | 1.46 [1.17, 1.80] |
| MES, median [IQR] | 2.84 [1.94, 3.36] |
| SUV, median [IQR] | 20.90 [16.28, 25.33] |
| SUE, median [IQR] | 22.20 [17.10, 27.10] |
| DIV, median [IQR] | 87.50 [67.00, 107.00] |
| Contrast, median [IQR] | 291.00 [275.00, 308.00] |
| Correlation, median [IQR] | 16.13 [12.00, 19.22] |
| Entropy, median [IQR] | 2.17 [1.62, 2.64] |
| DIE, median [IQR] | 230.00 [188.00, 276.00] |
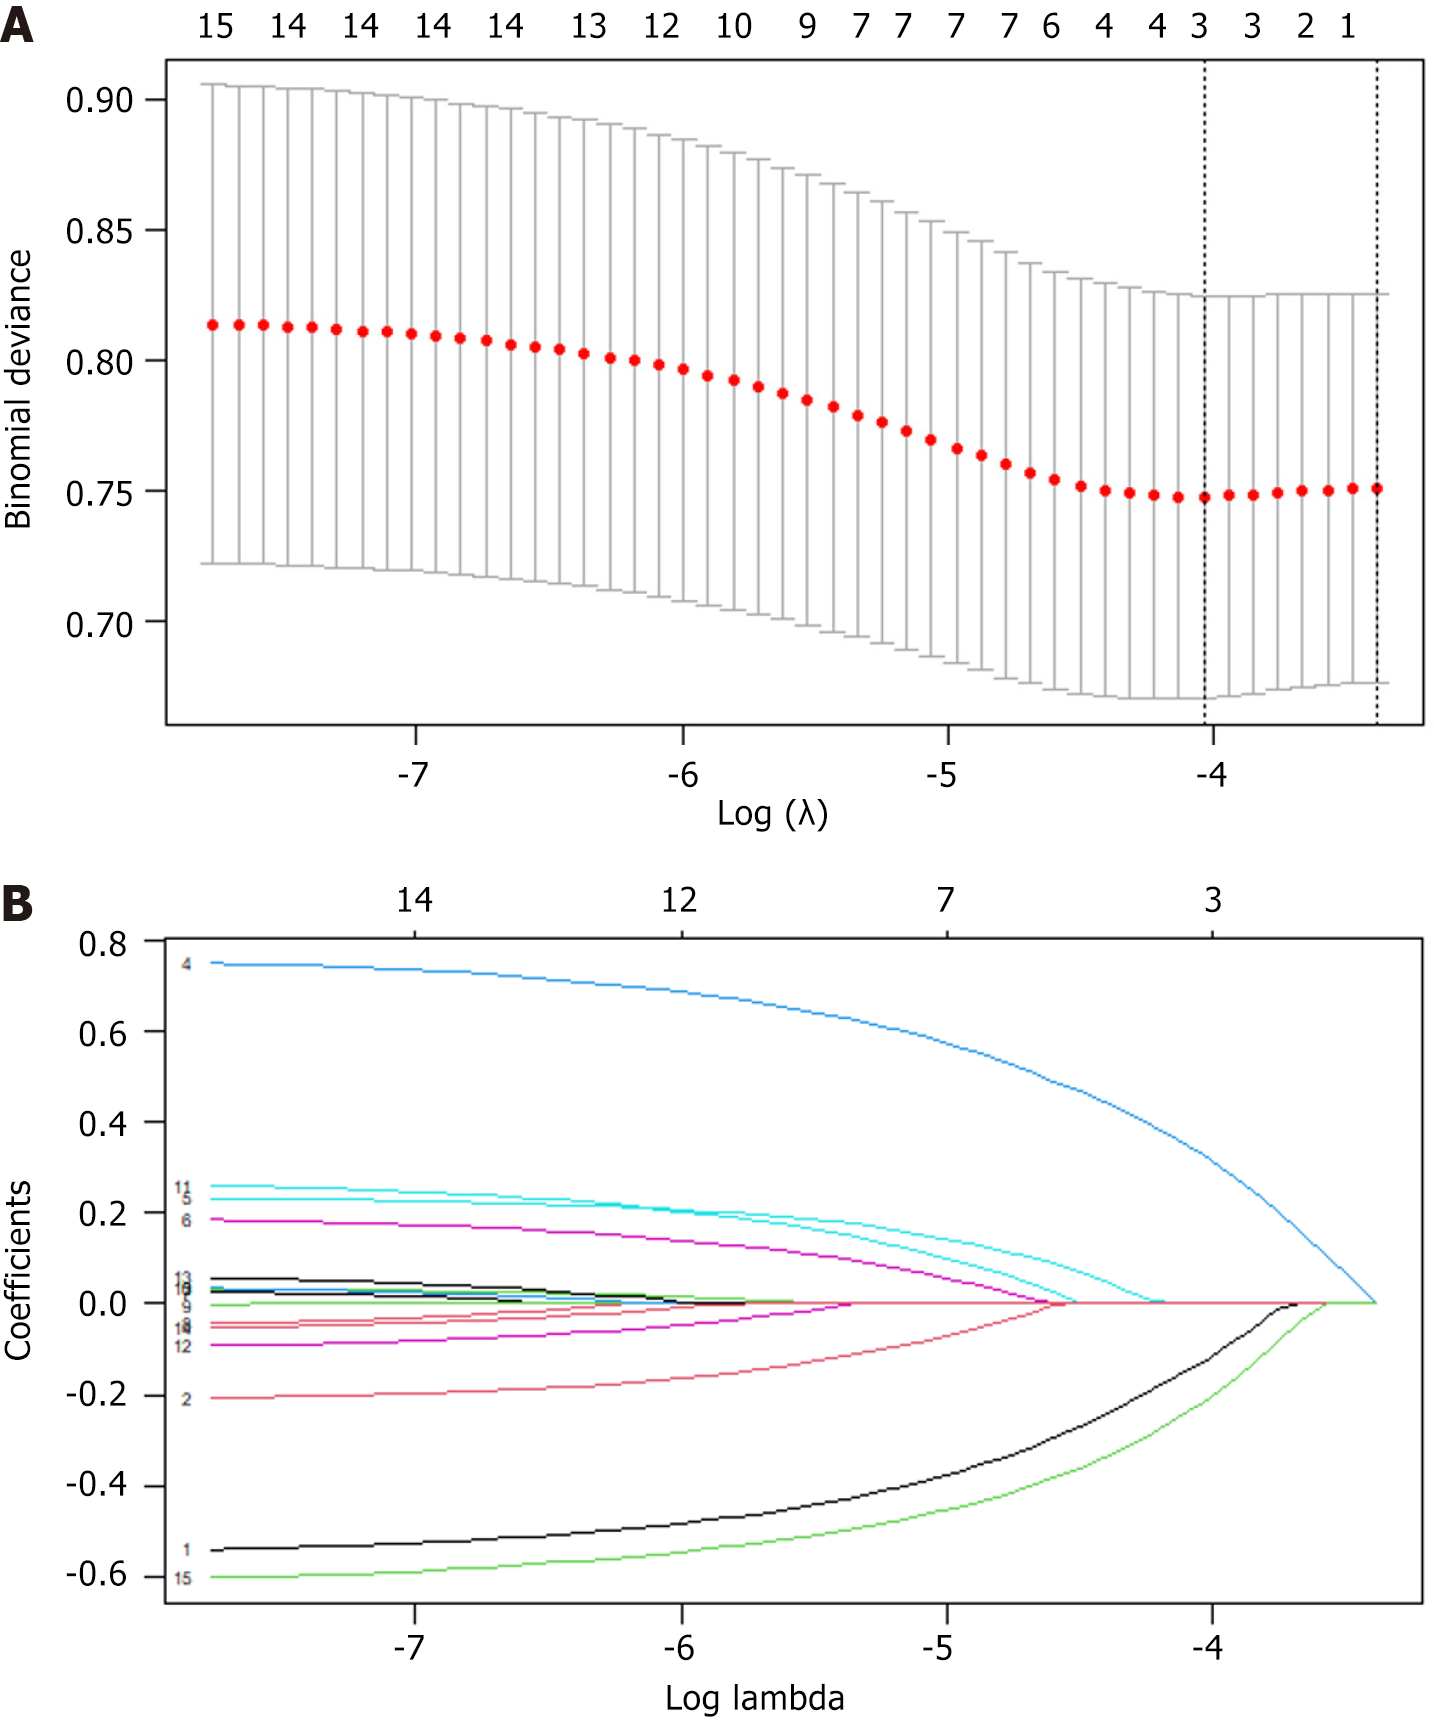
Considering that the candidate variables have biases and non-normal distributions, we performed loss function correction (i.e., added penalty coefficients) to facilitate the selection of the optimal variables. By setting penalty coefficients, we ensured that the coefficients of features with smaller impacts will be infinitely close to zero [i.e., least absolute shrinkage and selection operator (LASSO) regression coefficient screening] to ensure that important features are retained. In the subsequent prediction model construction, we selected candidate variables from 21 variables based on the LASSO coefficient curve to construct independent variables for predicting the risk of SLM. The independent variables were tumor type, vascular invasion, energy, SOS, IND, MES, SUV, SUE, and DIV (Figure 2).
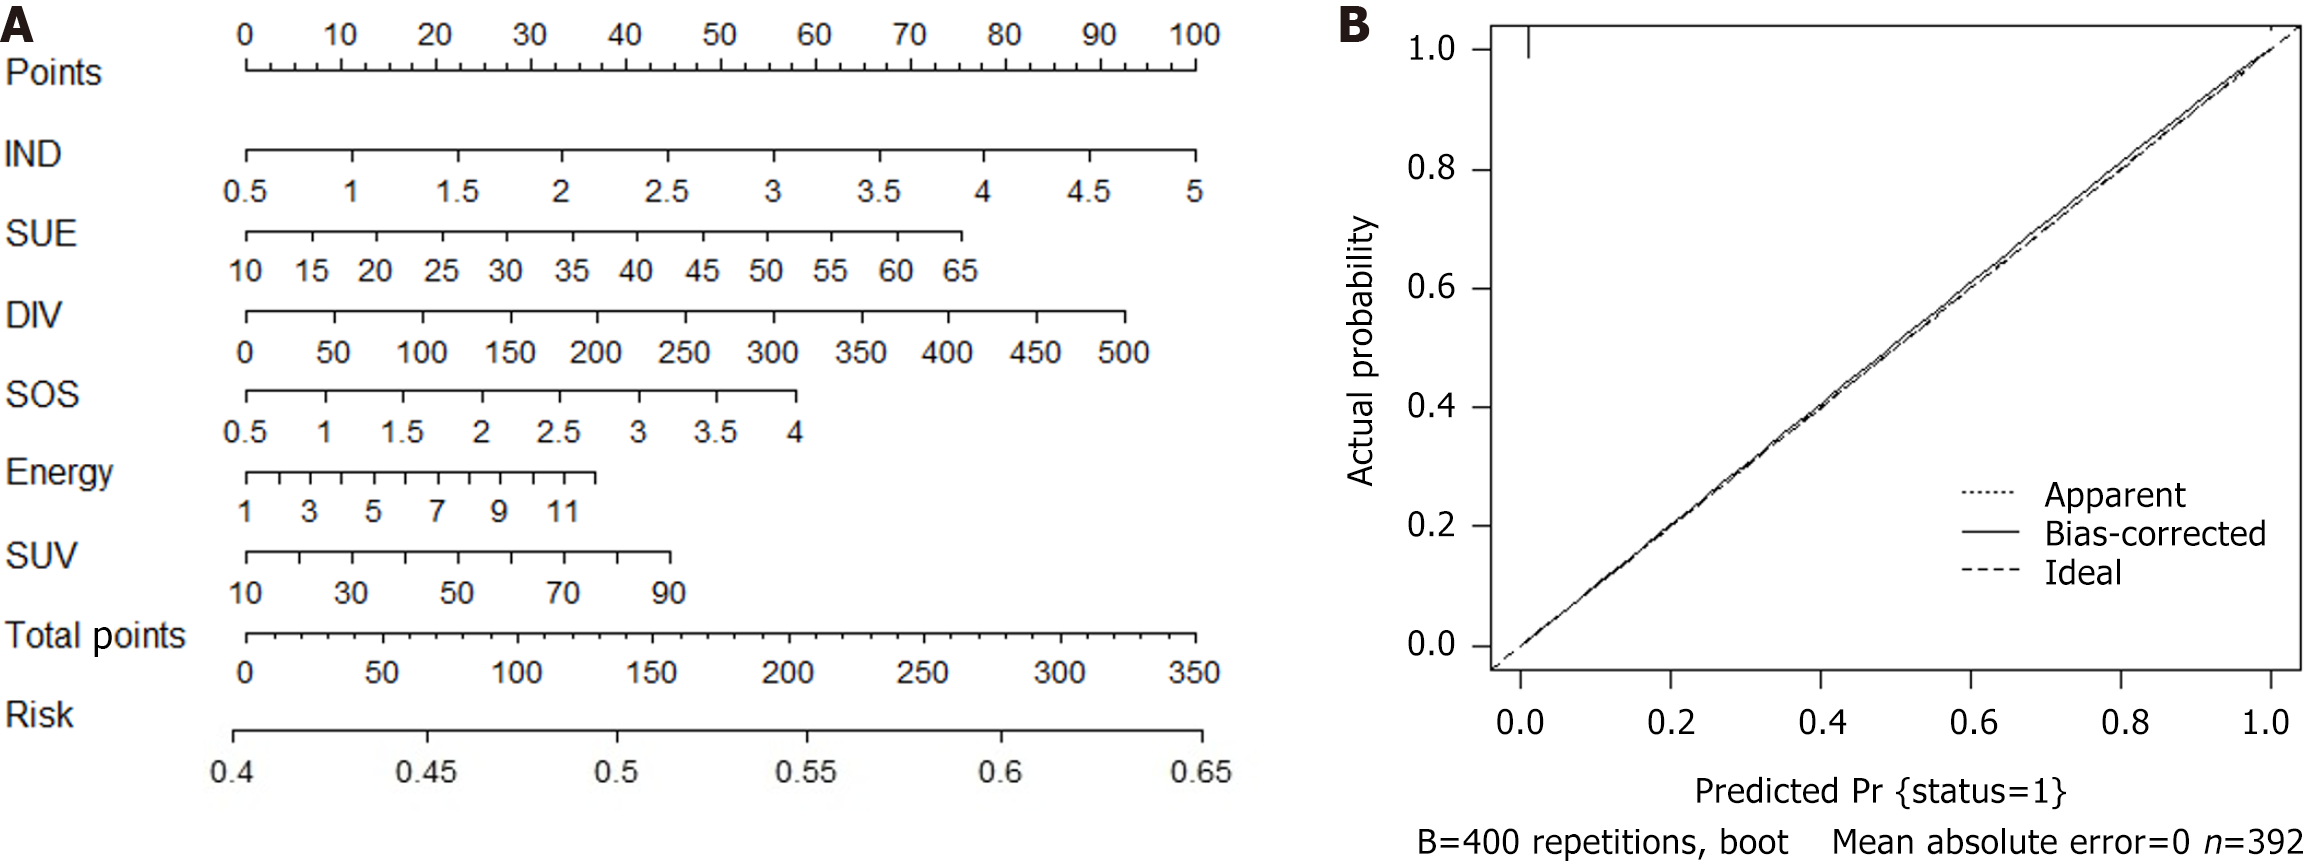
We conducted a logistic regression analysis on all candidate variables (Supplementary Table 2) and ultimately established 9 variables as independent risk predictors for SLM. Based on the Akaike information criterion, we then established a prediction model for SLM and drew a nomogram (Figure 3; Supplementary Table 2). Finally, with the help of nomogram visualization analysis, we evaluated the specific risk coefficient of SLM in patients based on the corresponding risk scale values of the total score. In addition, the C-index value, validated internally by the bootstrap method, was 0.739, indicating that the predictive model had good clinical robustness.
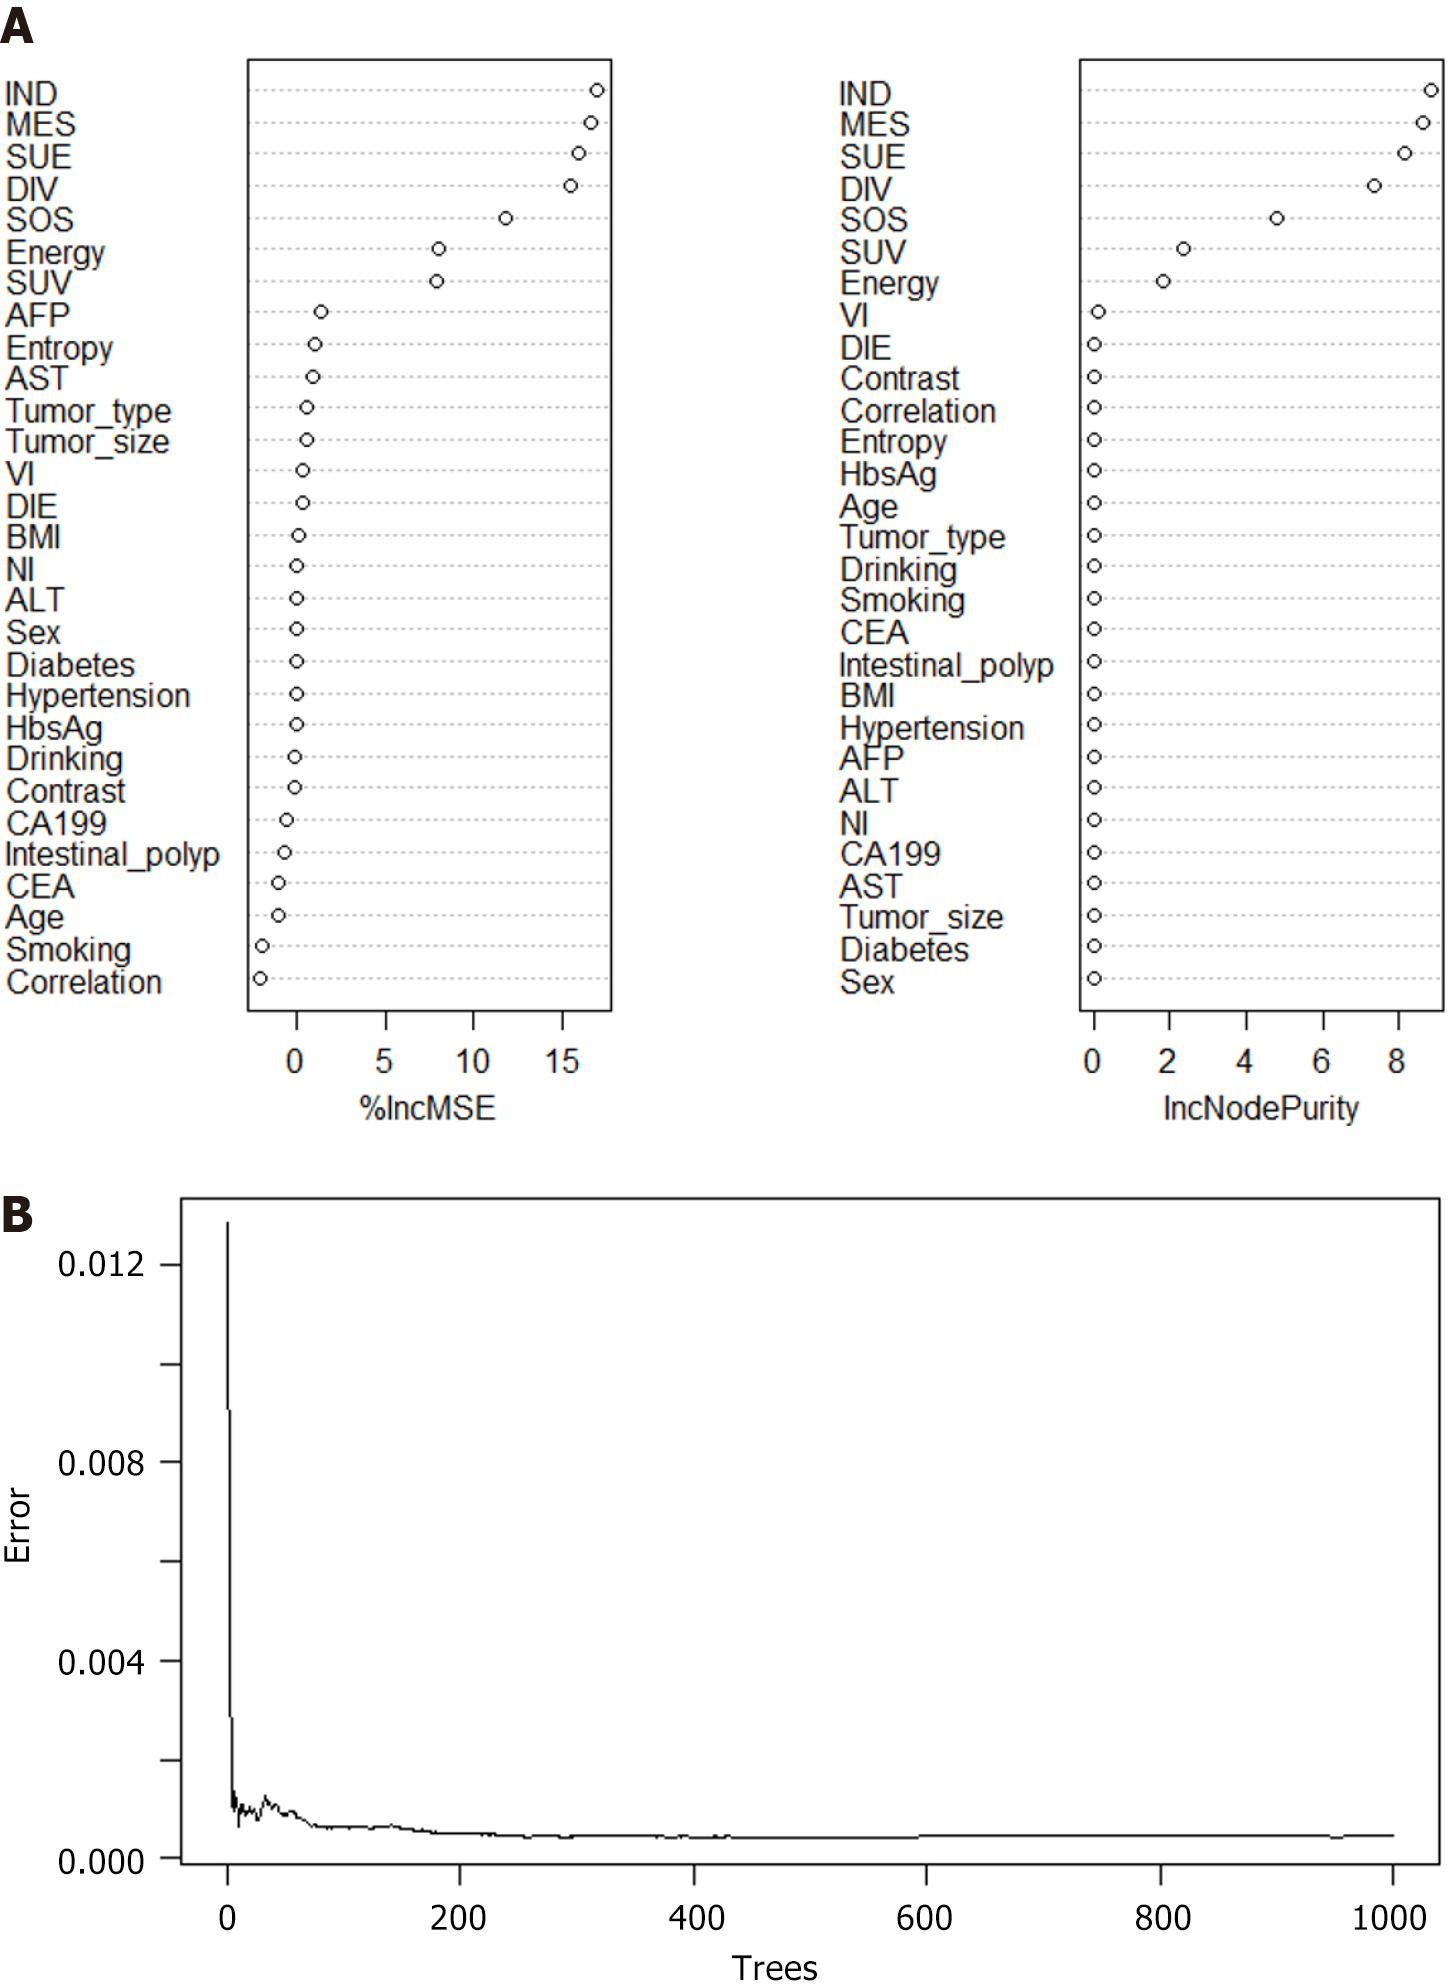
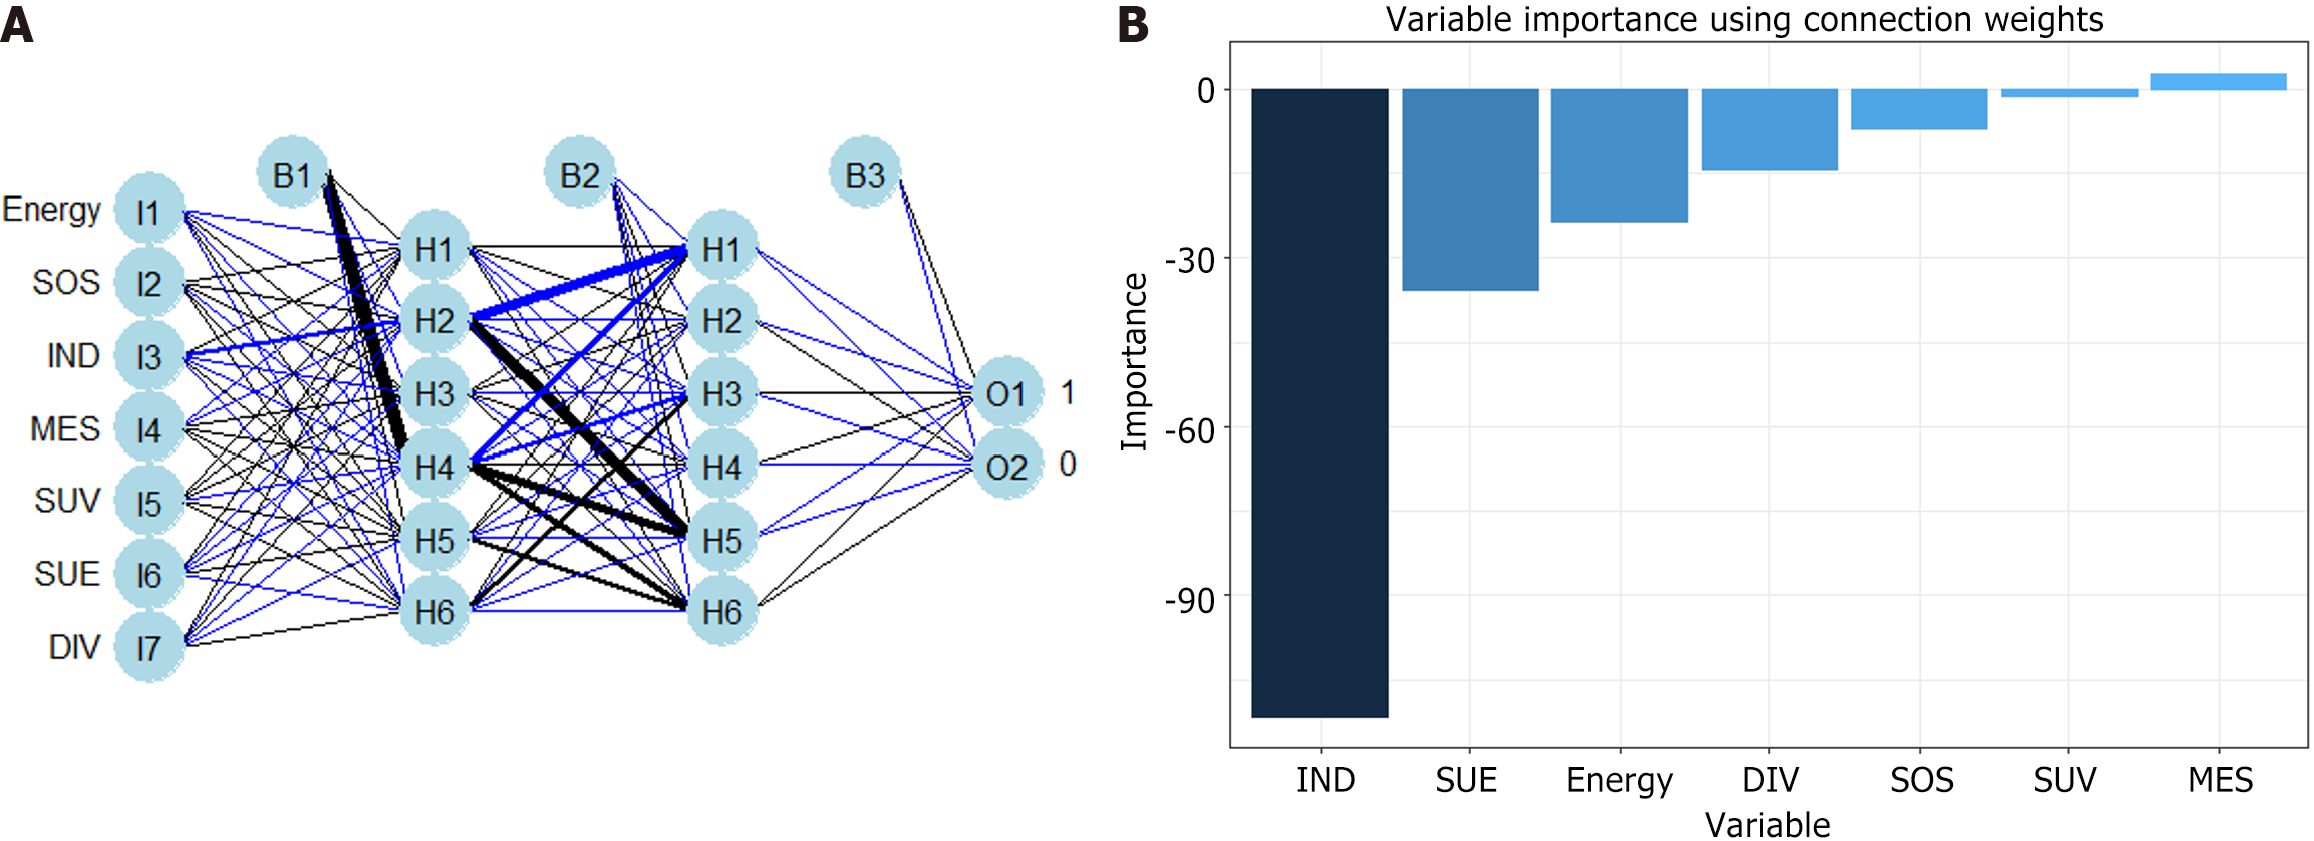
RFM and ANNM are the most commonly used algorithms in ML[9]. In this study, we established SLM prediction models based on four ML algorithms. As shown in Supplementary Table 3, in the RFM prediction model, IND, MES, SUE, DIV, SOS energy, and SUV were the top-ranking weight values, indicating that these variables are potential candidate variables for RFM prediction of SLM (Figure 4). Meanwhile, ANNM, IND, MES, SUE, DIV, SOS energy, and SUV were candidate variables to predict SLM, and their weight proportions in the three different algorithm prediction models did not match, highlighting the different prediction weights of candidate variables (Figure 5; Supplementary Table 4).
The ROC curve showed that the predictive efficacy of RFM in predicting SLM in the training and validation sets was area under the curve (AUC): 0.917 [95% confidence interval (95%CI): 0.866-0.680] and AUC: 0.09 (95%CI: 0.858-0.960), respectively. The ROC curve of ANNM in predicting SLM in the training and validation sets was AUC: 0.796 (95%CI: 0.745-0.847) and AUC: 0.806 (95%CI: 0.755-0.857), respectively, indicating that the predictive efficacy was not as good as RFM. Table 2 and Supplementary Figure 2 show the predictive performance of preoperative GLCM-based radiomics for SLM. Overall, the predictive efficiency of the SLM models based on ML algorithms for patients with CRC is significantly better than GLRM.
In Figure 6, the horizontal and vertical axes of DCA represent the threshold probability and net benefit, respectively. The black horizontal line indicated that when all patients had no SLM status, the net benefit rate was zero. Conversely, the gray diagonal line indicated the gap between all SLM patients receiving treatment and their ideal state. The DCA curve can assist in guiding the clinical performance of predictive models, thereby evaluating the superiority or inferiority of these models.
To further evaluate the discriminative efficiency of the RFM prediction models, we used CIC. As shown in Supplementary Figure 3, RFM can distinguish SLM patients and was highly consistent with the postoperative pathological examination results. Our research indicates that RFM, as a predictive tool for evaluating SLM in patients with CRC, has high predictive reliability and may be used as a clinical decision aid. This also shows that RFM is more suitable for preoperative risk assessment in SLM.
CRC is one of the main contributors to global cancer incidence and mortality. Distant metastasis is the predominant reason for poor patient prognosis and the liver is the most common metastatic organ[17,18]. Previous studies have shown that the survival rate of patients with regional or distal CRC is low, and if there is no metastasis, the prognosis is better[2,19]. Over 25% of patients with CRC have SLM detected at the first diagnosis, and up to 25% have SLM detected after primary tumor resection[20-22]. More than one-third of patients with CRC already have cancer development into all liver tissues when SLM is diagnosed[23]. Early detection can lead to early treatment and reduce mortality. Thus, effective SLM biomarkers may contribute to early treatment management. In this study, we constructed a GLCM composed of MRI, which has the potential to evaluate SLM in CRC patients based on feature-based risk scoring. We found that indicates that preoperative MRI examination and texture analysis using sequence images in CRC have significant application prospects in the risk stratification of SLM.
Although radiomic models have been increasingly used in computer-aided diagnosis and imaging biomarkers, their application in computed tomography or MRI is limited by the variability of image characteristics generated by different scanners, imaging protocols, patient anatomies, and increasingly diverse reconstruction and post-processing software[24,25]. While these effects can be mitigated through careful data management and protocol standardization, these measures are impractical for applying to different sources of image data. In this study, we adopted a generalized traditional end-to-end imaging system model, using radiomic calculations as an explicit stage[26]. This model not only predicts unexpected variability in radiomics but also forms an estimation of the true potential of radiomics. This framework has the potential to standardize radiomics under imaging conditions, making radiomics more widely applicable. We added candidate variables with predicted values to the ML-based algorithm model, and the results showed that the GLCM-based prediction efficiency reaches the highest of 0.917 without distinguishing the predicted variables.
ML can handle complex phenomena through data-driven analysis[27]. Compared with traditional methods, ML significantly reduces the prediction error of trajectories[28,29]. Consistent with previous studies, this study also indicates that due to the continuous updating of predictive model algorithms, ML models typically provide better predictive performance than traditional linear models[30]. These models can effectively utilize limited data and improve the robustness of prediction models by transferring existing similar models or training them repeatedly. For example, the best prediction model trained in this study, RFM, had superior robustness and prediction accuracy compared to traditional linear regression models. These results further confirm the generalizability and clinical applicability of deep learning in combining radiomics to predict synchronous SLM.
This study has some limitations. Firstly, due to the standard requirements of the acquisition of MRI parameters and equipment, the sample size included in this study is relatively small and comes from a single center. Future prospective cohort studies encompassing multiple centers and large samples should be conducted. Secondly, as a retrospective study, there is inevitably selection bias in the inclusion of research subjects, as well as potential bias caused by personal experience or non-objective factors. Thirdly, this study obtained GLCM-related parameters based on MRI but did not include features such as high-order textures in the analysis. Therefore, it is necessary to optimize and expand the filtering of high-order texture parameters in subsequent research, to obtain more candidate variables with potential predictive value to construct better SLM prediction models.
Combining ML-based algorithms with readily available GLCM radiomic features can quickly and accurately assess the risk of SLM in patients with CRC before surgery. In particular, algorithms based on RFM can help clinicians identify high-risk patients with SLM promptly, and make robust surgical decisions.
Provenance and peer review: Unsolicited article; Externally peer reviewed.
Peer-review model: Single blind
Specialty type: Surgery
Country of origin: China
Peer-review report’s classification
Scientific Quality: Grade B, Grade C
Novelty: Grade B, Grade B
Creativity or Innovation: Grade B, Grade B
Scientific Significance: Grade B, Grade B
P-Reviewer: Bordonaro M, United States; Wu J, China S-Editor: Chen YL L-Editor: A P-Editor: Zhang XD
| 1. | Dekker E, Tanis PJ, Vleugels JLA, Kasi PM, Wallace MB. Colorectal cancer. Lancet. 2019;394:1467-1480. [RCA] [PubMed] [DOI] [Full Text] [Cited by in Crossref: 1570] [Cited by in RCA: 3015] [Article Influence: 502.5] [Reference Citation Analysis (3)] |
| 2. | Engstrand J, Nilsson H, Strömberg C, Jonas E, Freedman J. Colorectal cancer liver metastases - a population-based study on incidence, management and survival. BMC Cancer. 2018;18:78. [RCA] [PubMed] [DOI] [Full Text] [Full Text (PDF)] [Cited by in Crossref: 299] [Cited by in RCA: 595] [Article Influence: 85.0] [Reference Citation Analysis (1)] |
| 3. | Adam R, De Gramont A, Figueras J, Guthrie A, Kokudo N, Kunstlinger F, Loyer E, Poston G, Rougier P, Rubbia-Brandt L, Sobrero A, Tabernero J, Teh C, Van Cutsem E; Jean-Nicolas Vauthey of the EGOSLIM (Expert Group on OncoSurgery management of LIver Metastases) group. The oncosurgery approach to managing liver metastases from colorectal cancer: a multidisciplinary international consensus. Oncologist. 2012;17:1225-1239. [RCA] [PubMed] [DOI] [Full Text] [Cited by in Crossref: 343] [Cited by in RCA: 412] [Article Influence: 31.7] [Reference Citation Analysis (0)] |
| 4. | Hackl C, Neumann P, Gerken M, Loss M, Klinkhammer-Schalke M, Schlitt HJ. Treatment of colorectal liver metastases in Germany: a ten-year population-based analysis of 5772 cases of primary colorectal adenocarcinoma. BMC Cancer. 2014;14:810. [RCA] [PubMed] [DOI] [Full Text] [Full Text (PDF)] [Cited by in Crossref: 141] [Cited by in RCA: 246] [Article Influence: 22.4] [Reference Citation Analysis (0)] |
| 5. | Van Cutsem E, Cervantes A, Adam R, Sobrero A, Van Krieken JH, Aderka D, Aranda Aguilar E, Bardelli A, Benson A, Bodoky G, Ciardiello F, D'Hoore A, Diaz-Rubio E, Douillard JY, Ducreux M, Falcone A, Grothey A, Gruenberger T, Haustermans K, Heinemann V, Hoff P, Köhne CH, Labianca R, Laurent-Puig P, Ma B, Maughan T, Muro K, Normanno N, Österlund P, Oyen WJ, Papamichael D, Pentheroudakis G, Pfeiffer P, Price TJ, Punt C, Ricke J, Roth A, Salazar R, Scheithauer W, Schmoll HJ, Tabernero J, Taïeb J, Tejpar S, Wasan H, Yoshino T, Zaanan A, Arnold D. ESMO consensus guidelines for the management of patients with metastatic colorectal cancer. Ann Oncol. 2016;27:1386-1422. [RCA] [PubMed] [DOI] [Full Text] [Cited by in Crossref: 2286] [Cited by in RCA: 2427] [Article Influence: 269.7] [Reference Citation Analysis (31)] |
| 6. | House MG, Ito H, Gönen M, Fong Y, Allen PJ, DeMatteo RP, Brennan MF, Blumgart LH, Jarnagin WR, D'Angelica MI. Survival after hepatic resection for metastatic colorectal cancer: trends in outcomes for 1,600 patients during two decades at a single institution. J Am Coll Surg. 2010;210:744-752, 752. [RCA] [PubMed] [DOI] [Full Text] [Cited by in Crossref: 327] [Cited by in RCA: 357] [Article Influence: 23.8] [Reference Citation Analysis (1)] |
| 7. | Tran KA, Kondrashova O, Bradley A, Williams ED, Pearson JV, Waddell N. Deep learning in cancer diagnosis, prognosis and treatment selection. Genome Med. 2021;13:152. [RCA] [PubMed] [DOI] [Full Text] [Full Text (PDF)] [Cited by in Crossref: 275] [Cited by in RCA: 398] [Article Influence: 99.5] [Reference Citation Analysis (0)] |
| 8. | Kijima S, Sasaki T, Nagata K, Utano K, Lefor AT, Sugimoto H. Preoperative evaluation of colorectal cancer using CT colonography, MRI, and PET/CT. World J Gastroenterol. 2014;20:16964-16975. [RCA] [PubMed] [DOI] [Full Text] [Full Text (PDF)] [Cited by in CrossRef: 115] [Cited by in RCA: 128] [Article Influence: 11.6] [Reference Citation Analysis (0)] |
| 9. | Uddin S, Khan A, Hossain ME, Moni MA. Comparing different supervised machine learning algorithms for disease prediction. BMC Med Inform Decis Mak. 2019;19:281. [RCA] [PubMed] [DOI] [Full Text] [Full Text (PDF)] [Cited by in Crossref: 288] [Cited by in RCA: 546] [Article Influence: 91.0] [Reference Citation Analysis (0)] |
| 10. | Choi RY, Coyner AS, Kalpathy-Cramer J, Chiang MF, Campbell JP. Introduction to Machine Learning, Neural Networks, and Deep Learning. Transl Vis Sci Technol. 2020;9:14. [RCA] [PubMed] [DOI] [Full Text] [Full Text (PDF)] [Cited by in RCA: 255] [Reference Citation Analysis (2)] |
| 11. | Ghiasi MM, Zendehboudi S, Mohsenipour AA. Decision tree-based diagnosis of coronary artery disease: CART model. Comput Methods Programs Biomed. 2020;192:105400. [RCA] [PubMed] [DOI] [Full Text] [Cited by in Crossref: 97] [Cited by in RCA: 81] [Article Influence: 16.2] [Reference Citation Analysis (0)] |
| 12. | Huang S, Cai N, Pacheco PP, Narrandes S, Wang Y, Xu W. Applications of Support Vector Machine (SVM) Learning in Cancer Genomics. Cancer Genomics Proteomics. 2018;15:41-51. [RCA] [PubMed] [DOI] [Full Text] [Cited by in Crossref: 327] [Cited by in RCA: 424] [Article Influence: 60.6] [Reference Citation Analysis (0)] |
| 13. | Alhamzawi R, Ali HTM. The Bayesian adaptive lasso regression. Math Biosci. 2018;303:75-82. [RCA] [PubMed] [DOI] [Full Text] [Cited by in Crossref: 61] [Cited by in RCA: 140] [Article Influence: 20.0] [Reference Citation Analysis (0)] |
| 14. | Van Calster B, Wynants L, Verbeek JFM, Verbakel JY, Christodoulou E, Vickers AJ, Roobol MJ, Steyerberg EW. Reporting and Interpreting Decision Curve Analysis: A Guide for Investigators. Eur Urol. 2018;74:796-804. [RCA] [PubMed] [DOI] [Full Text] [Cited by in Crossref: 275] [Cited by in RCA: 759] [Article Influence: 108.4] [Reference Citation Analysis (0)] |
| 15. | Hou N, Li M, He L, Xie B, Wang L, Zhang R, Yu Y, Sun X, Pan Z, Wang K. Predicting 30-days mortality for MIMIC-III patients with sepsis-3: a machine learning approach using XGboost. J Transl Med. 2020;18:462. [RCA] [PubMed] [DOI] [Full Text] [Full Text (PDF)] [Cited by in Crossref: 319] [Cited by in RCA: 278] [Article Influence: 55.6] [Reference Citation Analysis (0)] |
| 16. | Fay MP, Malinovsky Y. Confidence intervals of the Mann-Whitney parameter that are compatible with the Wilcoxon-Mann-Whitney test. Stat Med. 2018;37:3991-4006. [RCA] [PubMed] [DOI] [Full Text] [Cited by in Crossref: 24] [Cited by in RCA: 43] [Article Influence: 6.1] [Reference Citation Analysis (0)] |
| 17. | Siegel RL, Miller KD, Goding Sauer A, Fedewa SA, Butterly LF, Anderson JC, Cercek A, Smith RA, Jemal A. Colorectal cancer statistics, 2020. CA Cancer J Clin. 2020;70:145-164. [RCA] [PubMed] [DOI] [Full Text] [Cited by in Crossref: 2268] [Cited by in RCA: 3268] [Article Influence: 653.6] [Reference Citation Analysis (2)] |
| 18. | van der Geest LG, Lam-Boer J, Koopman M, Verhoef C, Elferink MA, de Wilt JH. Nationwide trends in incidence, treatment and survival of colorectal cancer patients with synchronous metastases. Clin Exp Metastasis. 2015;32:457-465. [RCA] [PubMed] [DOI] [Full Text] [Cited by in Crossref: 264] [Cited by in RCA: 374] [Article Influence: 37.4] [Reference Citation Analysis (0)] |
| 19. | Willem H, Jooste V, Boussari O, Romain G, Bouvier AM. Impact of absence of consensual cutoff time distinguishing between synchronous and metachronous metastases: illustration with colorectal cancer. Eur J Cancer Prev. 2019;28:167-172. [RCA] [PubMed] [DOI] [Full Text] [Cited by in Crossref: 1] [Cited by in RCA: 1] [Article Influence: 0.2] [Reference Citation Analysis (0)] |
| 20. | Al Bandar MH, Kim NK. Current status and future perspectives on treatment of liver metastasis in colorectal cancer (Review). Oncol Rep. 2017;37:2553-2564. [RCA] [PubMed] [DOI] [Full Text] [Cited by in Crossref: 61] [Cited by in RCA: 98] [Article Influence: 12.3] [Reference Citation Analysis (0)] |
| 21. | Sung H, Ferlay J, Siegel RL, Laversanne M, Soerjomataram I, Jemal A, Bray F. Global Cancer Statistics 2020: GLOBOCAN Estimates of Incidence and Mortality Worldwide for 36 Cancers in 185 Countries. CA Cancer J Clin. 2021;71:209-249. [RCA] [PubMed] [DOI] [Full Text] [Cited by in Crossref: 75126] [Cited by in RCA: 64542] [Article Influence: 16135.5] [Reference Citation Analysis (176)] |
| 22. | Robinson JR, Newcomb PA, Hardikar S, Cohen SA, Phipps AI. Stage IV colorectal cancer primary site and patterns of distant metastasis. Cancer Epidemiol. 2017;48:92-95. [RCA] [PubMed] [DOI] [Full Text] [Cited by in Crossref: 34] [Cited by in RCA: 67] [Article Influence: 8.4] [Reference Citation Analysis (0)] |
| 23. | Wang SH, Song L, Tang JY, Sun WP, Li Z. Safety and long-term prognosis of simultaneous versus staged resection in synchronous colorectal cancer with liver metastasis: a systematic review and meta-analysis. Eur J Med Res. 2022;27:297. [RCA] [PubMed] [DOI] [Full Text] [Cited by in RCA: 11] [Reference Citation Analysis (0)] |
| 24. | Gang GJ, Deshpande R, Stayman JW. End-to-end Modeling for Predicting and Estimating Radiomics: Application to Gray Level Co-occurrence Matrices in CT. Proc SPIE Int Soc Opt Eng. 2021;11595. [RCA] [PubMed] [DOI] [Full Text] [Cited by in Crossref: 1] [Cited by in RCA: 1] [Article Influence: 0.3] [Reference Citation Analysis (0)] |
| 25. | Larue RT, Defraene G, De Ruysscher D, Lambin P, van Elmpt W. Quantitative radiomics studies for tissue characterization: a review of technology and methodological procedures. Br J Radiol. 2017;90:20160665. [RCA] [PubMed] [DOI] [Full Text] [Full Text (PDF)] [Cited by in Crossref: 209] [Cited by in RCA: 247] [Article Influence: 27.4] [Reference Citation Analysis (0)] |
| 26. | Mackin D, Fave X, Zhang L, Fried D, Yang J, Taylor B, Rodriguez-Rivera E, Dodge C, Jones AK, Court L. Measuring Computed Tomography Scanner Variability of Radiomics Features. Invest Radiol. 2015;50:757-765. [RCA] [PubMed] [DOI] [Full Text] [Cited by in Crossref: 388] [Cited by in RCA: 487] [Article Influence: 54.1] [Reference Citation Analysis (0)] |
| 27. | Deo RC. Machine Learning in Medicine. Circulation. 2015;132:1920-1930. [RCA] [PubMed] [DOI] [Full Text] [Cited by in Crossref: 1155] [Cited by in RCA: 1956] [Article Influence: 217.3] [Reference Citation Analysis (6)] |
| 28. | Sultan AS, Elgharib MA, Tavares T, Jessri M, Basile JR. The use of artificial intelligence, machine learning and deep learning in oncologic histopathology. J Oral Pathol Med. 2020;49:849-856. [RCA] [PubMed] [DOI] [Full Text] [Cited by in Crossref: 27] [Cited by in RCA: 85] [Article Influence: 17.0] [Reference Citation Analysis (0)] |
| 29. | Rauschert S, Raubenheimer K, Melton PE, Huang RC. Machine learning and clinical epigenetics: a review of challenges for diagnosis and classification. Clin Epigenetics. 2020;12:51. [RCA] [PubMed] [DOI] [Full Text] [Full Text (PDF)] [Cited by in Crossref: 110] [Cited by in RCA: 112] [Article Influence: 22.4] [Reference Citation Analysis (0)] |
| 30. | Zhou H, Tang J, Zheng H. Machine learning for medical applications. ScientificWorldJournal. 2015;2015:825267. [RCA] [PubMed] [DOI] [Full Text] [Full Text (PDF)] [Cited by in Crossref: 2] [Cited by in RCA: 6] [Article Influence: 0.6] [Reference Citation Analysis (0)] |


