Copyright
©The Author(s) 2016.
World J Gastrointest Surg. Jan 27, 2016; 8(1): 27-40
Published online Jan 27, 2016. doi: 10.4240/wjgs.v8.i1.27
Published online Jan 27, 2016. doi: 10.4240/wjgs.v8.i1.27
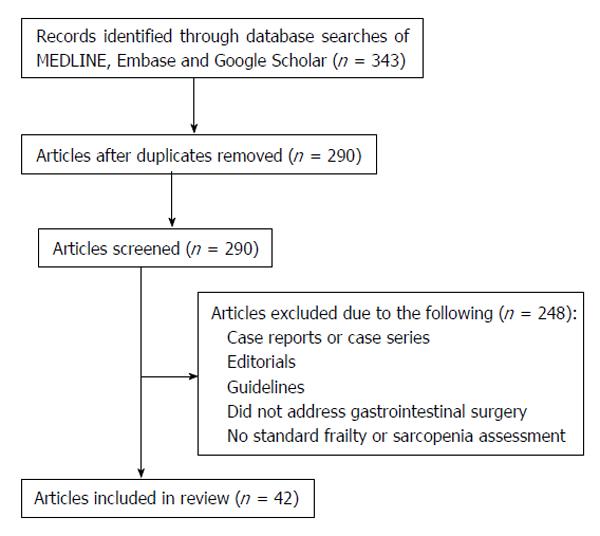
Figure 1 Flow chart depicting the review process for the inclusion of publications.
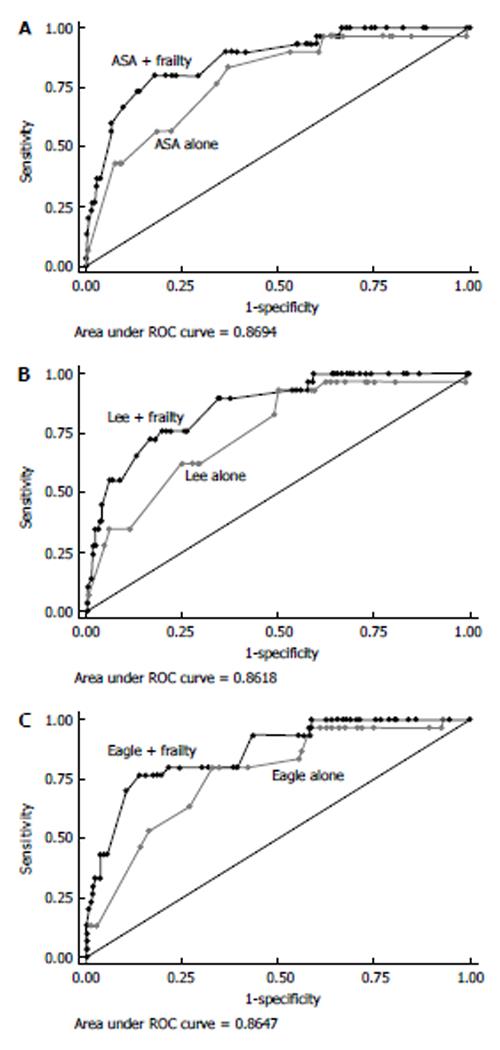
Figure 2 Power of frailty to predict worse outcomes was much higher than traditional peri-operative assessments.
A: American Society of Anesthesiologists (ASA); B: Lee; C: Eagle risk indices. Each panel shows the area under the receiver operator characteristics (ROC) curve to demonstrate the ability of the specific risk index to predict surgical complications and discharge to an assisted or skilled nursing facility. Frailty was added to the risk index scoring to demonstrate the combined ability of these indices to predict discharge disposition. Used with permission Makary et al[22], 2010.
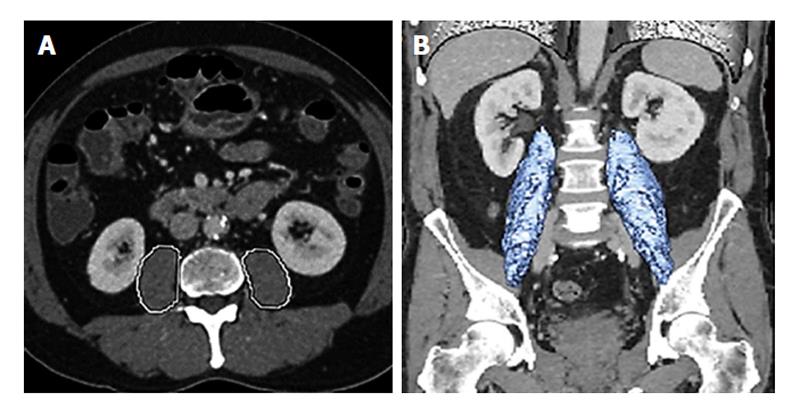
Figure 3 Define sarcopenia rather than a single axial image.
A: Total psoas area is measured by circling both psoas muscles at the level of the patients computed tomography where both iliac crests are visible; B: Total psoas volume is measured at the full length of the psoas muscles and normalized for the patients body surface area. Used with permission Amini et al[47], 2015.
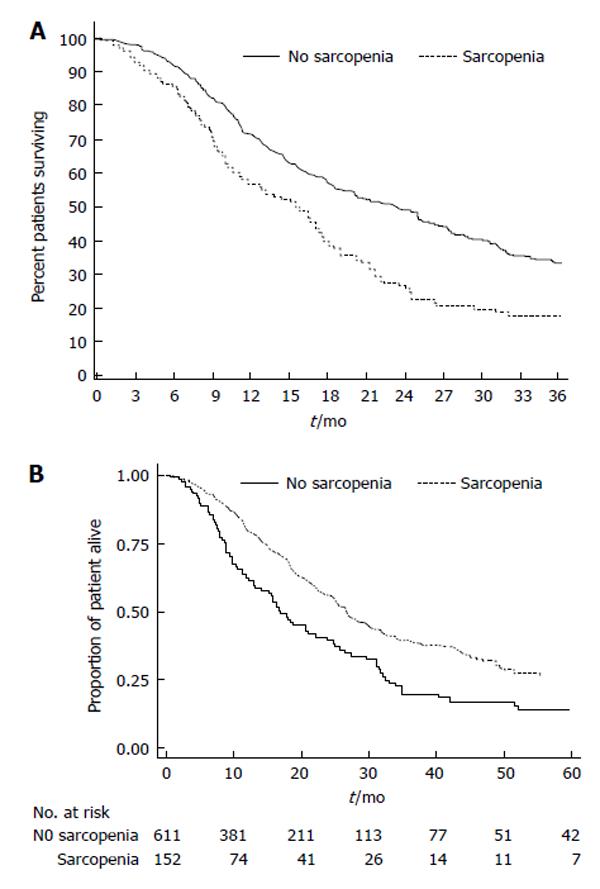
Figure 4 Sarcopenia was associated with an increased three year mortality.
A: The presence of sarcopenia was also associated with the risk of death (no sarcopenia, 18.0 mo; 40.0% vs sarcopenia, 13.7 mo; 23.0% vs median, 3-yr survival, respectively; P = 0.01) in patients undergoing pancreatic surgery. Used with permission Peng et al[45], 2012; B: The overall survival according to total psoas volume stratified by sarcopenia patients vs no sarcopenia patients quartiles in patients undergoing pancreatic surgeries. Used with permission Amini et al[47], 2015.
- Citation: Wagner D, DeMarco MM, Amini N, Buttner S, Segev D, Gani F, Pawlik TM. Role of frailty and sarcopenia in predicting outcomes among patients undergoing gastrointestinal surgery. World J Gastrointest Surg 2016; 8(1): 27-40
- URL: https://www.wjgnet.com/1948-9366/full/v8/i1/27.htm
- DOI: https://dx.doi.org/10.4240/wjgs.v8.i1.27


