Copyright
©2014 Baishideng Publishing Group Inc.
World J Gastrointest Surg. Nov 27, 2014; 6(11): 208-219
Published online Nov 27, 2014. doi: 10.4240/wjgs.v6.i11.208
Published online Nov 27, 2014. doi: 10.4240/wjgs.v6.i11.208
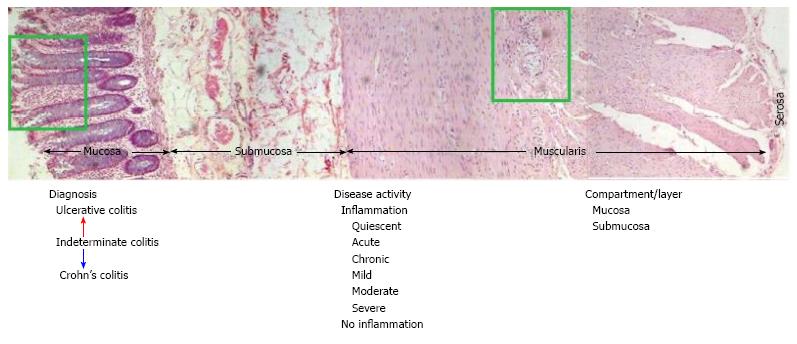
Figure 1 Human colon cross section depicts layers for mining proteomic patterns that delineates untreated ulcerative and Crohn’s colitis phenotype.
The colon is comprised of four distinct layers: (1) the mucosa; (2) the submucosa; (3) the muscularis (two thick bands of muscle); and (4) the serosa. Comparable proteomic patterns that are mined from these layers are analyzed, based on the diagnosis [untreated ulcerative and Crohn’s colitis, (with no ambiguity)], disease activity and tissue layer.
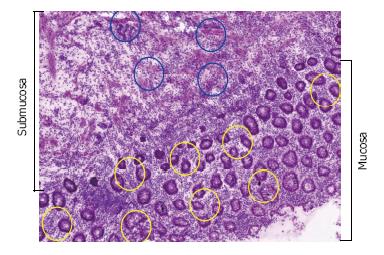
Figure 2 Histology-directed tissue layer profiling for matrix-assisted-laser desorption/ionization mass spectrometry.
Digital photomicrographs acquired from histology and matrix-assisted-laser desorption/ionization sections were used to identify and designate sites of interest for profiling. Comparisons were performed in both the training and independent test set samples between inflamed mucosa Crohn’s colitis (CC) vs ulcerative colitis (UC) and inflamed submucosa CC vs UC. Tissue section showing marked areas of pathological interest. Rings demonstrate matrix spots in mucosal and sub-mucosal layers (unpublished figure).
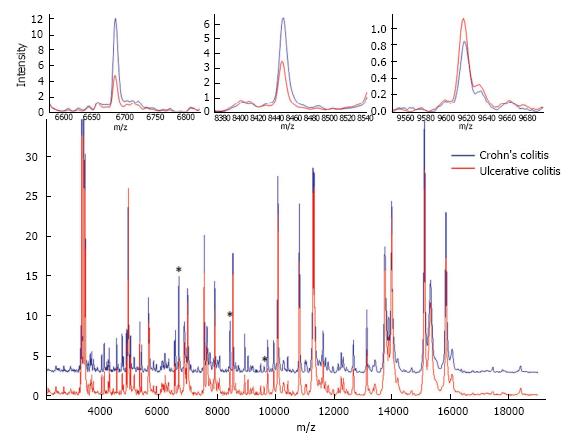
Figure 3 Show averaged mass spectrum proteomic pattern spectra from Crohn’s colitis (blue) and ulcerative colitis (red).
Differential distribution of three selected proteomic pattern peaks (m/z) obtained from colonic mucosal and/or submucosal tissue sections that were part of the Support Vector Machine model. They are denoted by “a” symbol in the full spectra. Reproduced with permission from the publisher: Seeley et al[50].
- Citation: M’Koma AE. Diagnosis of inflammatory bowel disease: Potential role of molecular biometrics. World J Gastrointest Surg 2014; 6(11): 208-219
- URL: https://www.wjgnet.com/1948-9366/full/v6/i11/208.htm
- DOI: https://dx.doi.org/10.4240/wjgs.v6.i11.208


