Copyright
©2012 Baishideng.
World J Gastrointest Surg. Jun 27, 2012; 4(6): 146-151
Published online Jun 27, 2012. doi: 10.4240/wjgs.v4.i6.146
Published online Jun 27, 2012. doi: 10.4240/wjgs.v4.i6.146
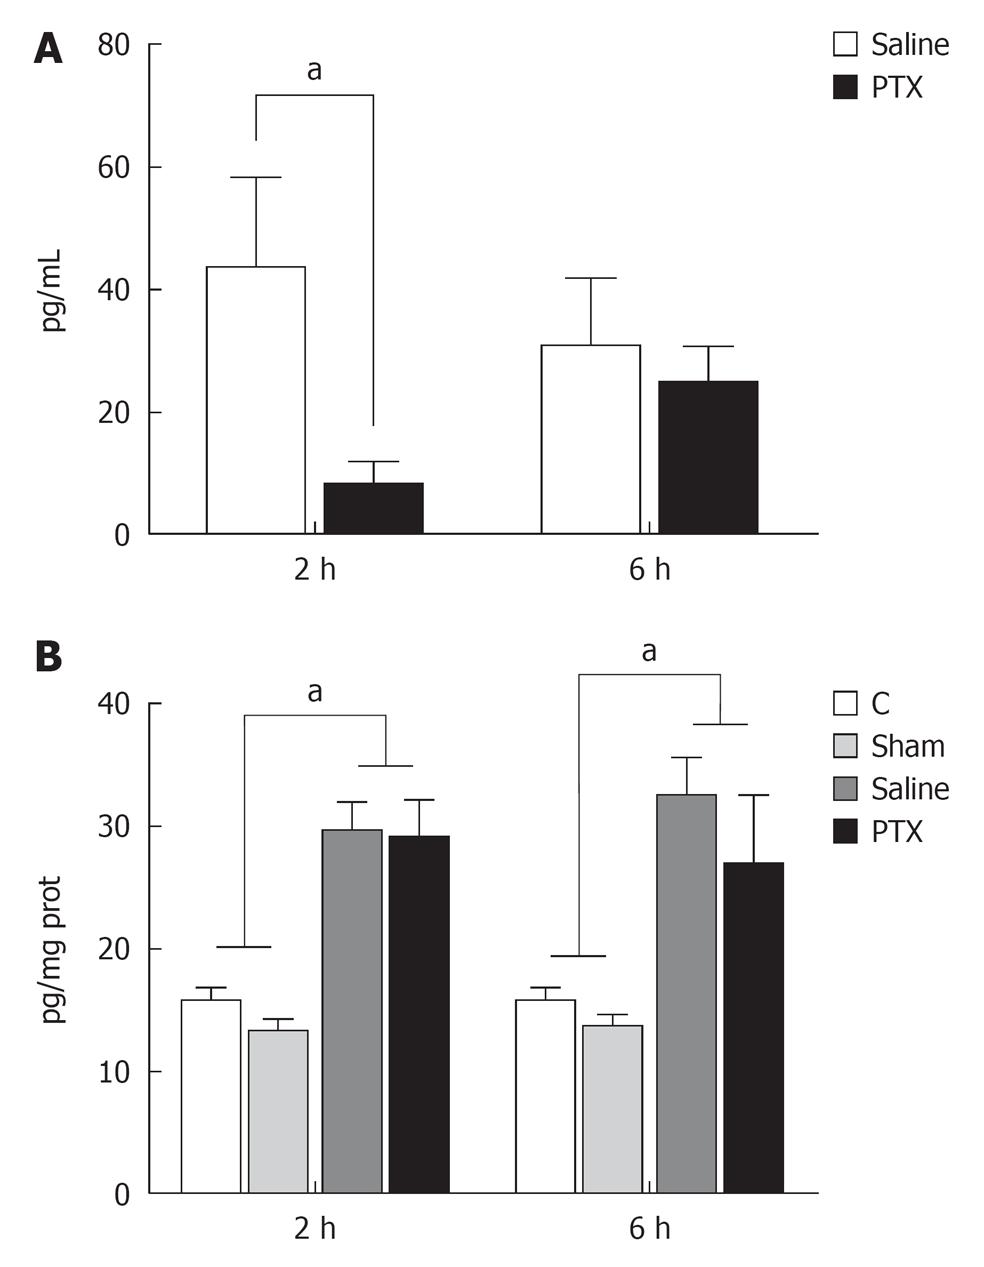
Figure 1 Serum (A) and liver tissue (B) levels of tumor necrosis factor-α after partial hepatectomy at 2 and 6 h.
Group saline and Group pentoxifylline (PTX). Data are presented as mean ± SD of 10 animals per group. aP < 0.05.
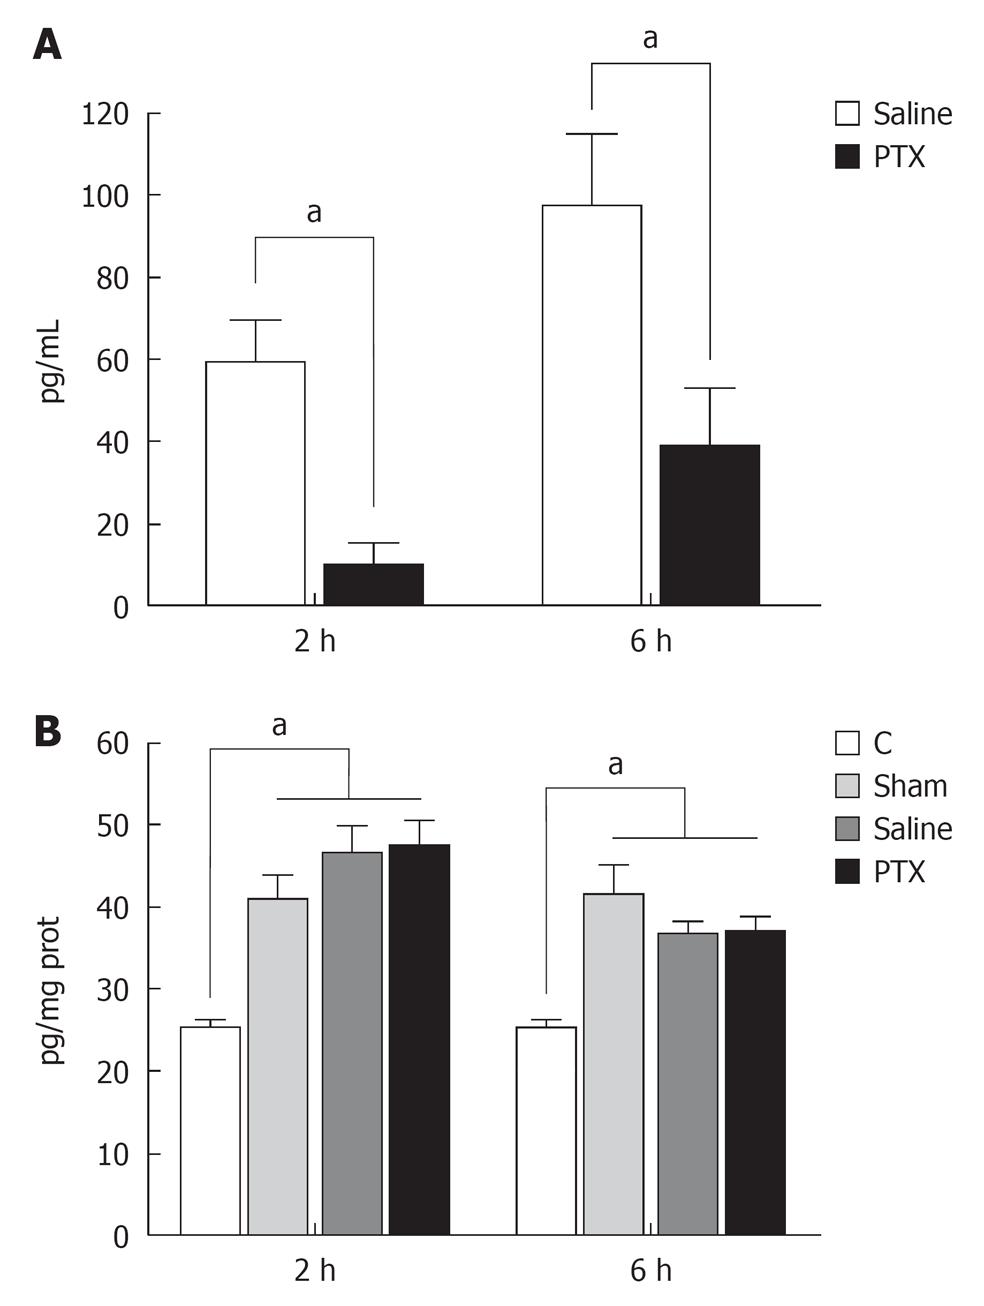
Figure 2 Serum (A) and liver tissue (B) levels of interleukin-6 after partial hepatectomy at 2 and 6 h.
Group saline and Group pentoxifylline (PTX). Data are presented as mean ± SD of 10 animals per group. aP < 0.05.
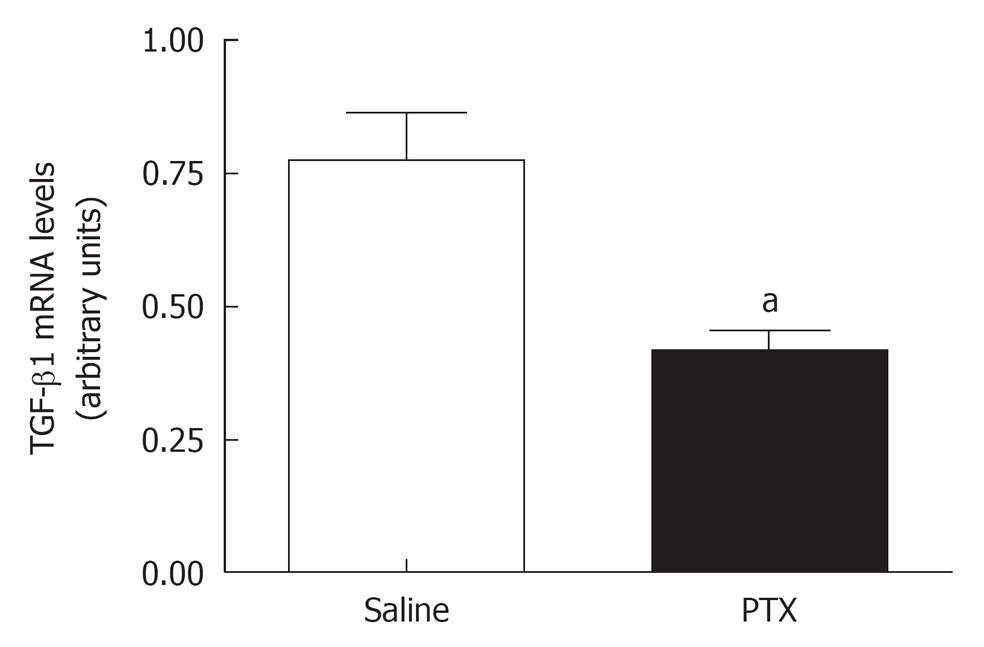
Figure 3 Liver tissue levels of tumor growth factor-β1 mRNA after partial hepatectomy at 2 h.
Group saline and Group pentoxifylline (PTX). Data are presented as mean ± SD of 6 animals per group. aP < 0.05.
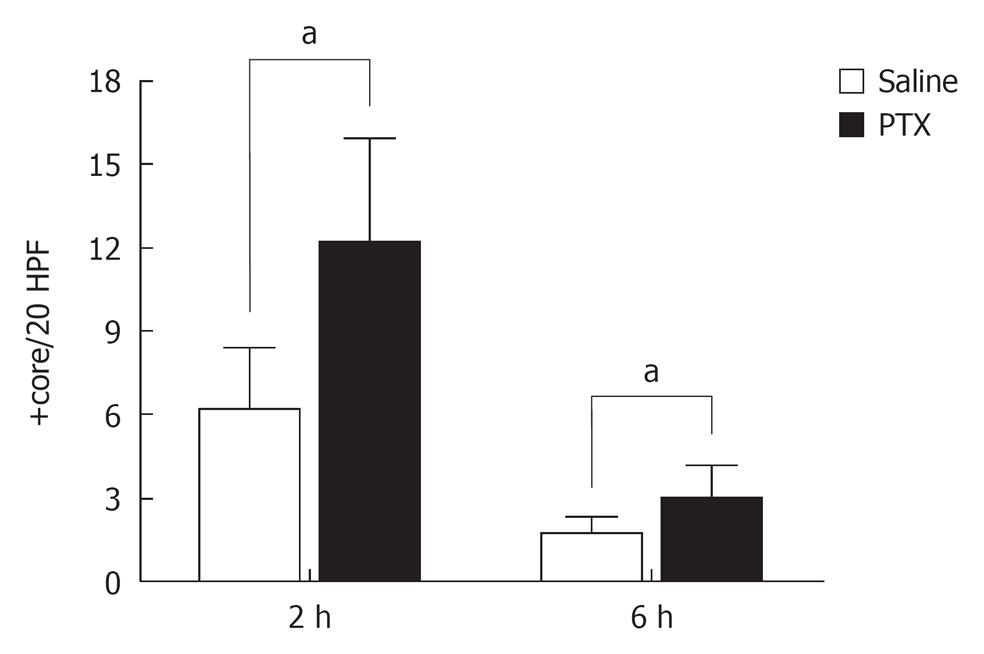
Figure 4 Liver tissue proliferating cell nuclear antigen and mitotic index after partial hepatectomy at 48 h.
Group saline and Group pentoxifylline. Data are presented as mean ± SD of 6 animals per group. aP < 0.05.
- Citation: Martino RB, Coelho AMM, Kubrusly MS, Leitão R, Sampietre SN, Machado MCC, Bacchella T, D’Albuquerque LAC. Pentoxifylline improves liver regeneration through down-regulation of TNF-α synthesis and TGF-β1 gene expression. World J Gastrointest Surg 2012; 4(6): 146-151
- URL: https://www.wjgnet.com/1948-9366/full/v4/i6/146.htm
- DOI: https://dx.doi.org/10.4240/wjgs.v4.i6.146


