Copyright
©2011 Baishideng Publishing Group Co.
World J Gastrointest Surg. Jan 27, 2011; 3(1): 16-20
Published online Jan 27, 2011. doi: 10.4240/wjgs.v3.i1.16
Published online Jan 27, 2011. doi: 10.4240/wjgs.v3.i1.16
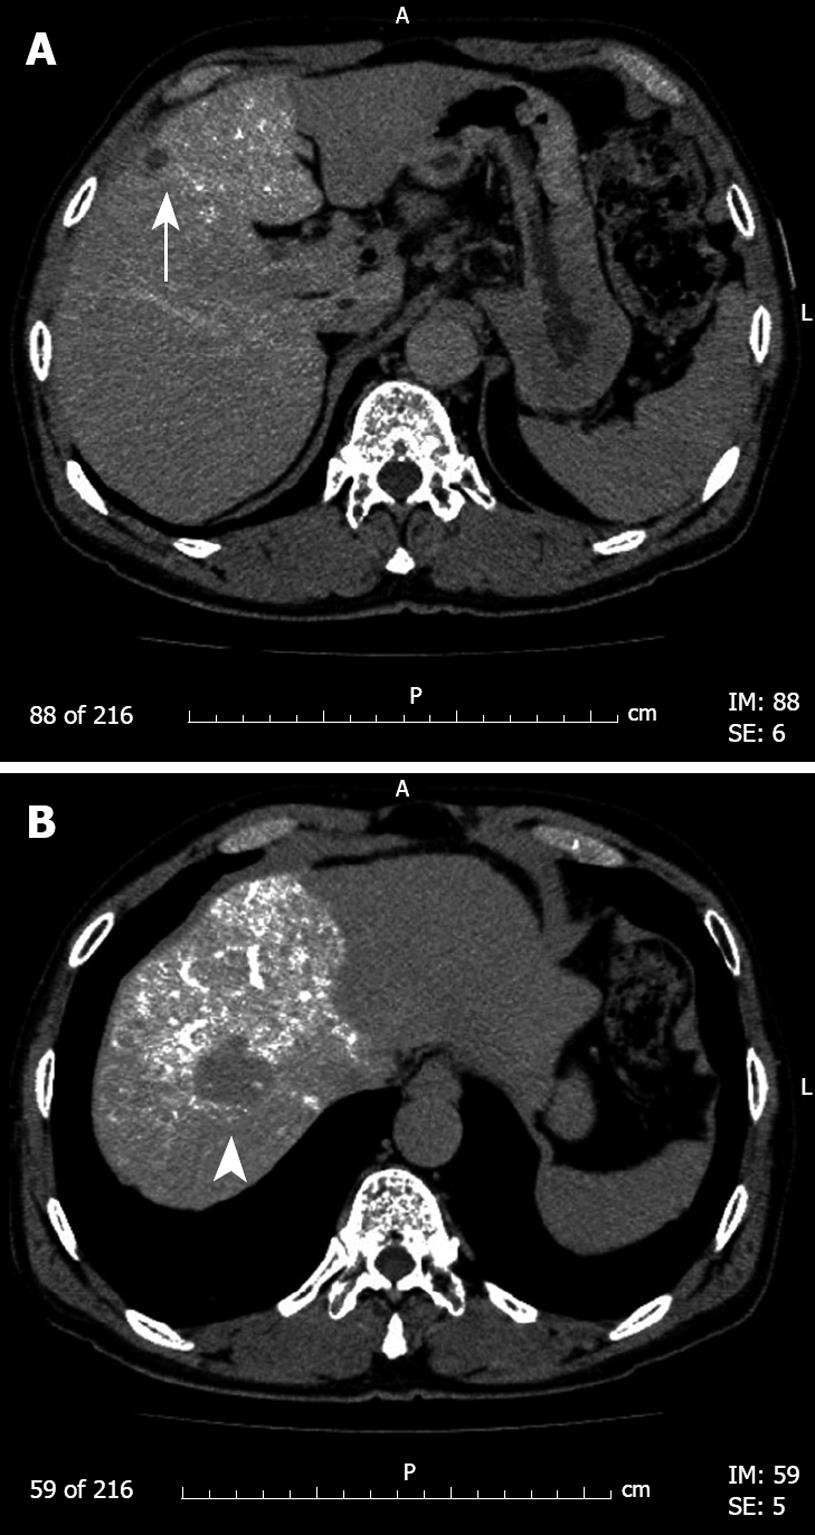
Figure 1 Preoperative abdominal computed tomography during angiography.
This computed tomography reveals low density areas indicating two hepatocellular carcinoma nodules (arrow, arrowhead) of about 1.3 and 3 cm in diameter, in liver segments 8 (A) and 4 (B).
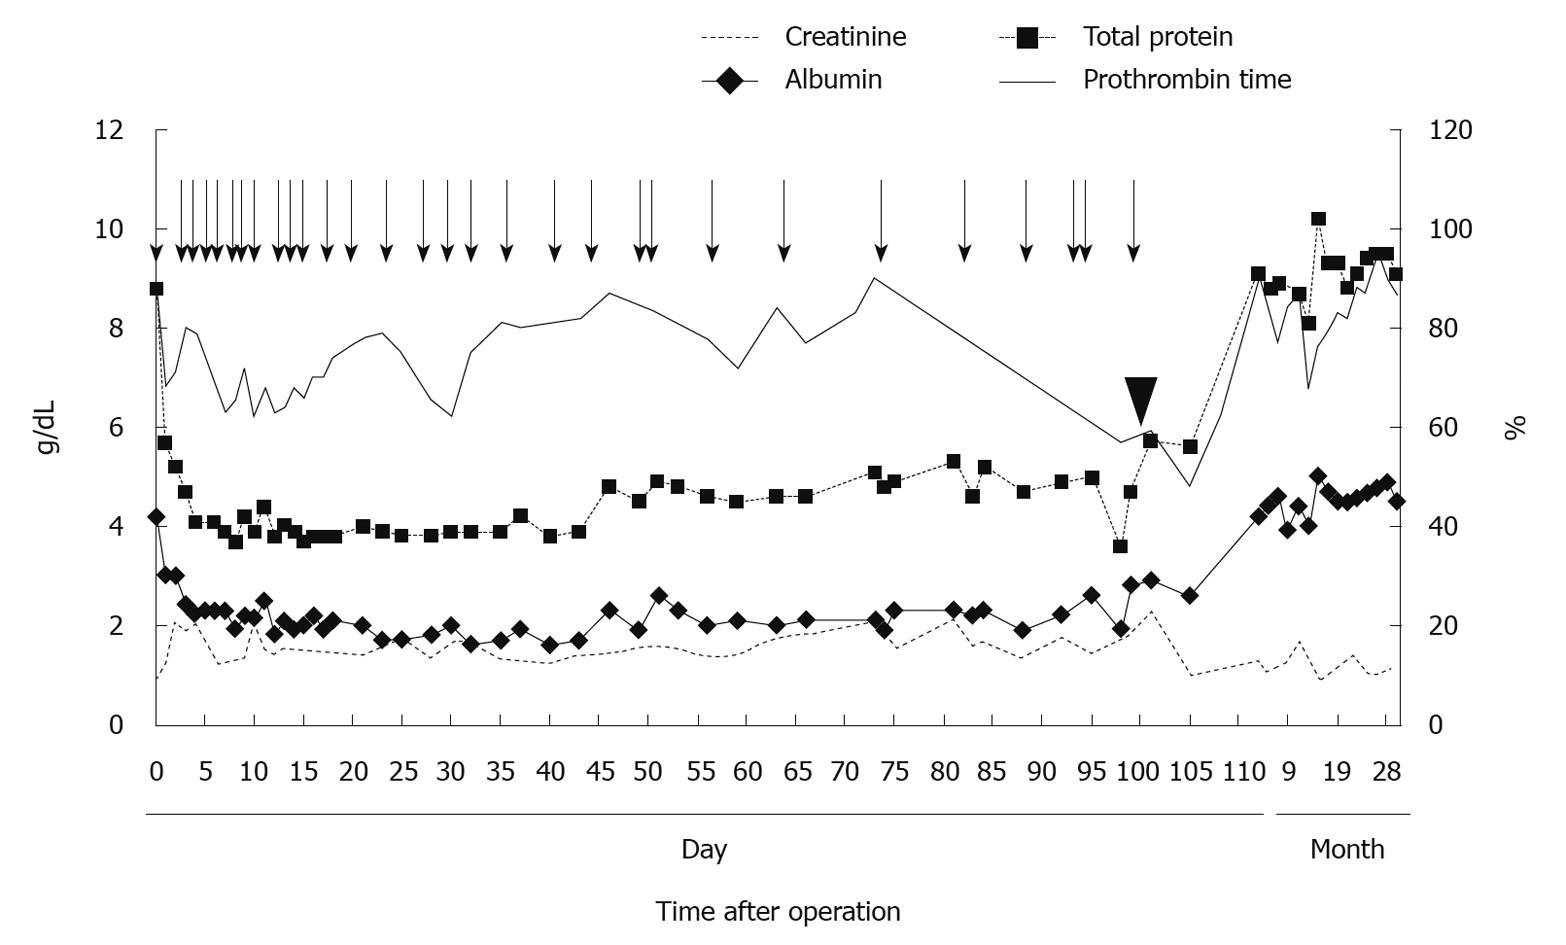
Figure 2 Serial changes in serum prothrombin time (%), creatinine (g/dL), total protein (g/dL), and albumin (g/dL).
The arrow indicates intravenous infusion of 5 g of albumin. The arrowhead indicates the time of the placement of the peritoneovenous shunt (PVS). Note that the PVS placement resulted in dramatic improvement of these parameters which was not attainable by medical treatment.
- Citation: Inoue Y, Hayashi M, Hirokawa F, Takeshita A, Tanigawa N. Peritoneovenous shunt for intractable ascites due to hepatic lymphorrhea after hepatectomy. World J Gastrointest Surg 2011; 3(1): 16-20
- URL: https://www.wjgnet.com/1948-9366/full/v3/i1/16.htm
- DOI: https://dx.doi.org/10.4240/wjgs.v3.i1.16


