Copyright
©2010 Baishideng.
World J Gastrointest Surg. Apr 27, 2010; 2(4): 147-152
Published online Apr 27, 2010. doi: 10.4240/wjgs.v2.i4.147
Published online Apr 27, 2010. doi: 10.4240/wjgs.v2.i4.147
Figure 1 Ultrasonography and computed tomography (CT) of the splenic lesion.
A: Gray-scale ultrasonography shows a homogenous and hypoechoic mass at the mid-portion of the spleen; B: Color Doppler sonography shows multiple color circular flow signals within the mass; C: CT shows a slightly lower-density mass in the spleen (arrows); D: The mass demonstrated strong enhancement after the intravenous administration of contrast material.
Figure 2 Magnetic resonance imaging (MRI) of the splenic lesion.
A: T1-weighted MRI shows the isointense mass (arrows); B: The mass is mildly hyperintense in the T2-weighted MRI; C: The early phase of dynamic MRI shows diffuse heterogeneous enhancement of the mass; D: The mass becomes more enhanced during the delayed phase.
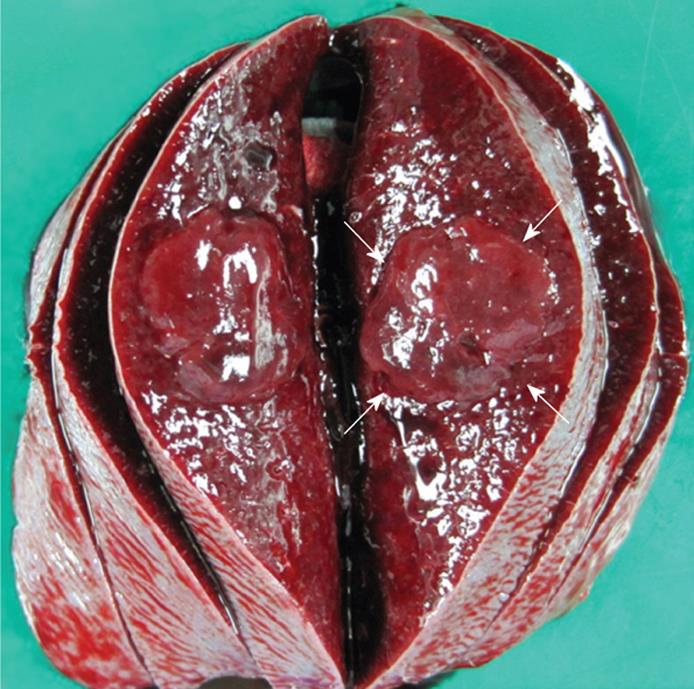
Figure 3 Macroscopic appearance of the resected spleen showing a circumscribed mass measuring 2.
5 cm × 2.4 cm in diameter (arrows).
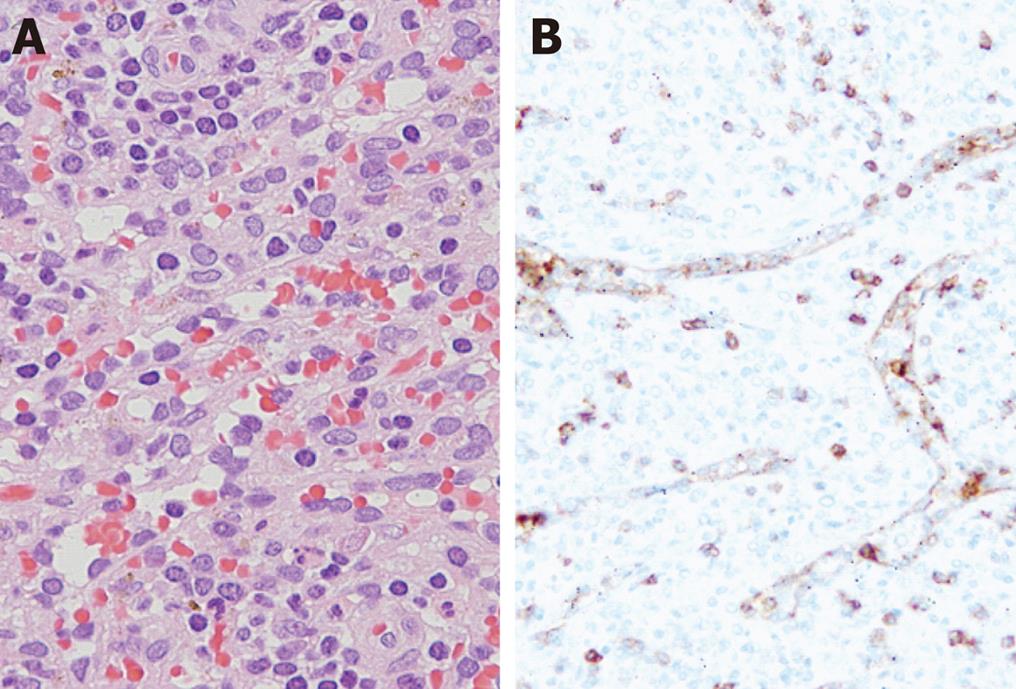
Figure 4 Pathology of the splenic lesion.
A: Microscopically, the mass is composed of predominantly a red pulp splenic sinusoidal structure accompanied by lymphocytes and macrophages. Atypical cells or mitosis were not observed; B: The endothelial cells lining the sinusoidal structure are immunoreactive for CD8.
- Citation: Namikawa T, Kitagawa H, Iwabu J, Kobayashi M, Matsumoto M, Hanazaki K. Laparoscopic splenectomy for splenic hamartoma: Case management and clinical consequences. World J Gastrointest Surg 2010; 2(4): 147-152
- URL: https://www.wjgnet.com/1948-9366/full/v2/i4/147.htm
- DOI: https://dx.doi.org/10.4240/wjgs.v2.i4.147


