Copyright
©The Author(s) 2025.
World J Gastrointest Surg. Aug 27, 2025; 17(8): 109213
Published online Aug 27, 2025. doi: 10.4240/wjgs.v17.i8.109213
Published online Aug 27, 2025. doi: 10.4240/wjgs.v17.i8.109213
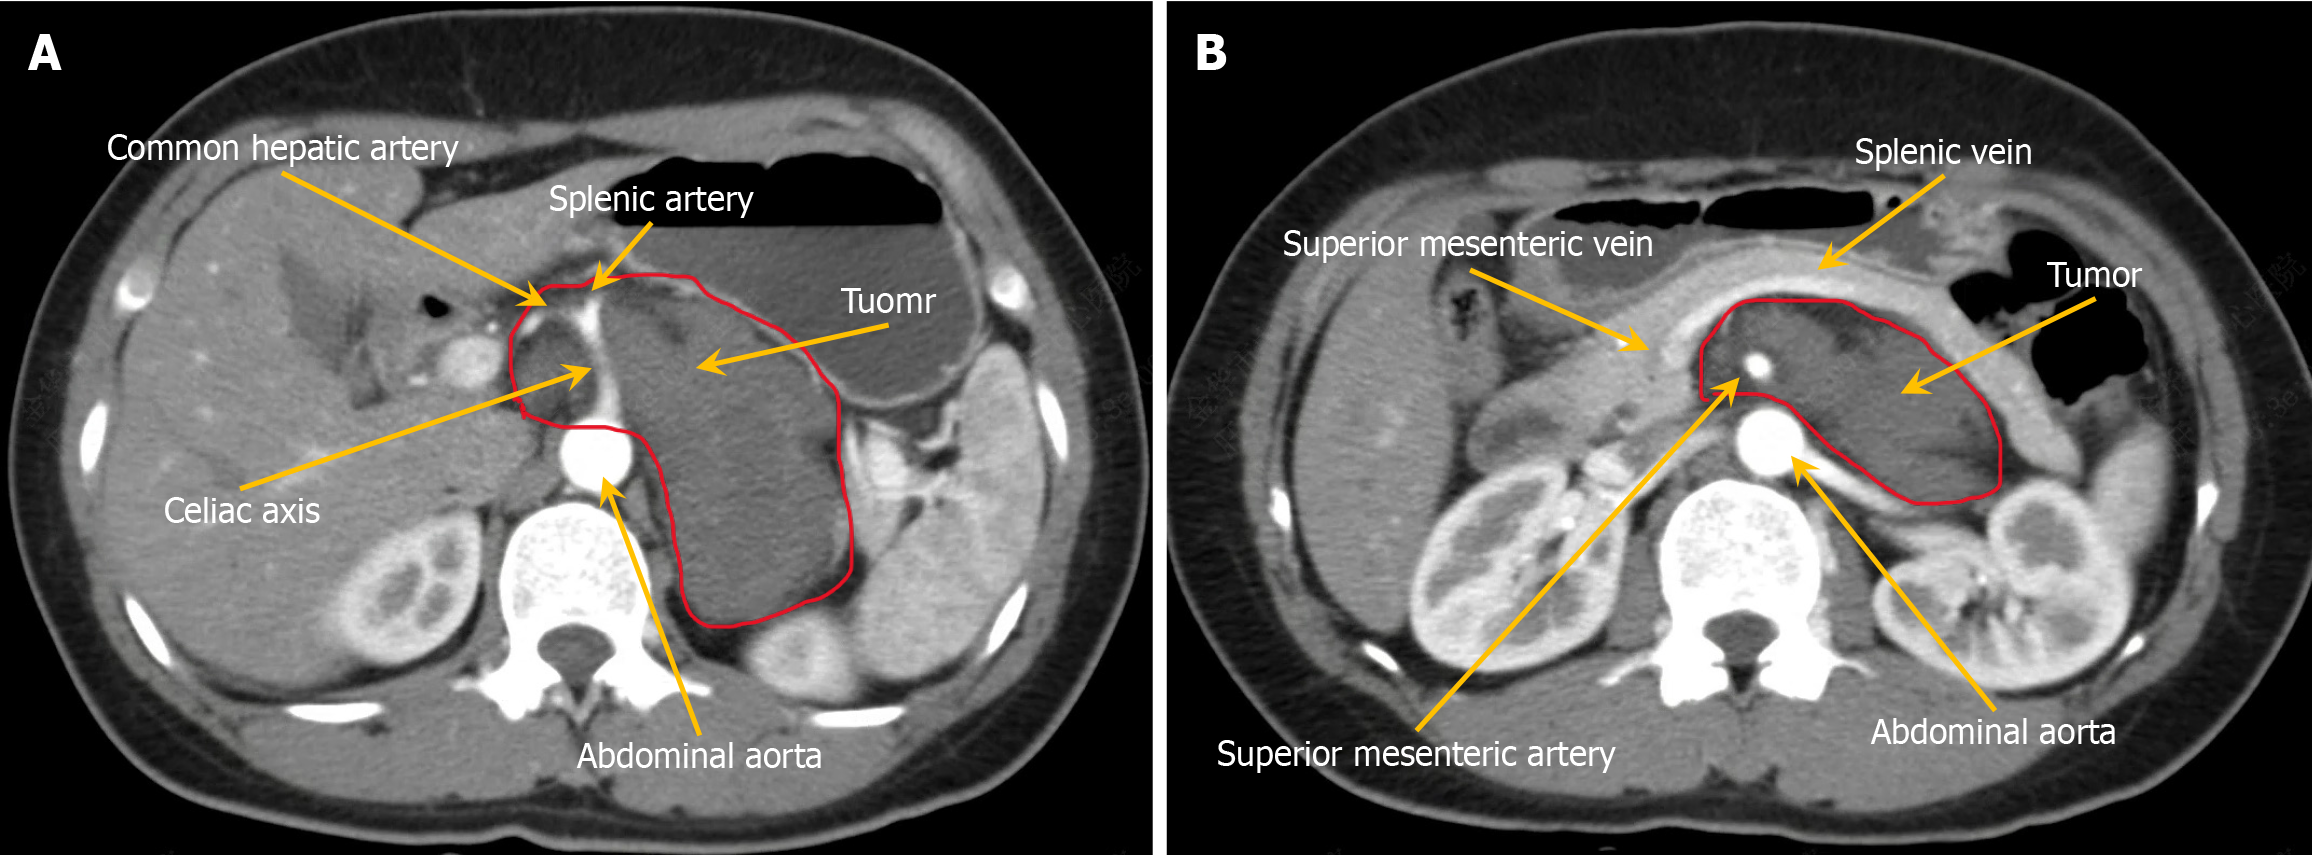
Figure 1 Enhanced computed tomography scan depicting a tumor located posterior to the pancreas and adjacent to the hepatic portal vein with progressive enhancement.
The maximum cross-sectional dimensions of the tumor are approximately 8.5 cm × 5 cm. A: The tumor completely encases the celiac axis, common hepatic artery, and splenic artery and is closely adjacent to the abdominal aorta; however, no notable luminal stenosis is observed in these vessels; B: The tumor completely encases the superior mesenteric artery and is closely associated with the superior mesenteric, splenic, and left renal veins. Arrow: Correspondingly mark the blood vessels or tumors; Red line: The boundary of the tumor.
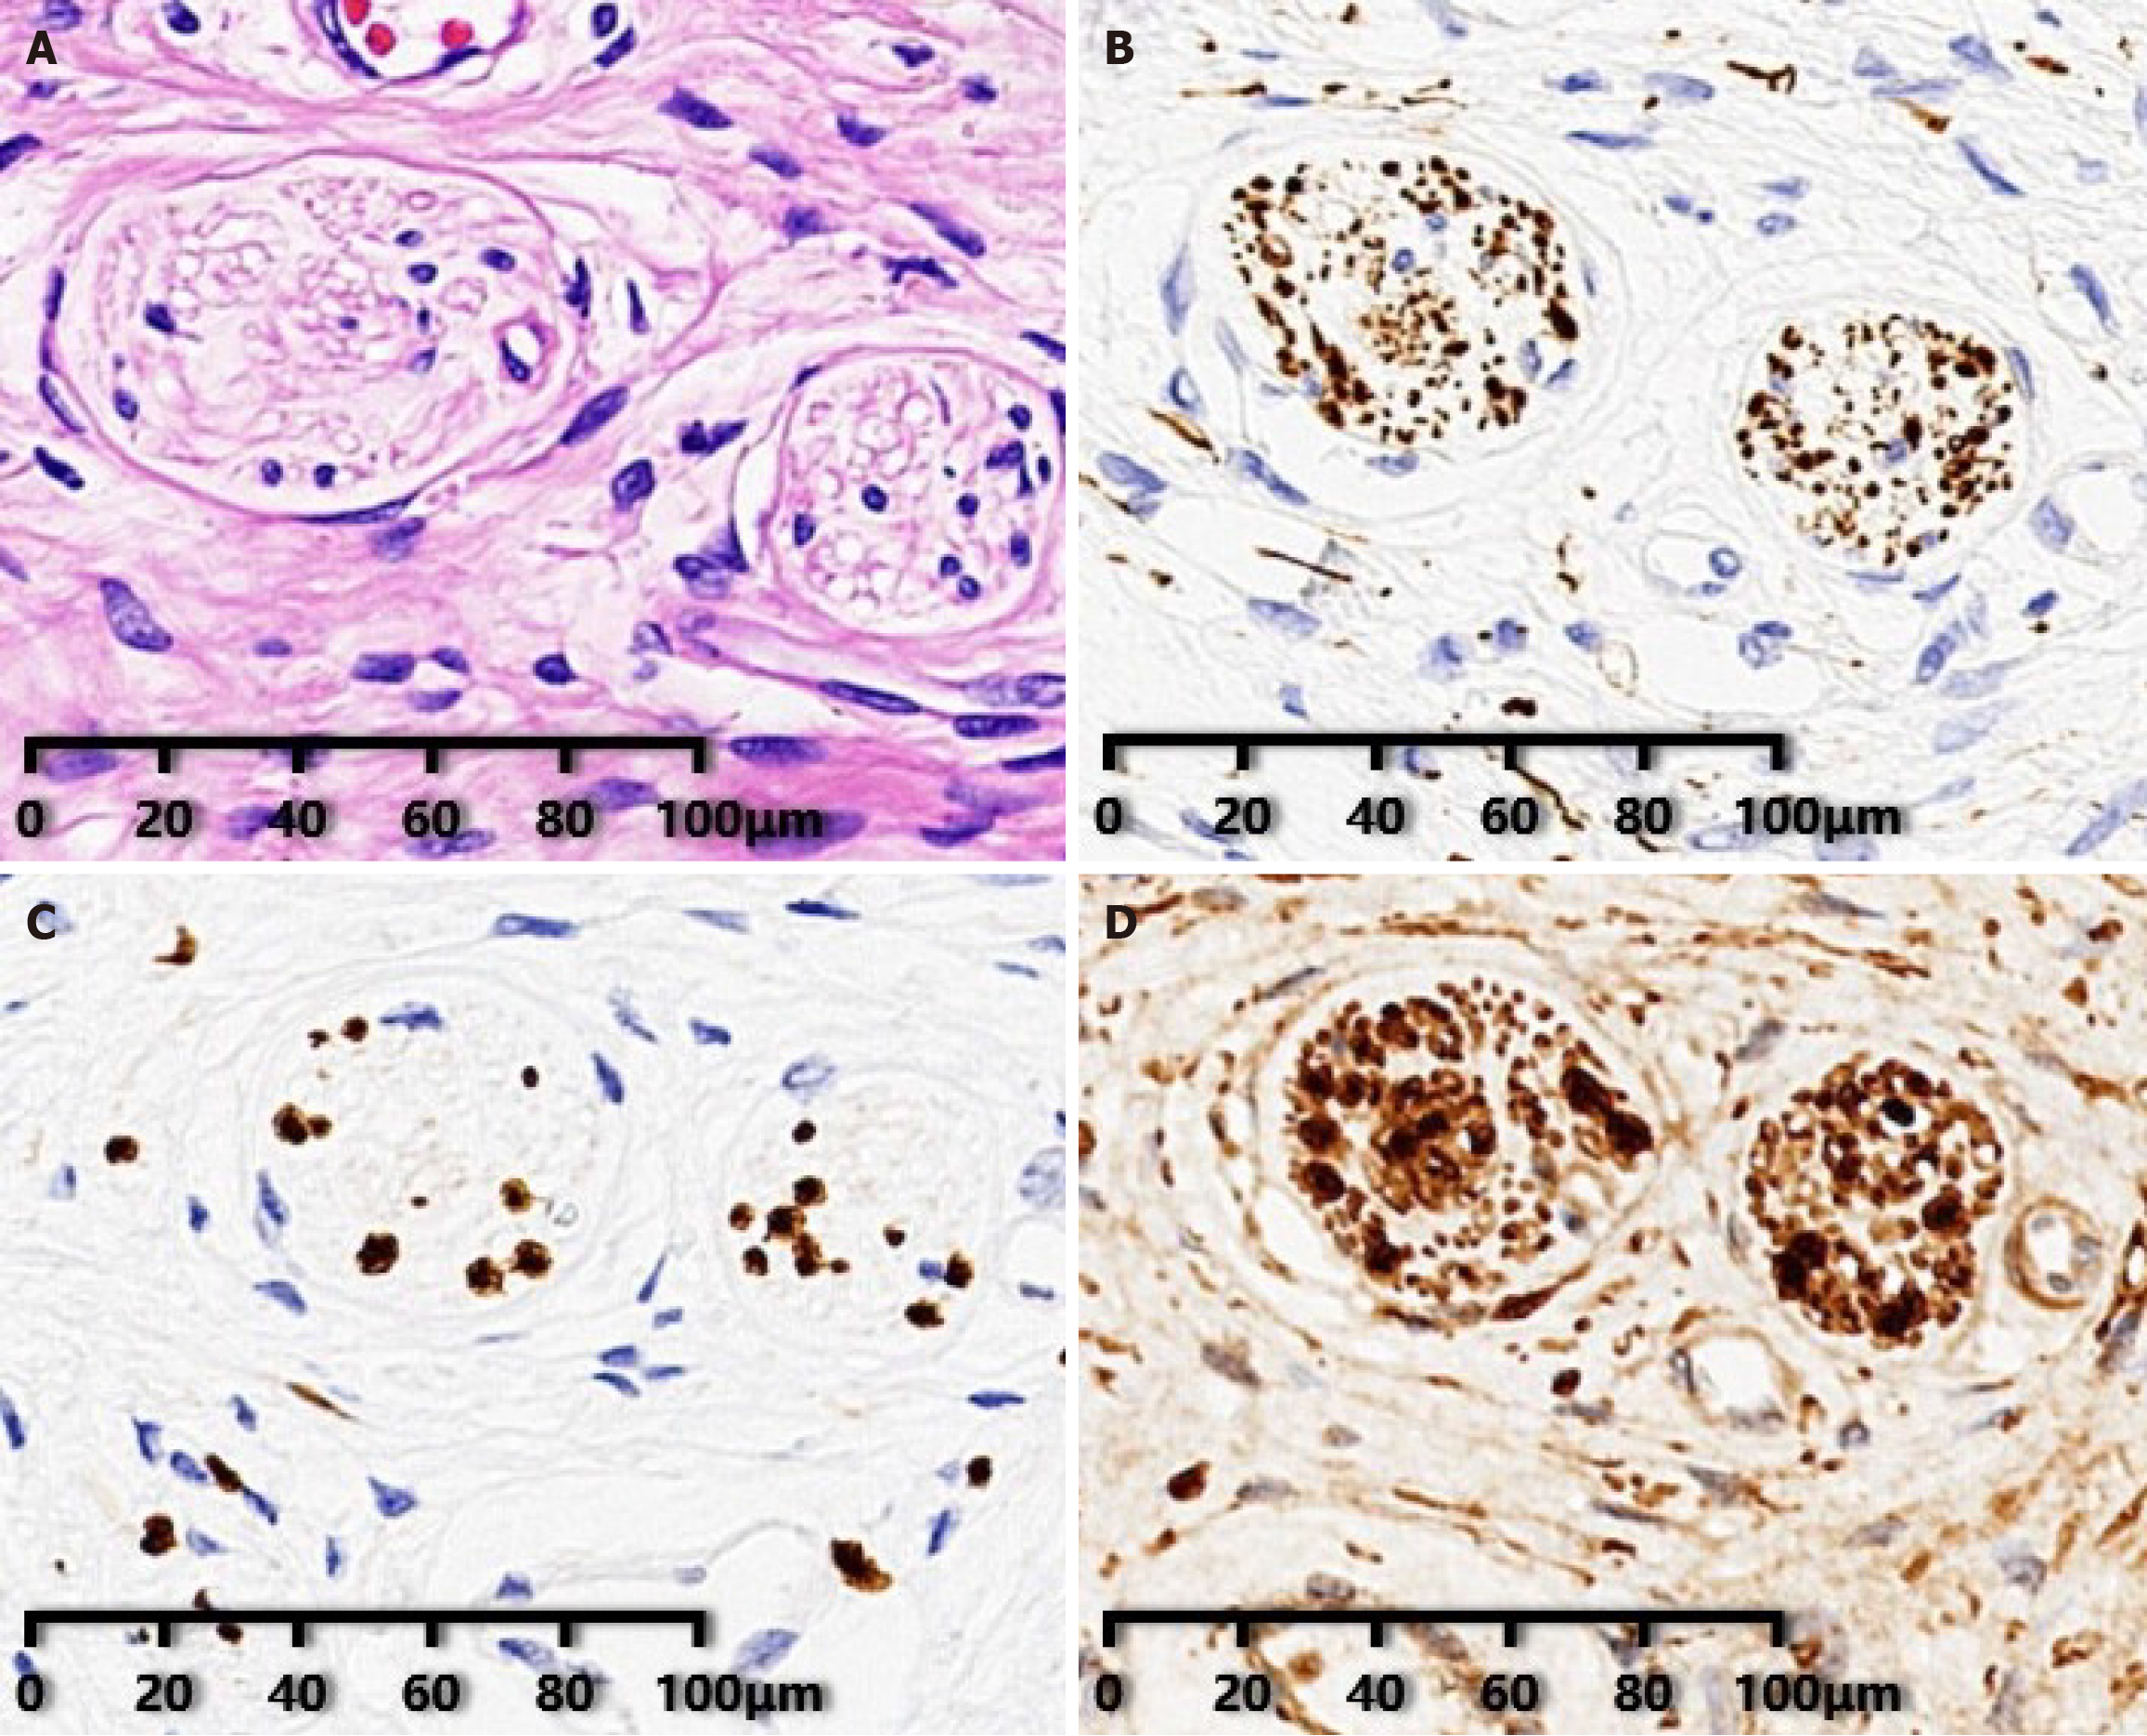
Figure 2 Hematoxylin-eosin staining and immunohistochemical results.
A: Hematoxylin-eosin staining of the ganglioneuroma (magnification: × 200); B-D: Immunohistochemical staining demonstrates that the tumor cells are positive for neurofilament, SRY-related HMG-box 10 protein, and S-100 protein (magnification: × 200).
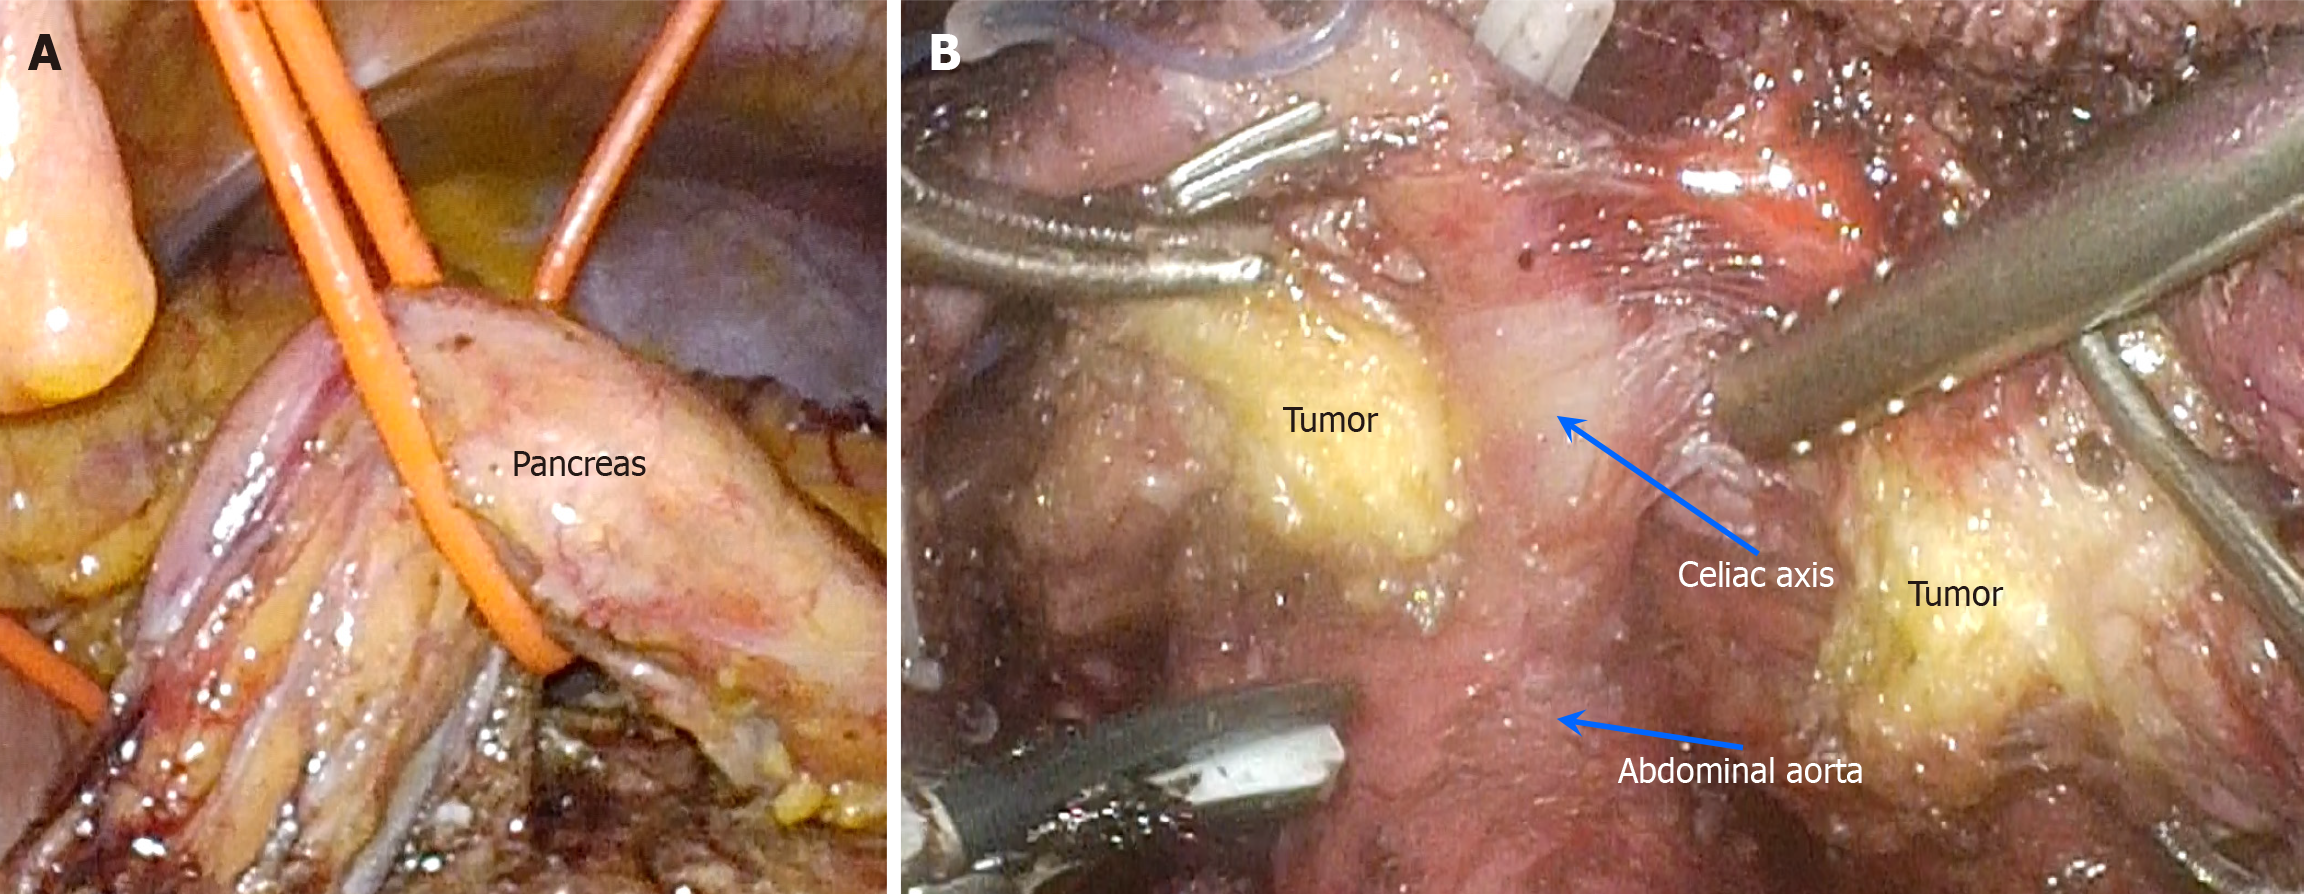
Figure 3 Intraoperative images.
A: A 10-Fr red rubber urinary catheter was passed beneath the pancreas and suspended from the abdominal wall, effectively exposing the retroperitoneal space; B: An ultrasonic scalpel was used to incise the tumor along the vascular axis, thereby exposing the celiac axis. The vascular wall remained intact without evidence of tumor cell infiltration or encroachment. Arrow: Correspondingly mark the blood vessels.
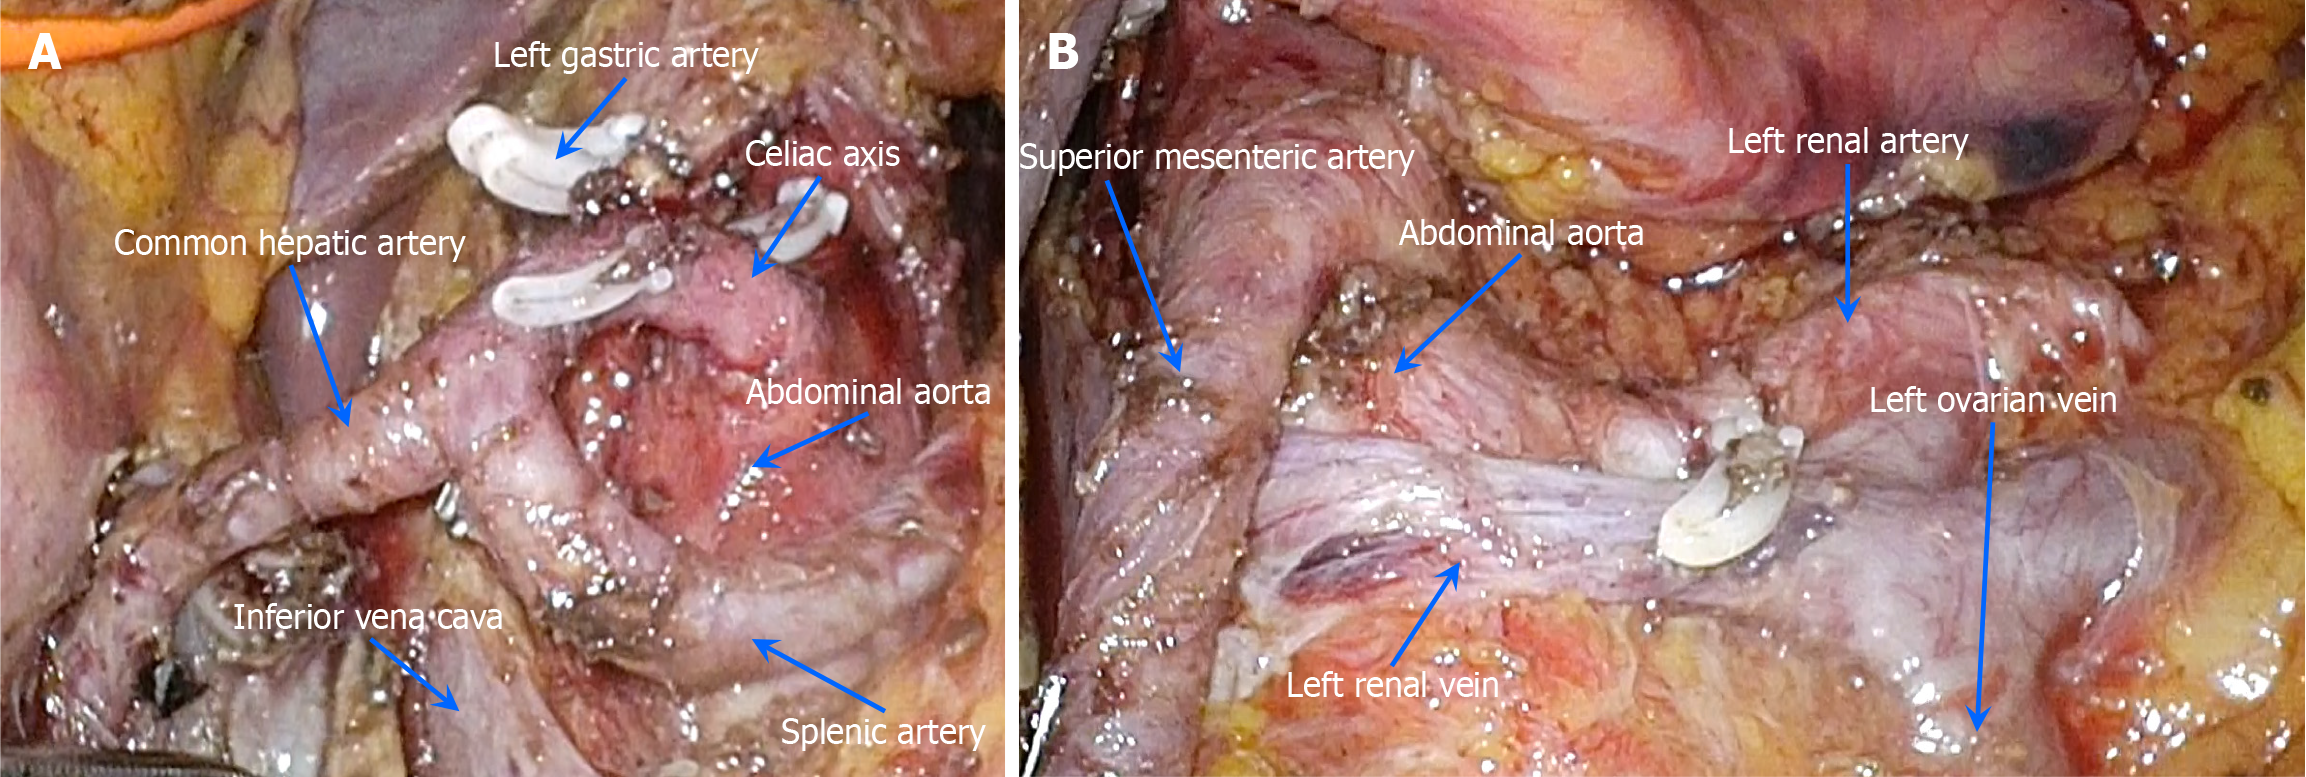
Figure 4 Postoperative images.
A: The left gastric artery was excised. After tumor removal, the celiac axis, common hepatic artery, splenic artery, abdominal aorta, and inferior vena cava were clearly visible in the images; B: Following tumor excision, the superior mesenteric artery, abdominal aorta, left renal vein, left renal artery, and left ovarian vein were distinctly depicted. All vital abdominal blood vessels were successfully preserved. Arrow: Correspondingly mark the blood vessels.
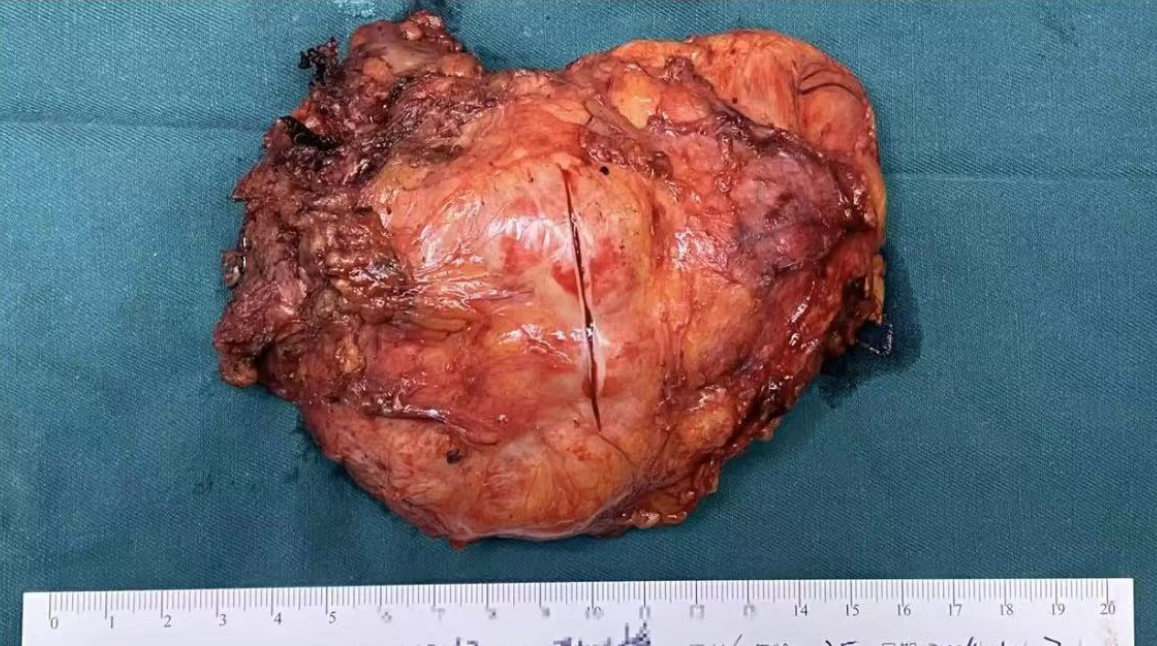
Figure 5 Surgical specimen following resection.
The tumor had a capsule on its surface and exhibited a light yellow color. As measured by postoperative pathology, the tumor size was approximately 6 cm × 9 cm × 14 cm.
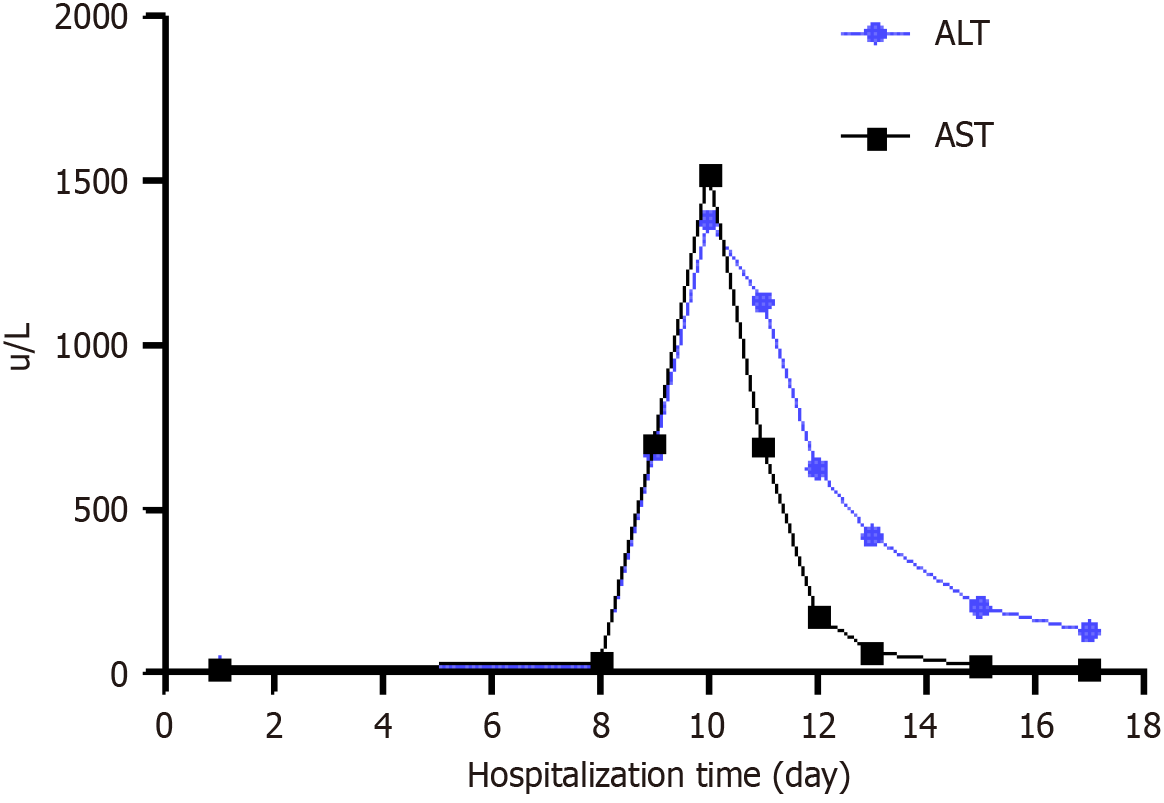
Figure 6 Changes in transaminase levels during hospitalization.
The black line represents aspartate aminotransferase, whereas the blue line denotes alanine aminotransferase. Surgery was performed on day nine of hospitalization. On the day of operation, the levels of both transaminases dramatically increased, peaking on the second postoperative day. Afterward, the levels gradually declined, approaching the normal range by the time of discharge. ALT: Alanine aminotransferase; AST: Aspartate aminotransferase.
- Citation: Wu GZ, Fang SZ, Yu SA, Yu M. Resection of a ganglioneuroma encasing major blood vessels using three-dimensional laparoscopy combined with organ suspension: A case report. World J Gastrointest Surg 2025; 17(8): 109213
- URL: https://www.wjgnet.com/1948-9366/full/v17/i8/109213.htm
- DOI: https://dx.doi.org/10.4240/wjgs.v17.i8.109213


