Copyright
©The Author(s) 2025.
World J Gastrointest Surg. Aug 27, 2025; 17(8): 108959
Published online Aug 27, 2025. doi: 10.4240/wjgs.v17.i8.108959
Published online Aug 27, 2025. doi: 10.4240/wjgs.v17.i8.108959
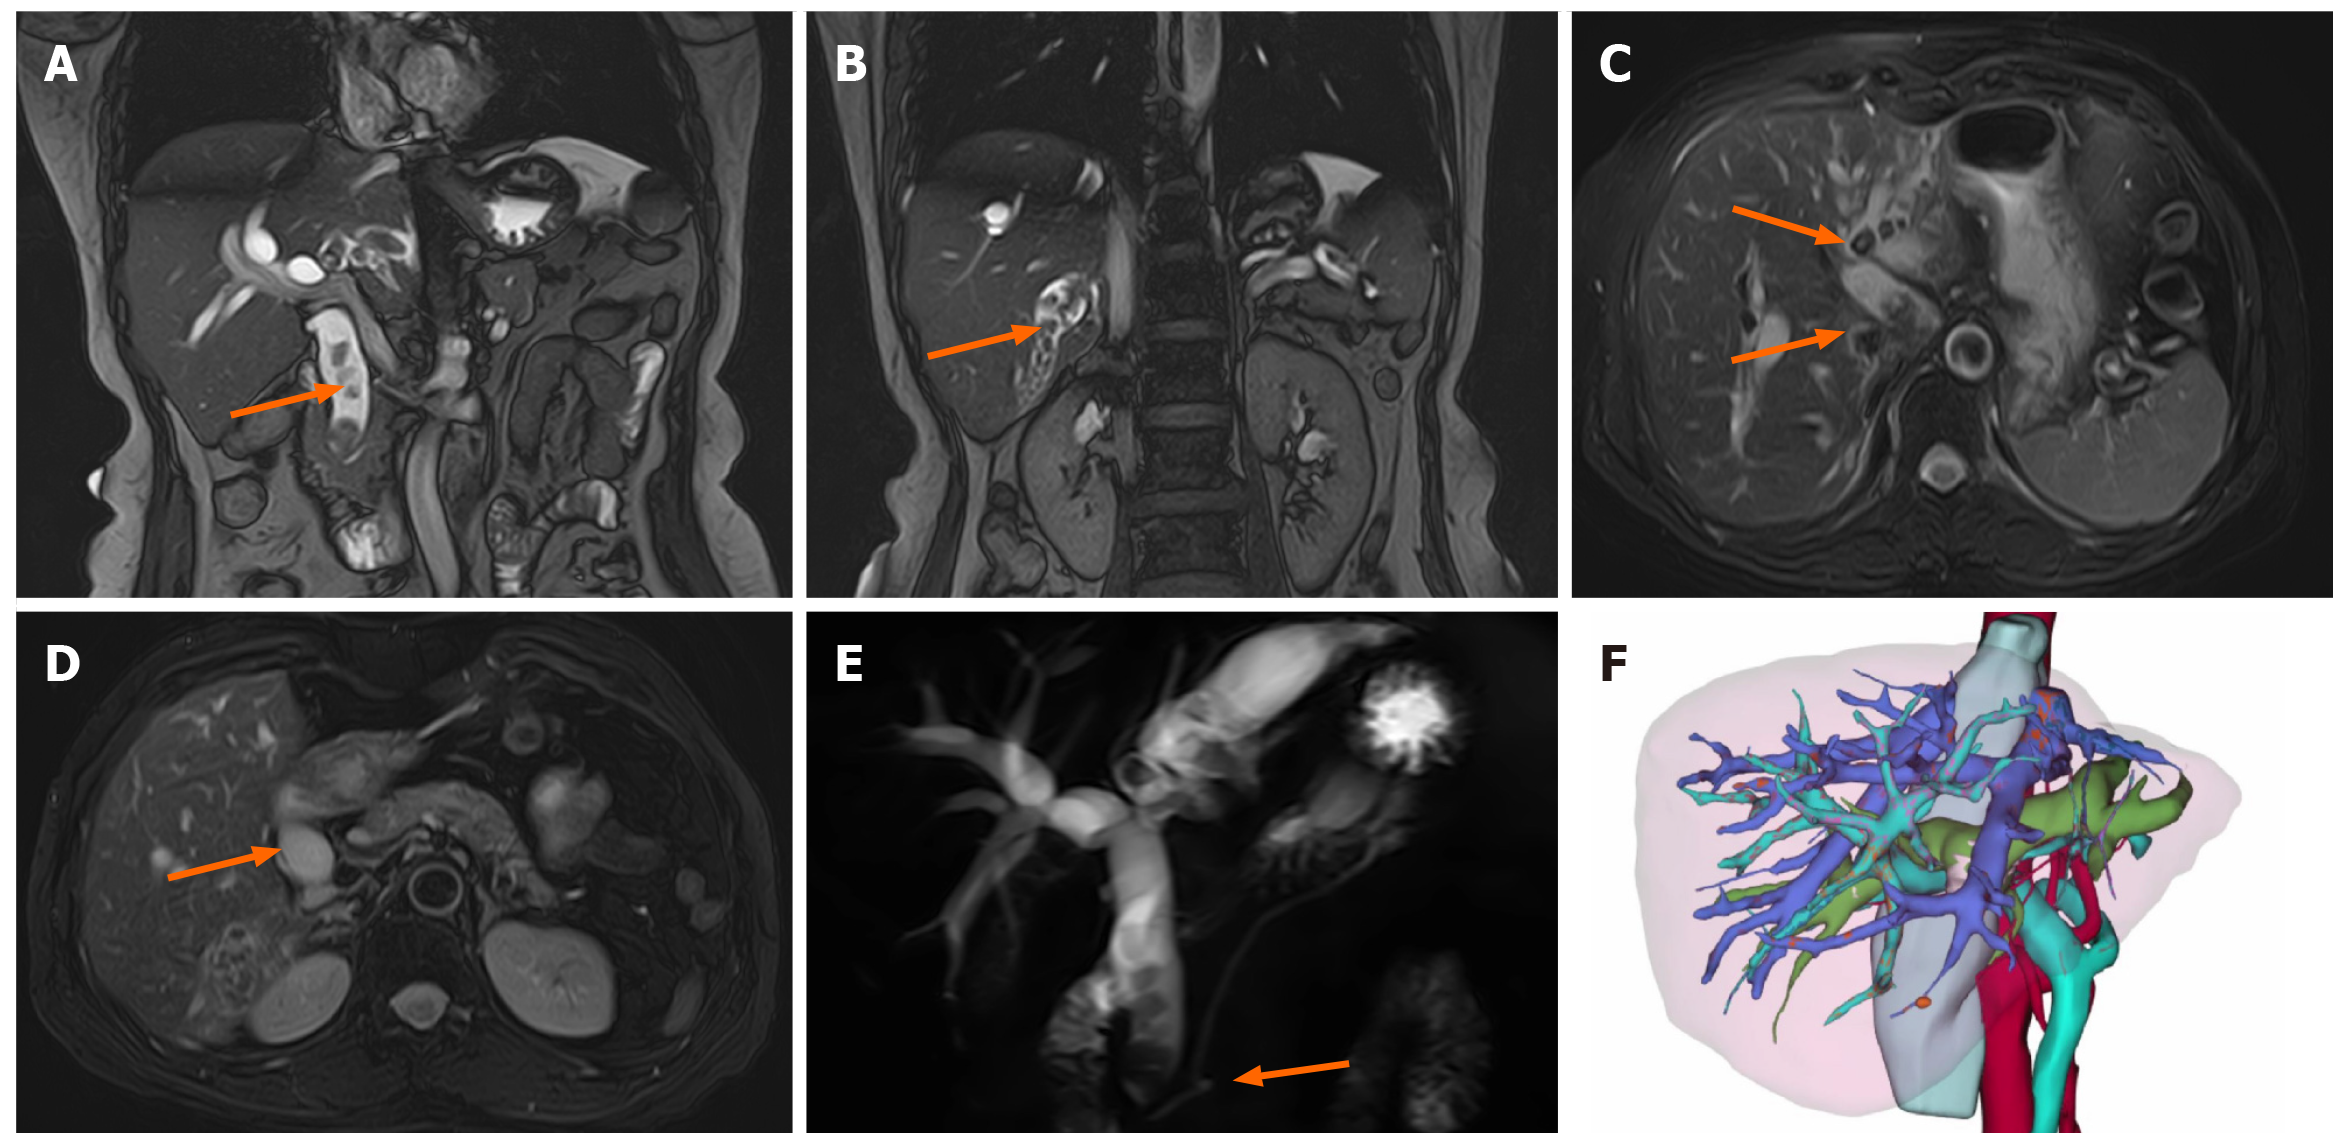
Figure 1 Schematic diagram of enhanced magnetic resonance imaging, and 3D reconstruction results before surgery.
A-C: Coronal and axial magnetic resonance imaging views showing the distribution of the lesion; D: Axial magnetic resonance image revealing dilated bile ducts; E: Magnetic resonance cholangiopancreatography clearly delineates the affected bile ducts and pancreatic ducts; F: 3D reconstruction model demonstrating the spatial relationships of intrahepatic vasculature from multiple perspectives, with volumetric analysis of the future liver remnant.
Figure 2 Schematic diagram of the pathological results of the lesions after surgery.
A: Gross images of the surgery specimen; B and C: Light microscopic images of the surgery specimen with the following results: Chronic inflammation of the intrahepatic bile ducts with lithiasis, focal low-grade intraepithelial neoplasia of the glandular epithelium, and clustered proliferation of peripheral small bile ducts; chronic inflammation of the extrahepatic bile ducts with acute suppurative inflammation and cystic dilatation, accompanied by focal epithelial atypia.
Figure 3 Intraoperative images during the operation.
A: Adhesiolysis and mobilization of the extrahepatic bile duct; B: Cystic dilatation of the extrahepatic bile duct was identified. Choledochotomy was performed, followed by choledochoscopic exploration, stone extraction, and assessment of the duodenal papilla; C: Resection of the dilated bile duct; D: Intermittent occlusion of the right anterior pedicle; E: Hepatic transection guided by the pathological bile ducts and hepatic veins; F: Opening of the hilar bile ducts with complete stone clearance; G: Repeat choledochoscopic exploration of the right anterior sectoral bile ducts; H: Hepa
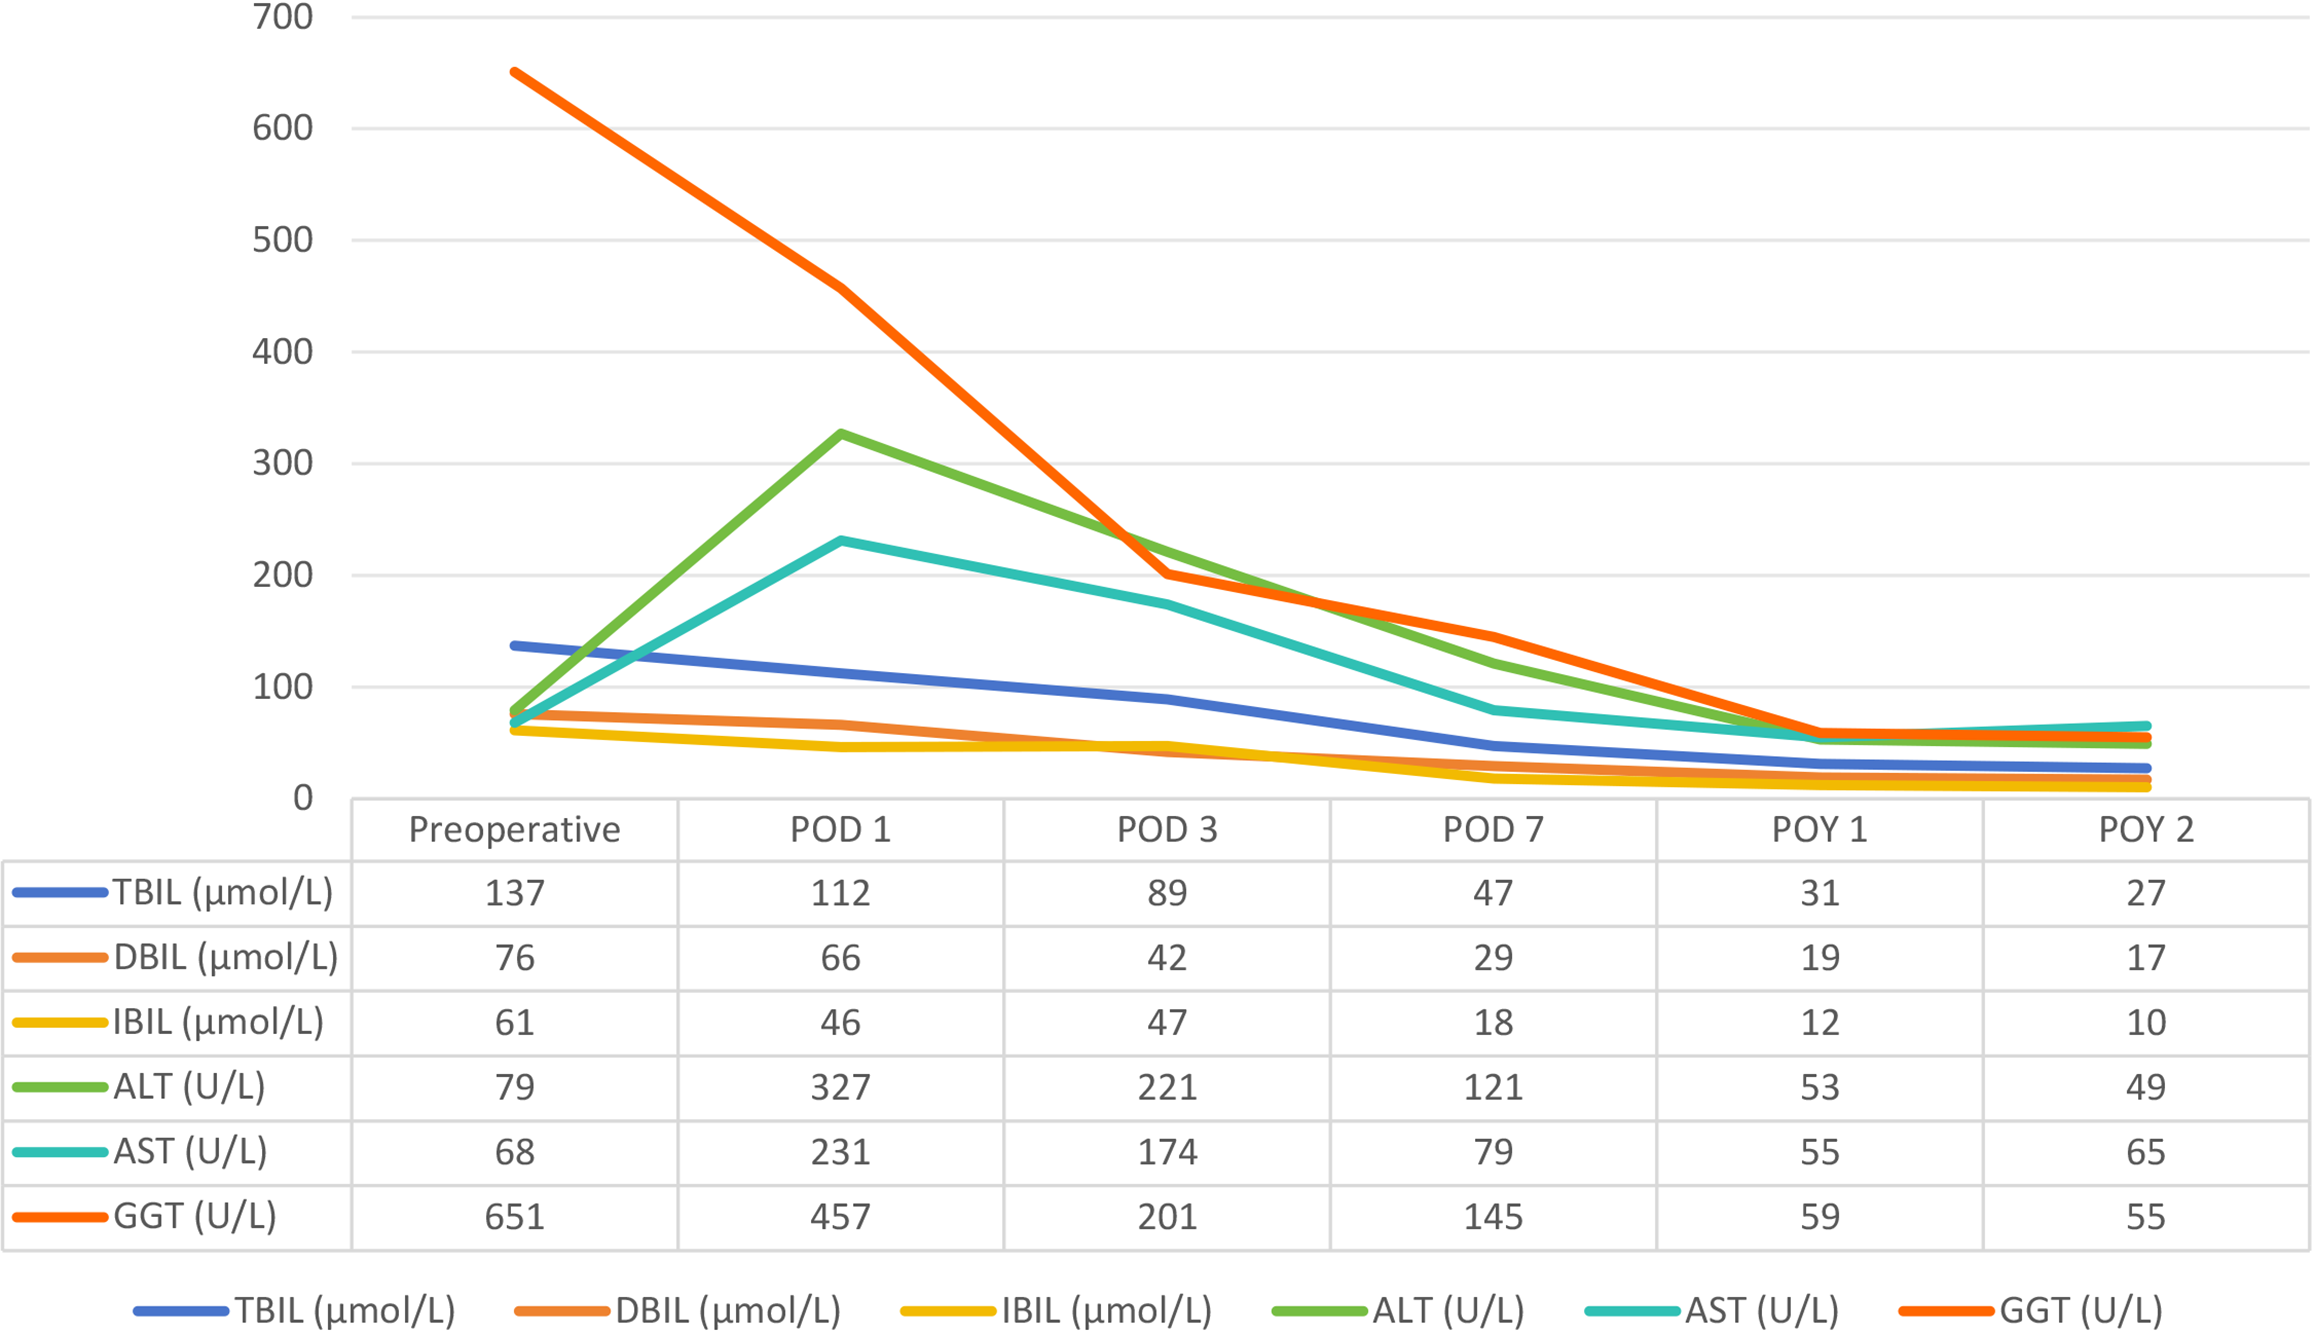
Figure 4 Schematic diagram of the trends in liver function-related indices during follow-up of the disease course.
TBIL: Total bilirubin; DBIL: Direct bilirubin; IBIL: Indirect bilirubin; ALT: Alanine aminotransferase; AST: Aspartate aminotransferase; GGT: Gamma-glutamyl transferase; POD 1: Postoperative day 1; POD 3: Postoperative day 3; POD 7: Postoperative day 7; POY 1: Postoperative year 1; POY 2: Postoperative year 2.
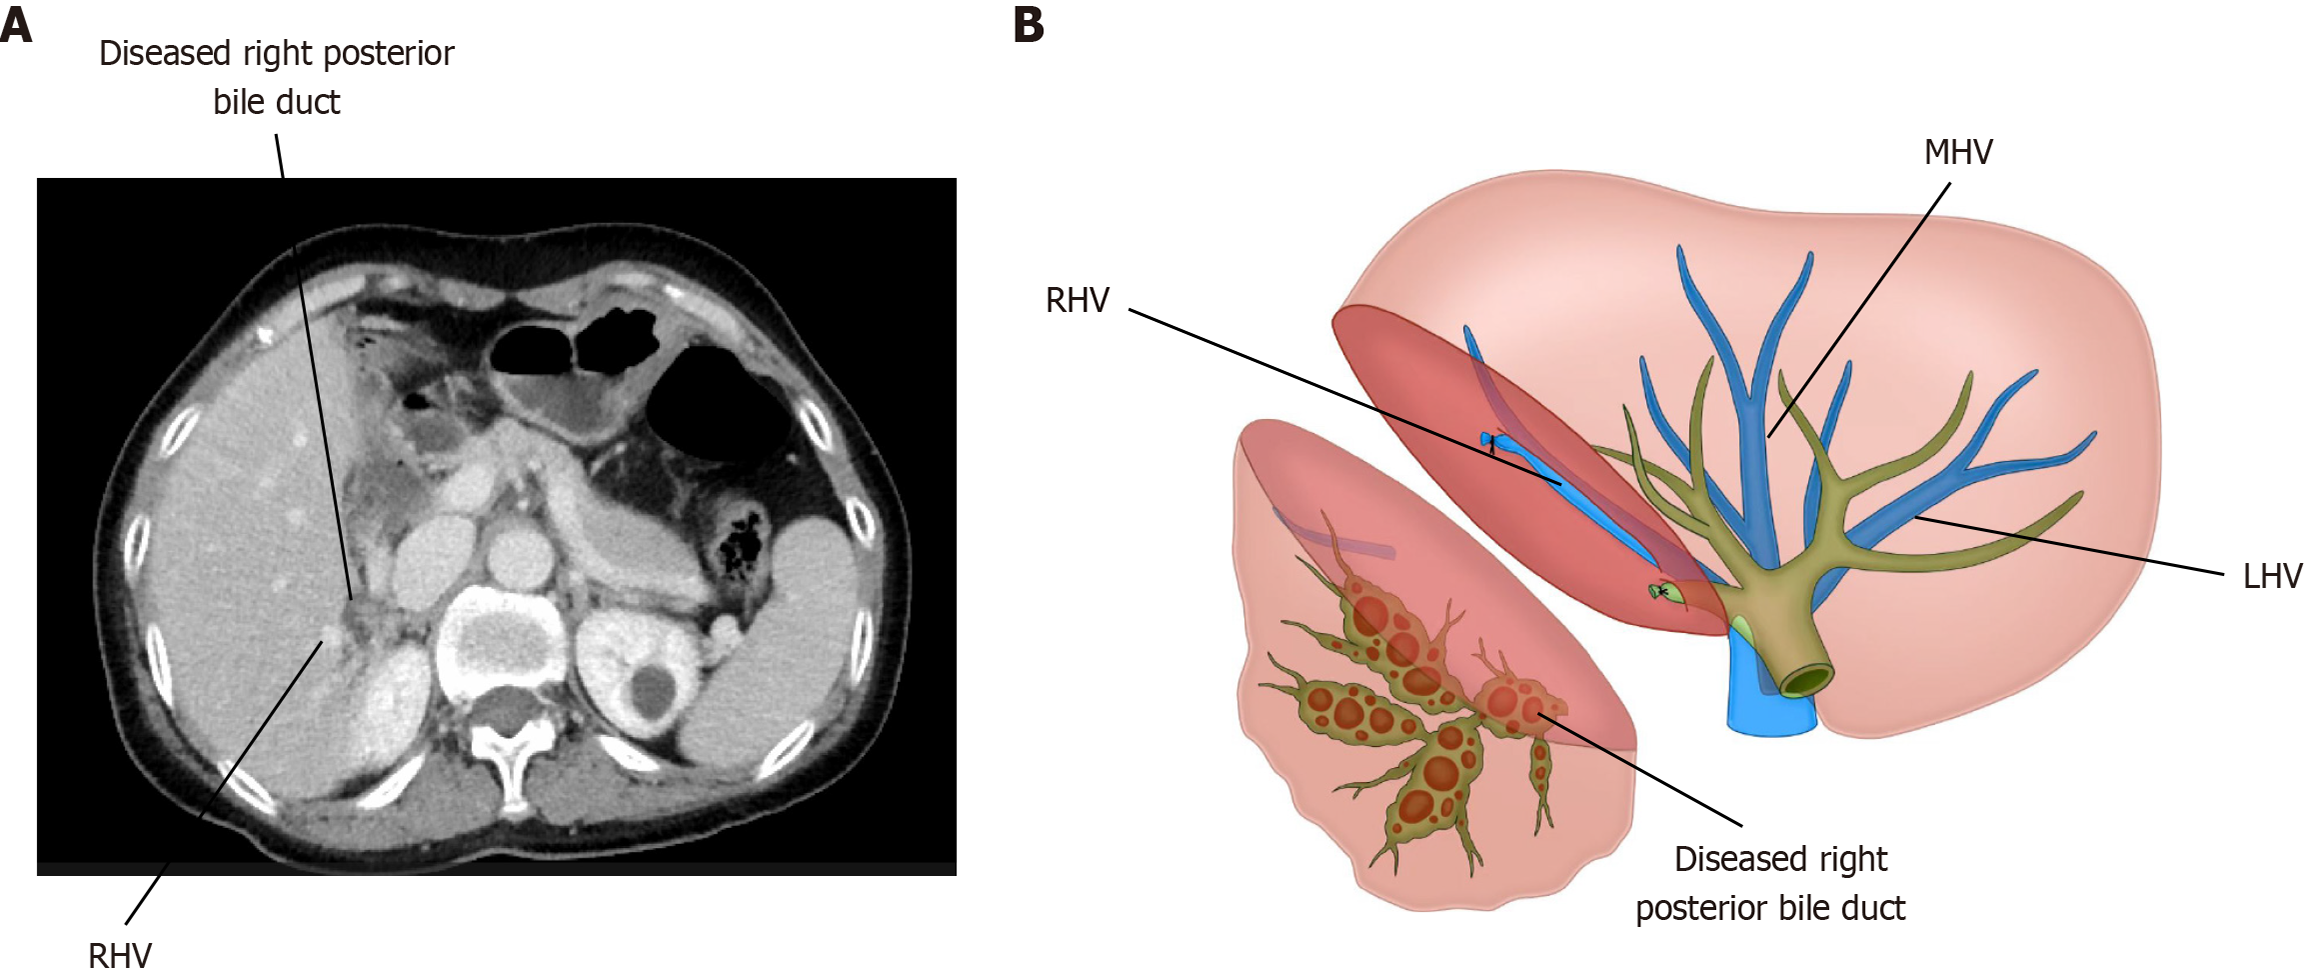
Figure 5 Diagram of the lesion bile duct.
A: Dilated bile ducts and stones, which are often close to the iconic hepatic veins; B: Hepatectomy was performed along the double markers of diseased bile duct and hepatic vein. MHV: Middle hepatic vein; LHV: Left hepatic vein; RHV: Right hepatic vein.
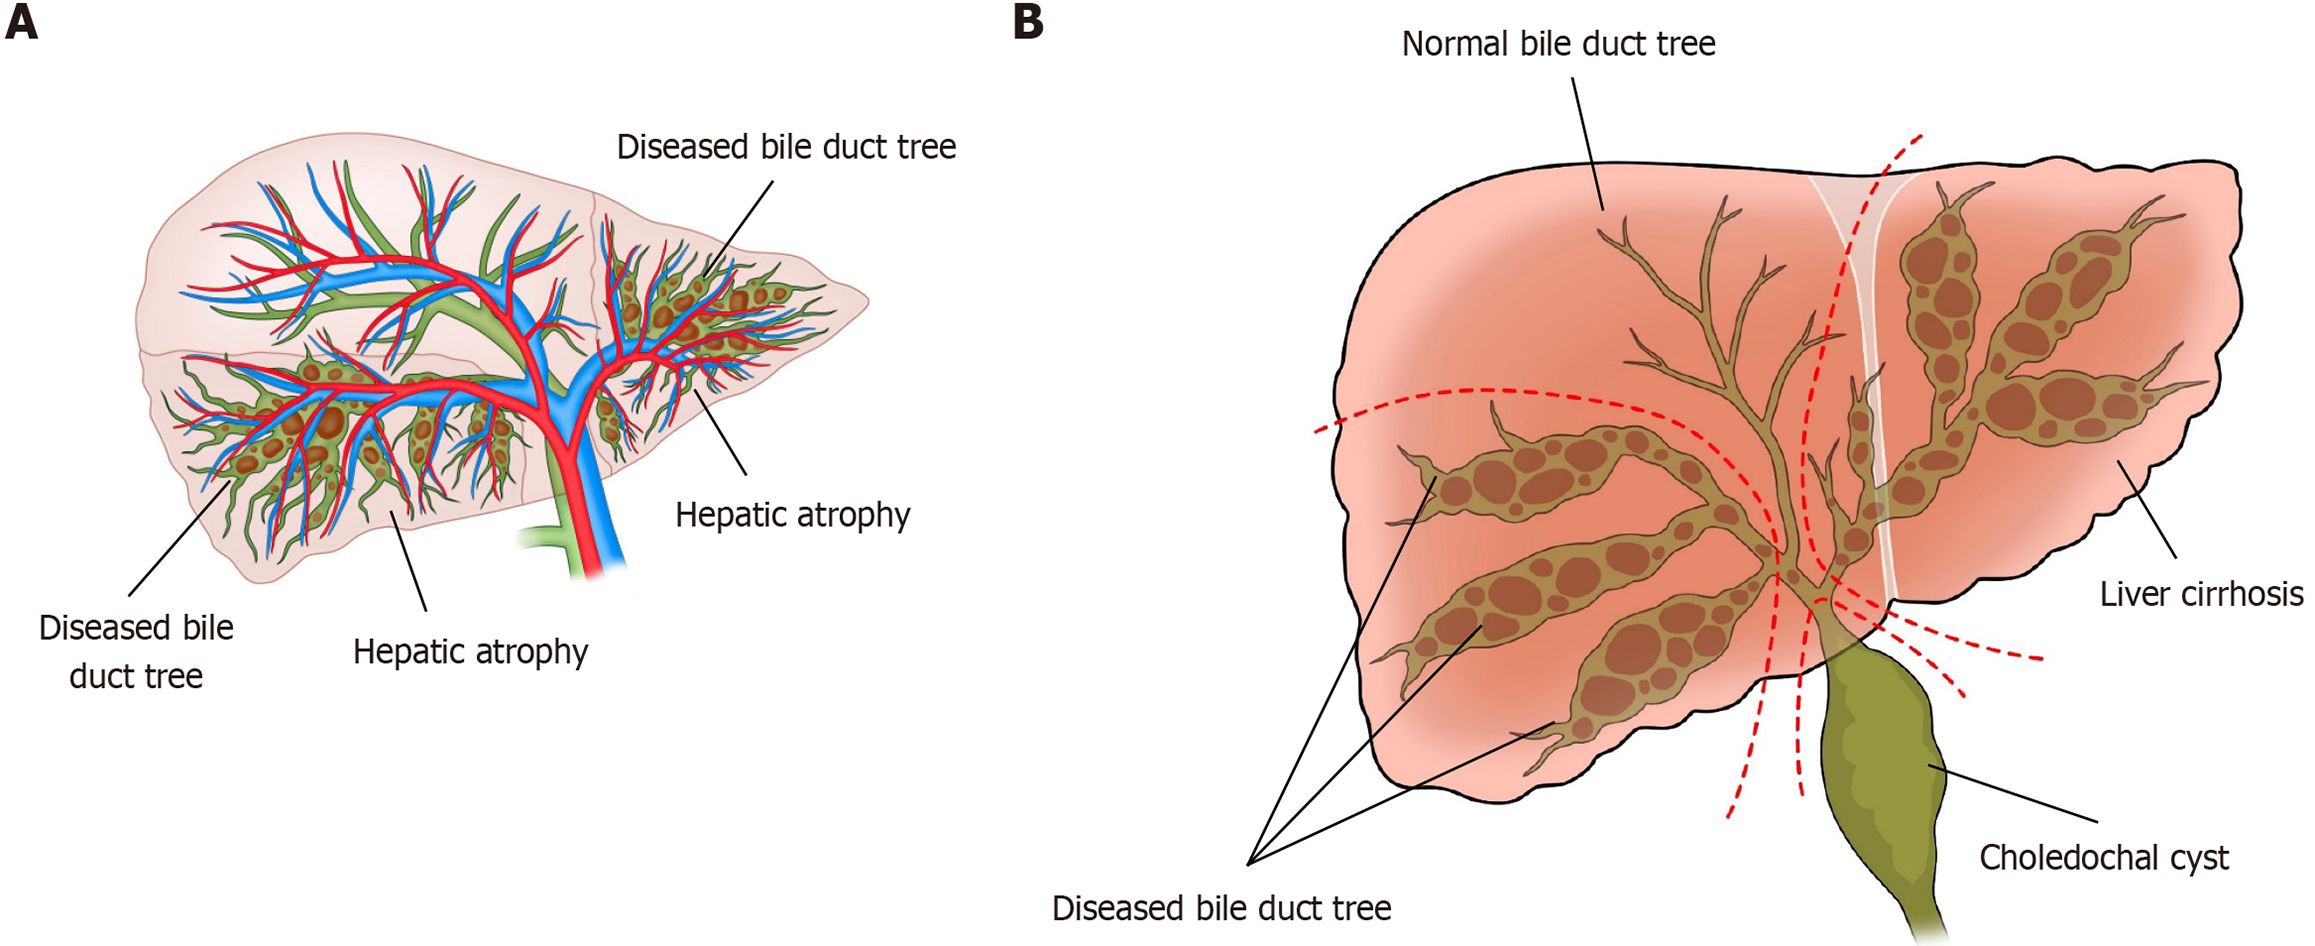
Figure 6 Bile duct tree distribution.
A: Diseased bile duct tree territory, B: Resection of the diseased bile duct tree.
- Citation: Yang YH, Li XJ, Liu YX, Wang XR, Li JW. Laparoscopic hepatectomy based on diseased bile duct tree territory guided by double landmarks for hepatolithiasis: A case report. World J Gastrointest Surg 2025; 17(8): 108959
- URL: https://www.wjgnet.com/1948-9366/full/v17/i8/108959.htm
- DOI: https://dx.doi.org/10.4240/wjgs.v17.i8.108959


