Copyright
©The Author(s) 2025.
World J Gastrointest Surg. Aug 27, 2025; 17(8): 106499
Published online Aug 27, 2025. doi: 10.4240/wjgs.v17.i8.106499
Published online Aug 27, 2025. doi: 10.4240/wjgs.v17.i8.106499
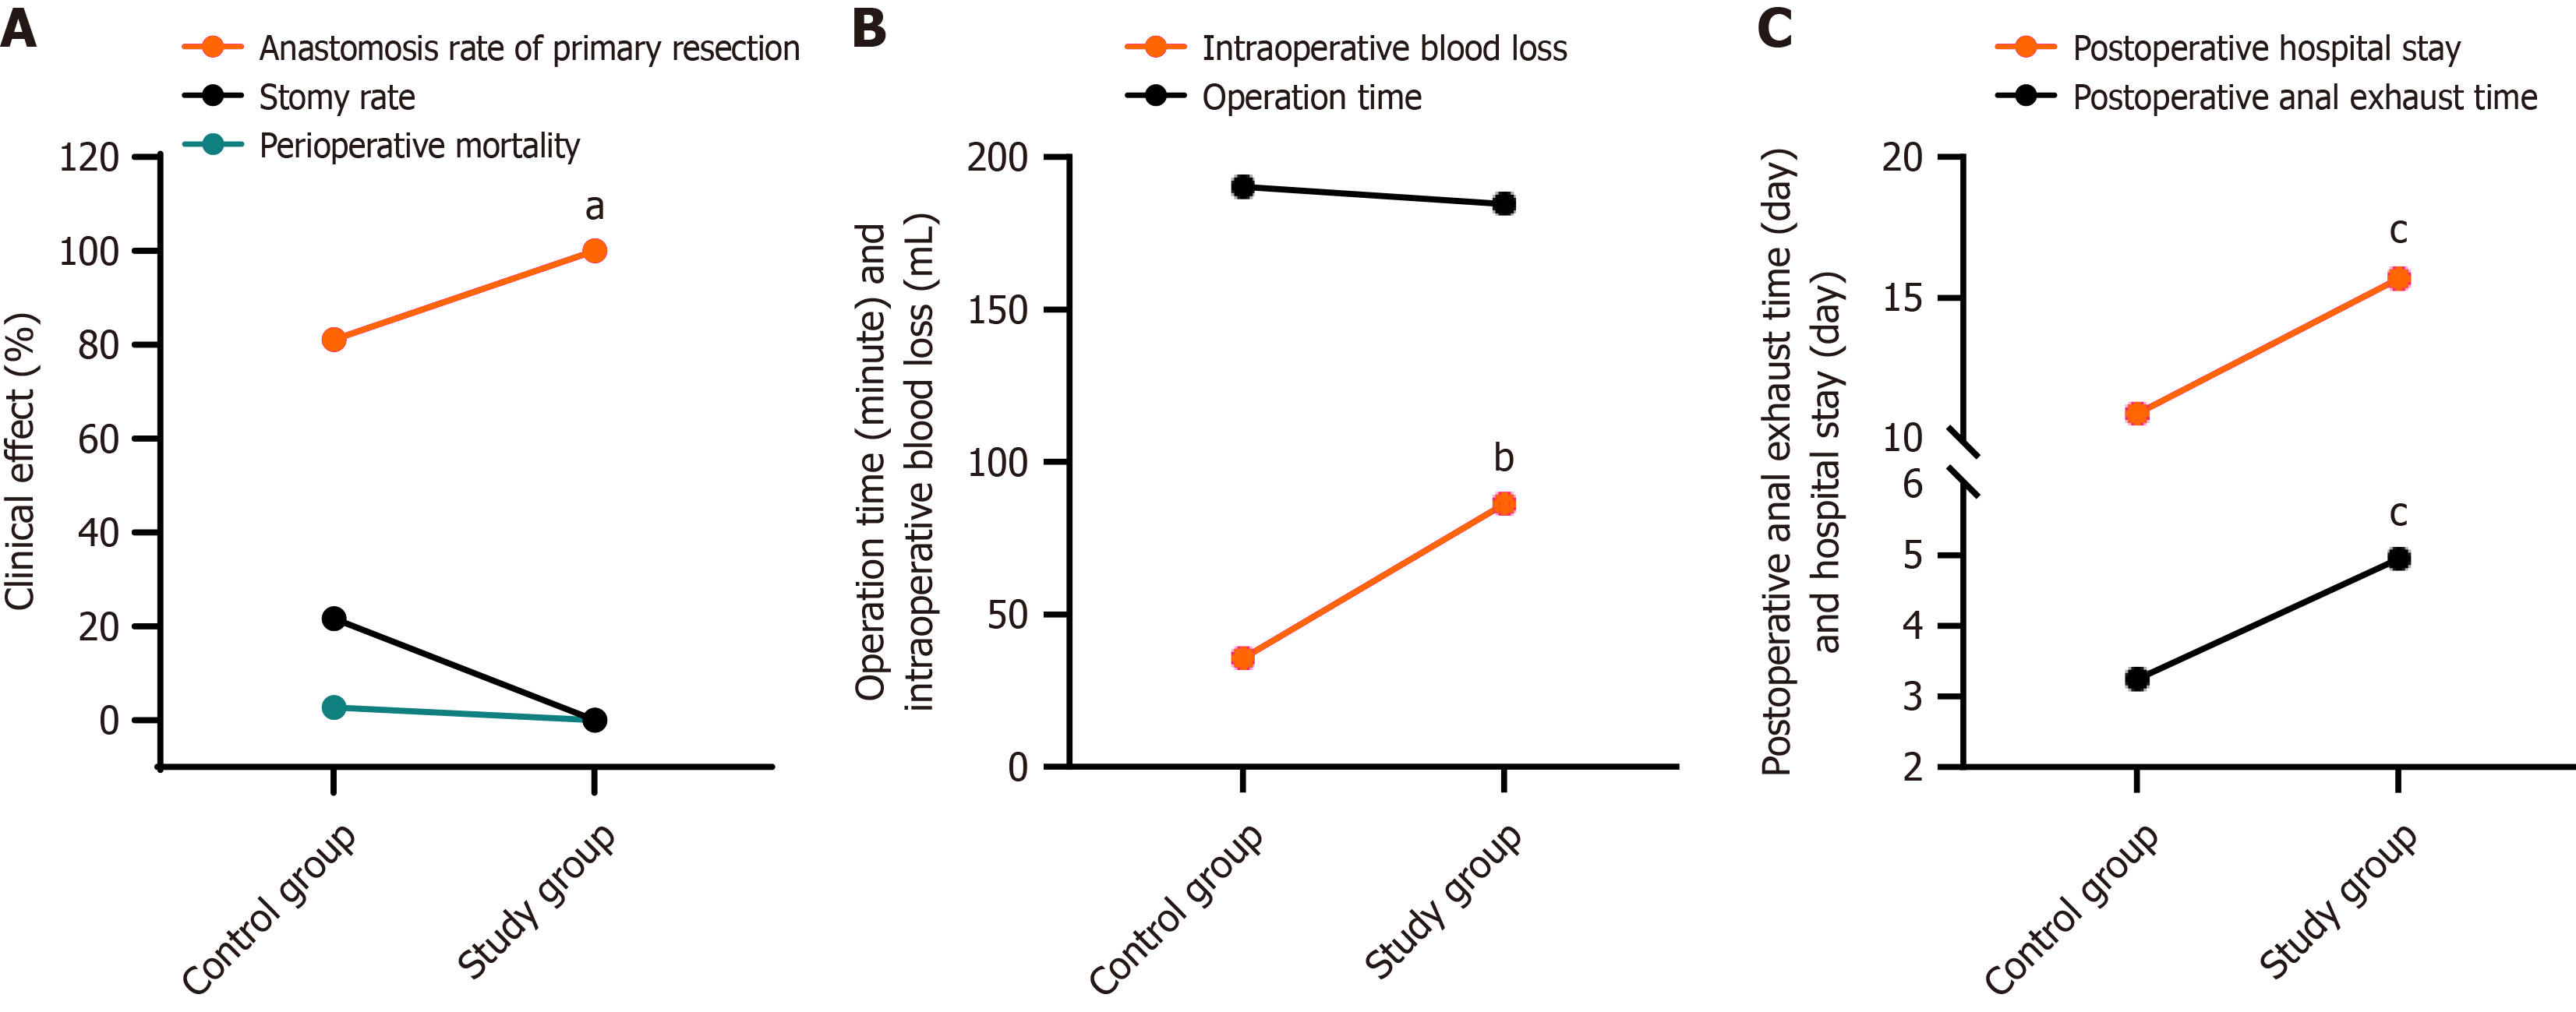
Figure 1 Clinical efficacy comparison between the two groups.
A: Comparison of clinical effect between the two groups; B: Operation time (minute) and Intraoperative blood loss (mL); C: Postoperative anal exhaust time (day) and hospital stay (day). aP < 0.05 vs control; bP < 0.001 vs control; cP < 0.001 vs control.
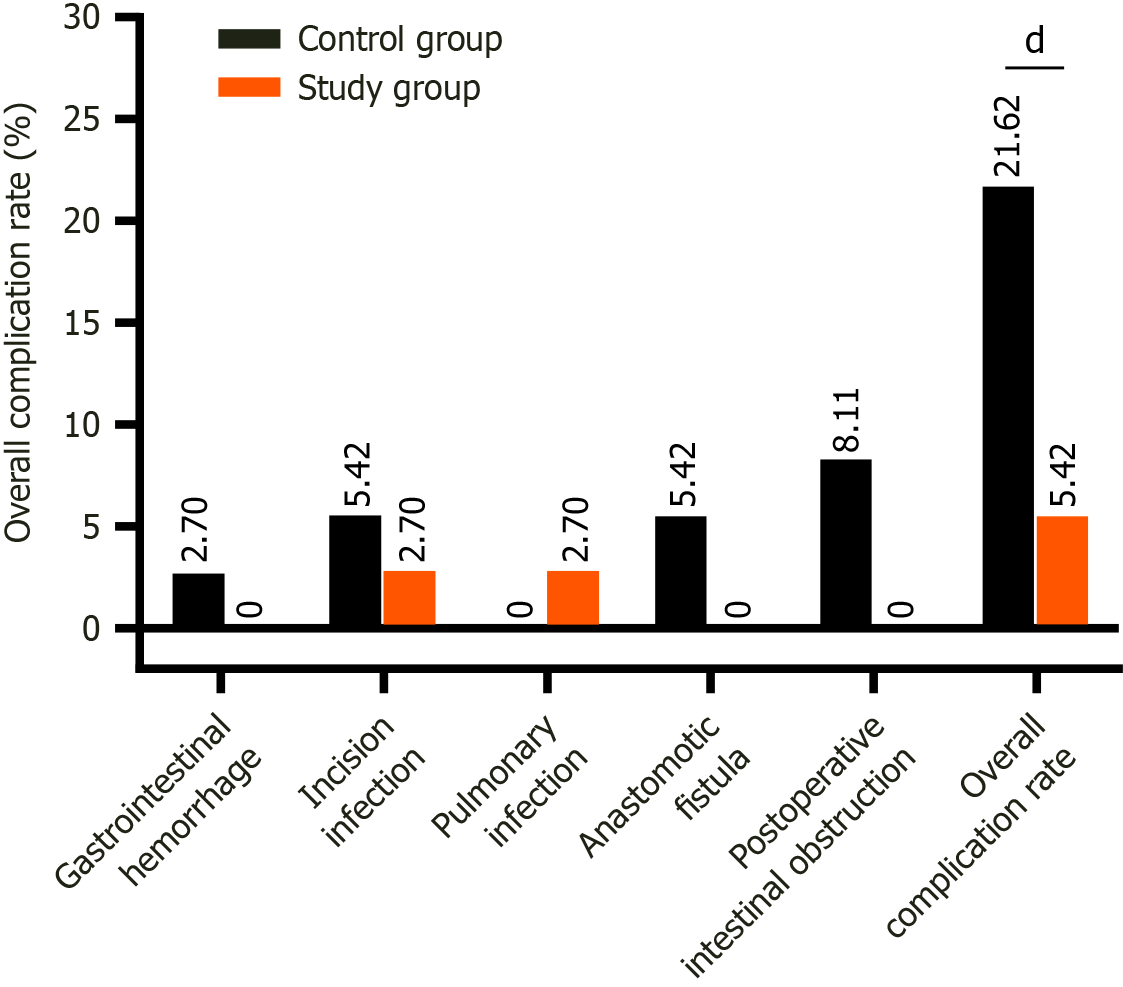
Figure 2 Comparison of overall complication rate between the two groups.
dP < 0.001 vs control.
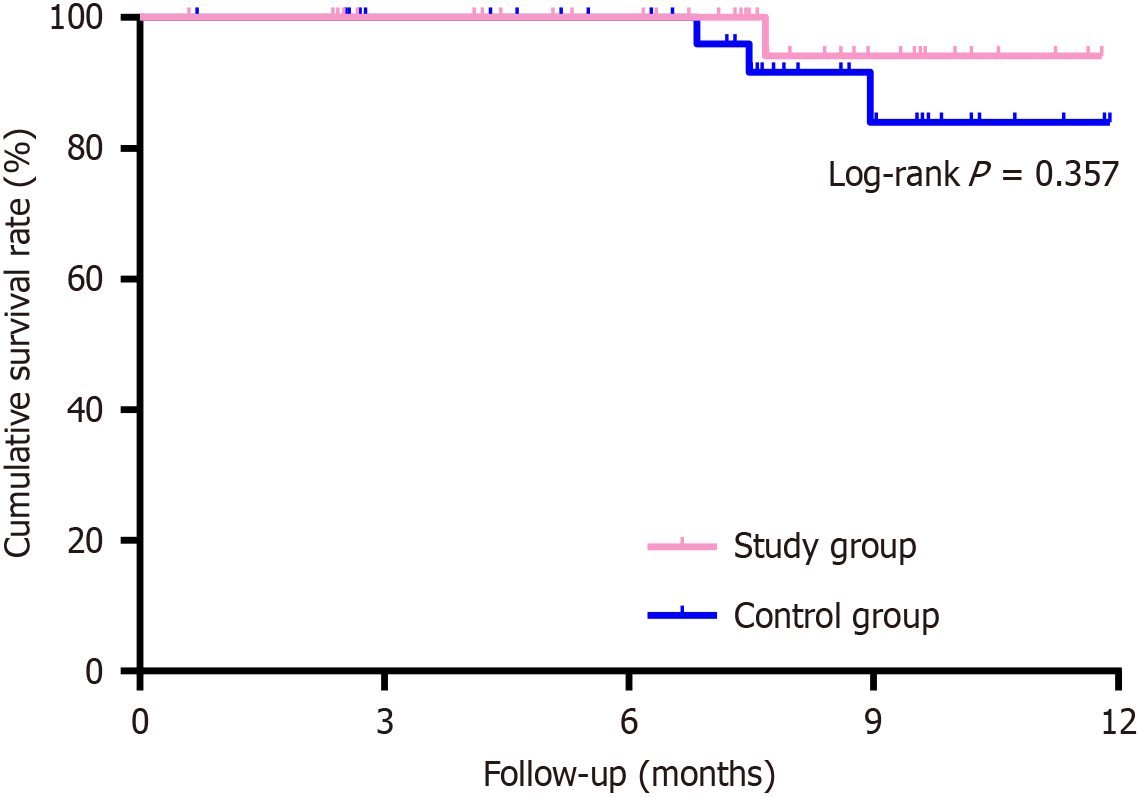
Figure 3 Kaplan-Meier curve of the 12-month cumulative survival of the two groups.
- Citation: He YN, Zhao TT. Efficacy and safety of combining intestinal stenting with laparoscopic surgery in colorectal cancer patients with acute intestinal obstruction. World J Gastrointest Surg 2025; 17(8): 106499
- URL: https://www.wjgnet.com/1948-9366/full/v17/i8/106499.htm
- DOI: https://dx.doi.org/10.4240/wjgs.v17.i8.106499


