Copyright
©The Author(s) 2025.
World J Gastrointest Surg. Aug 27, 2025; 17(8): 106455
Published online Aug 27, 2025. doi: 10.4240/wjgs.v17.i8.106455
Published online Aug 27, 2025. doi: 10.4240/wjgs.v17.i8.106455
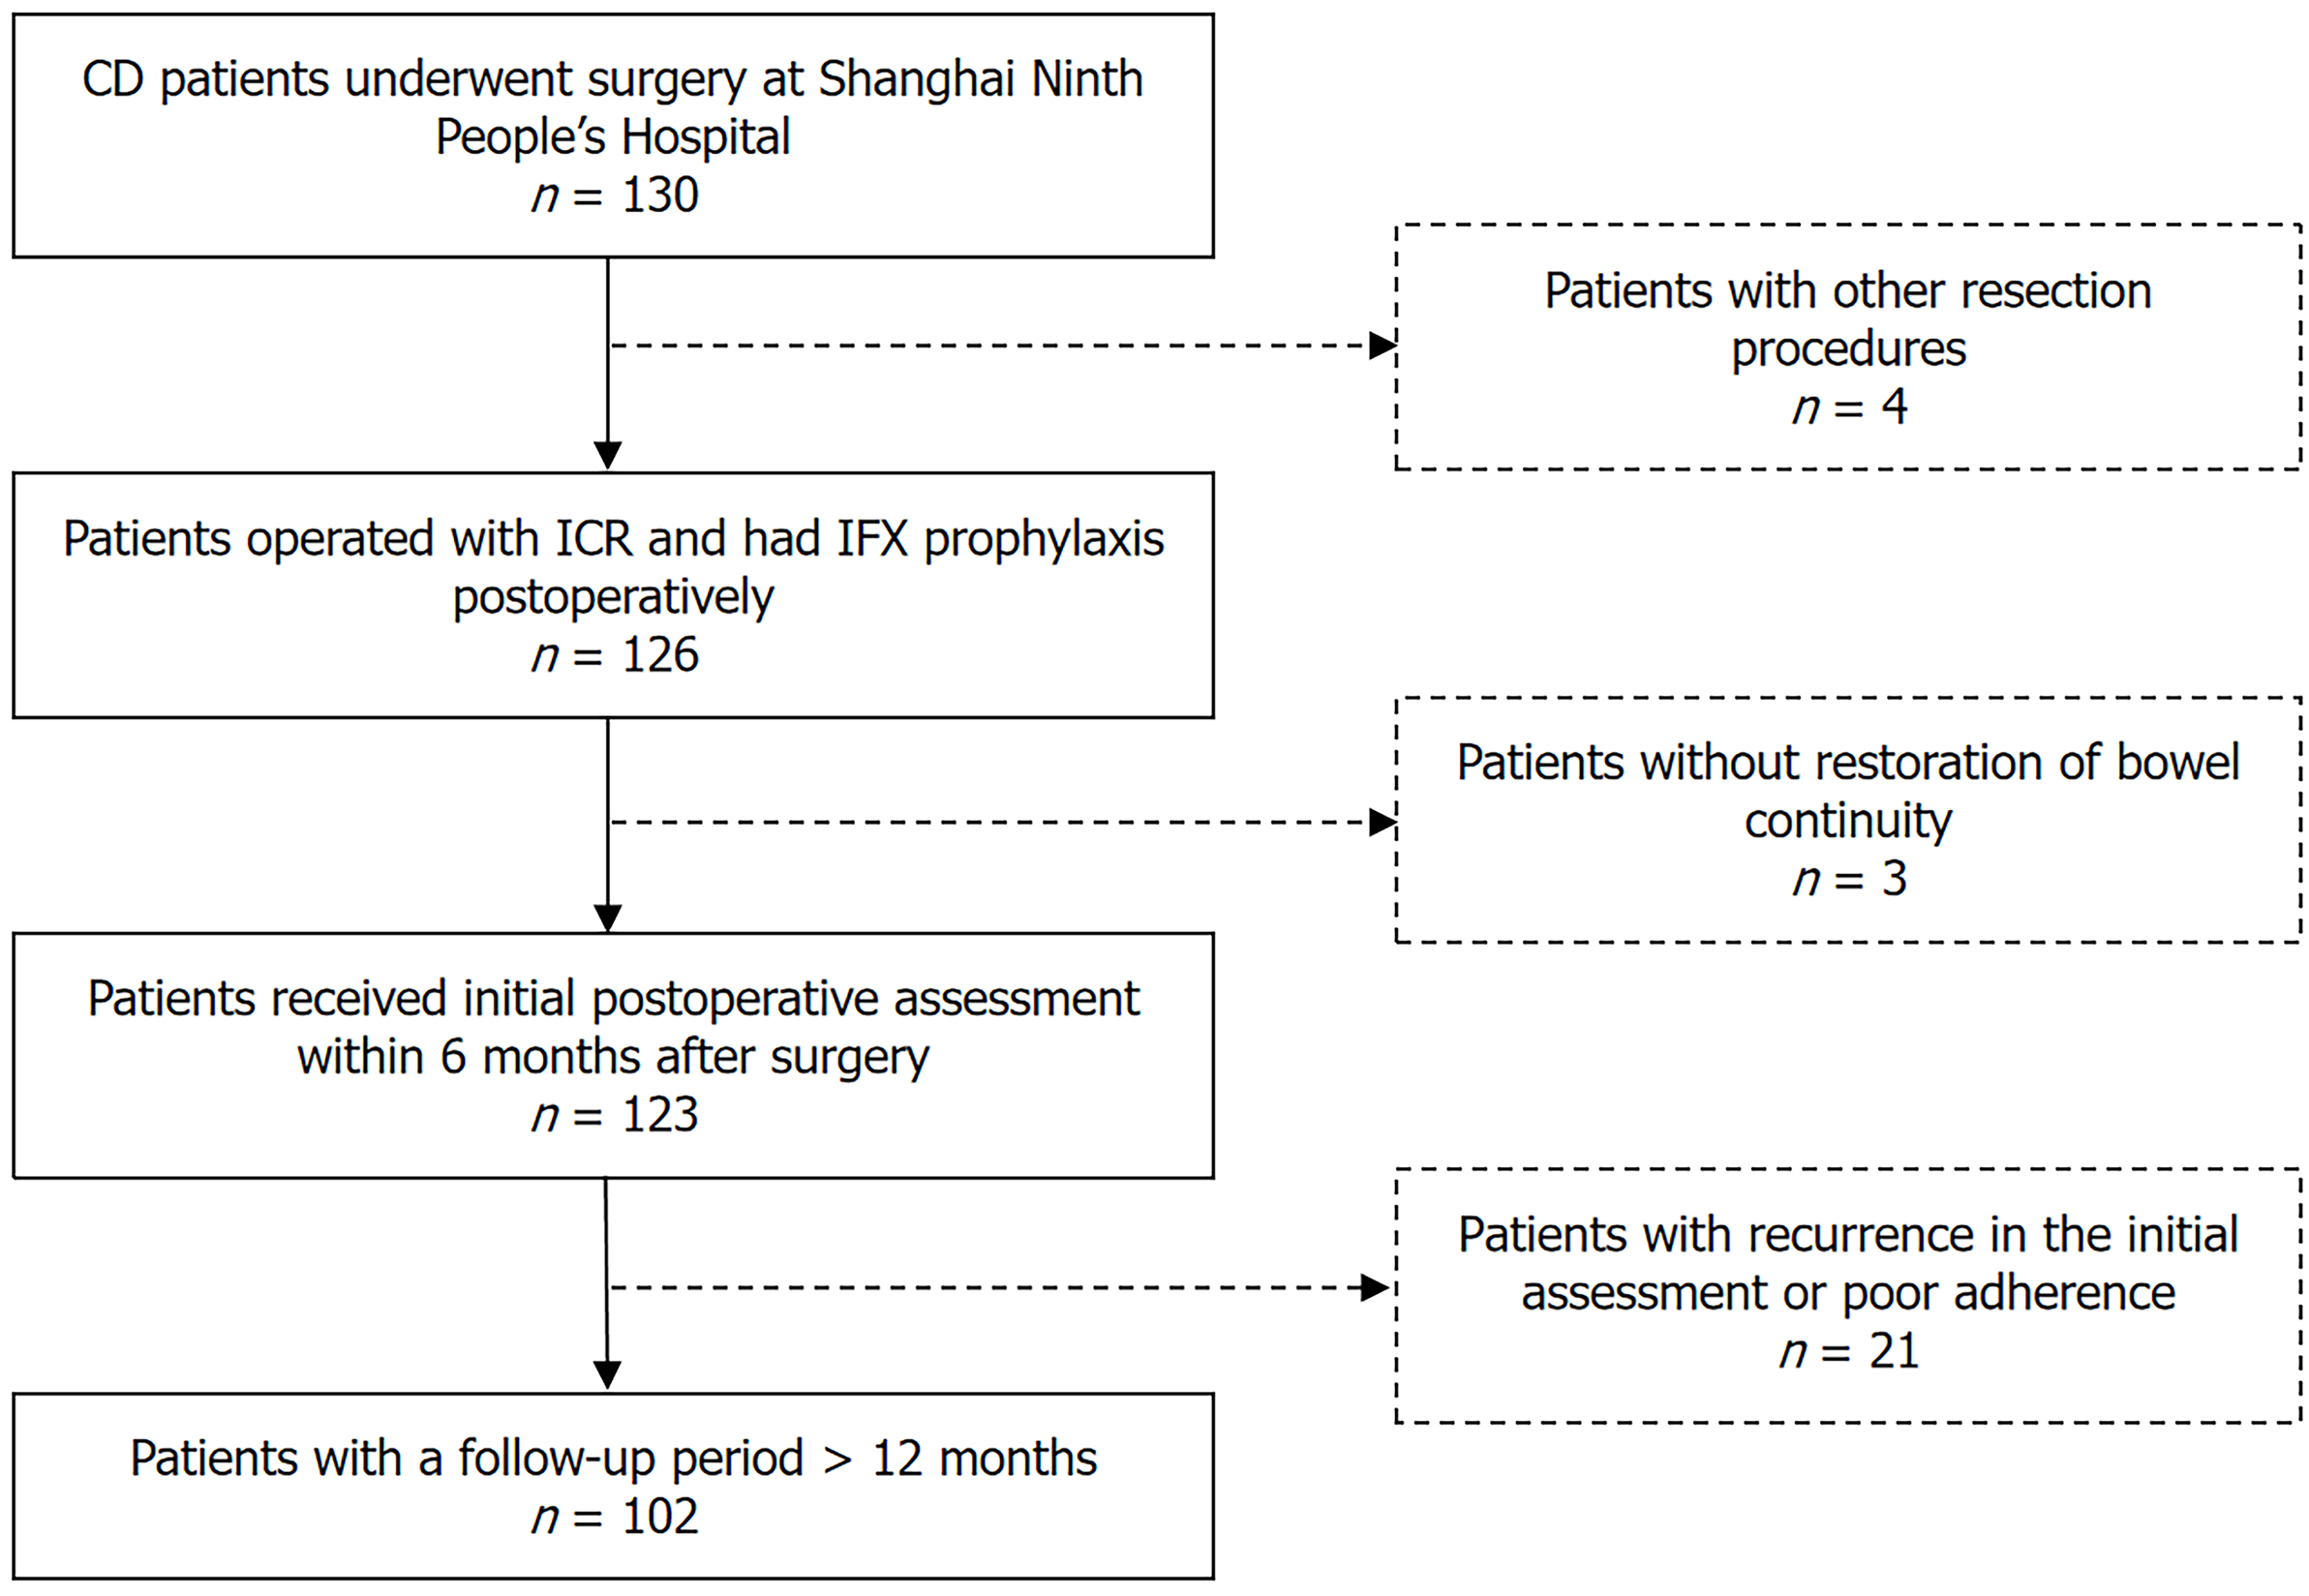
Figure 1 Flowchart of the patients included in this study.
CD: Crohn’s disease; ICR: Ileocecal resection; IFX: Infliximab.
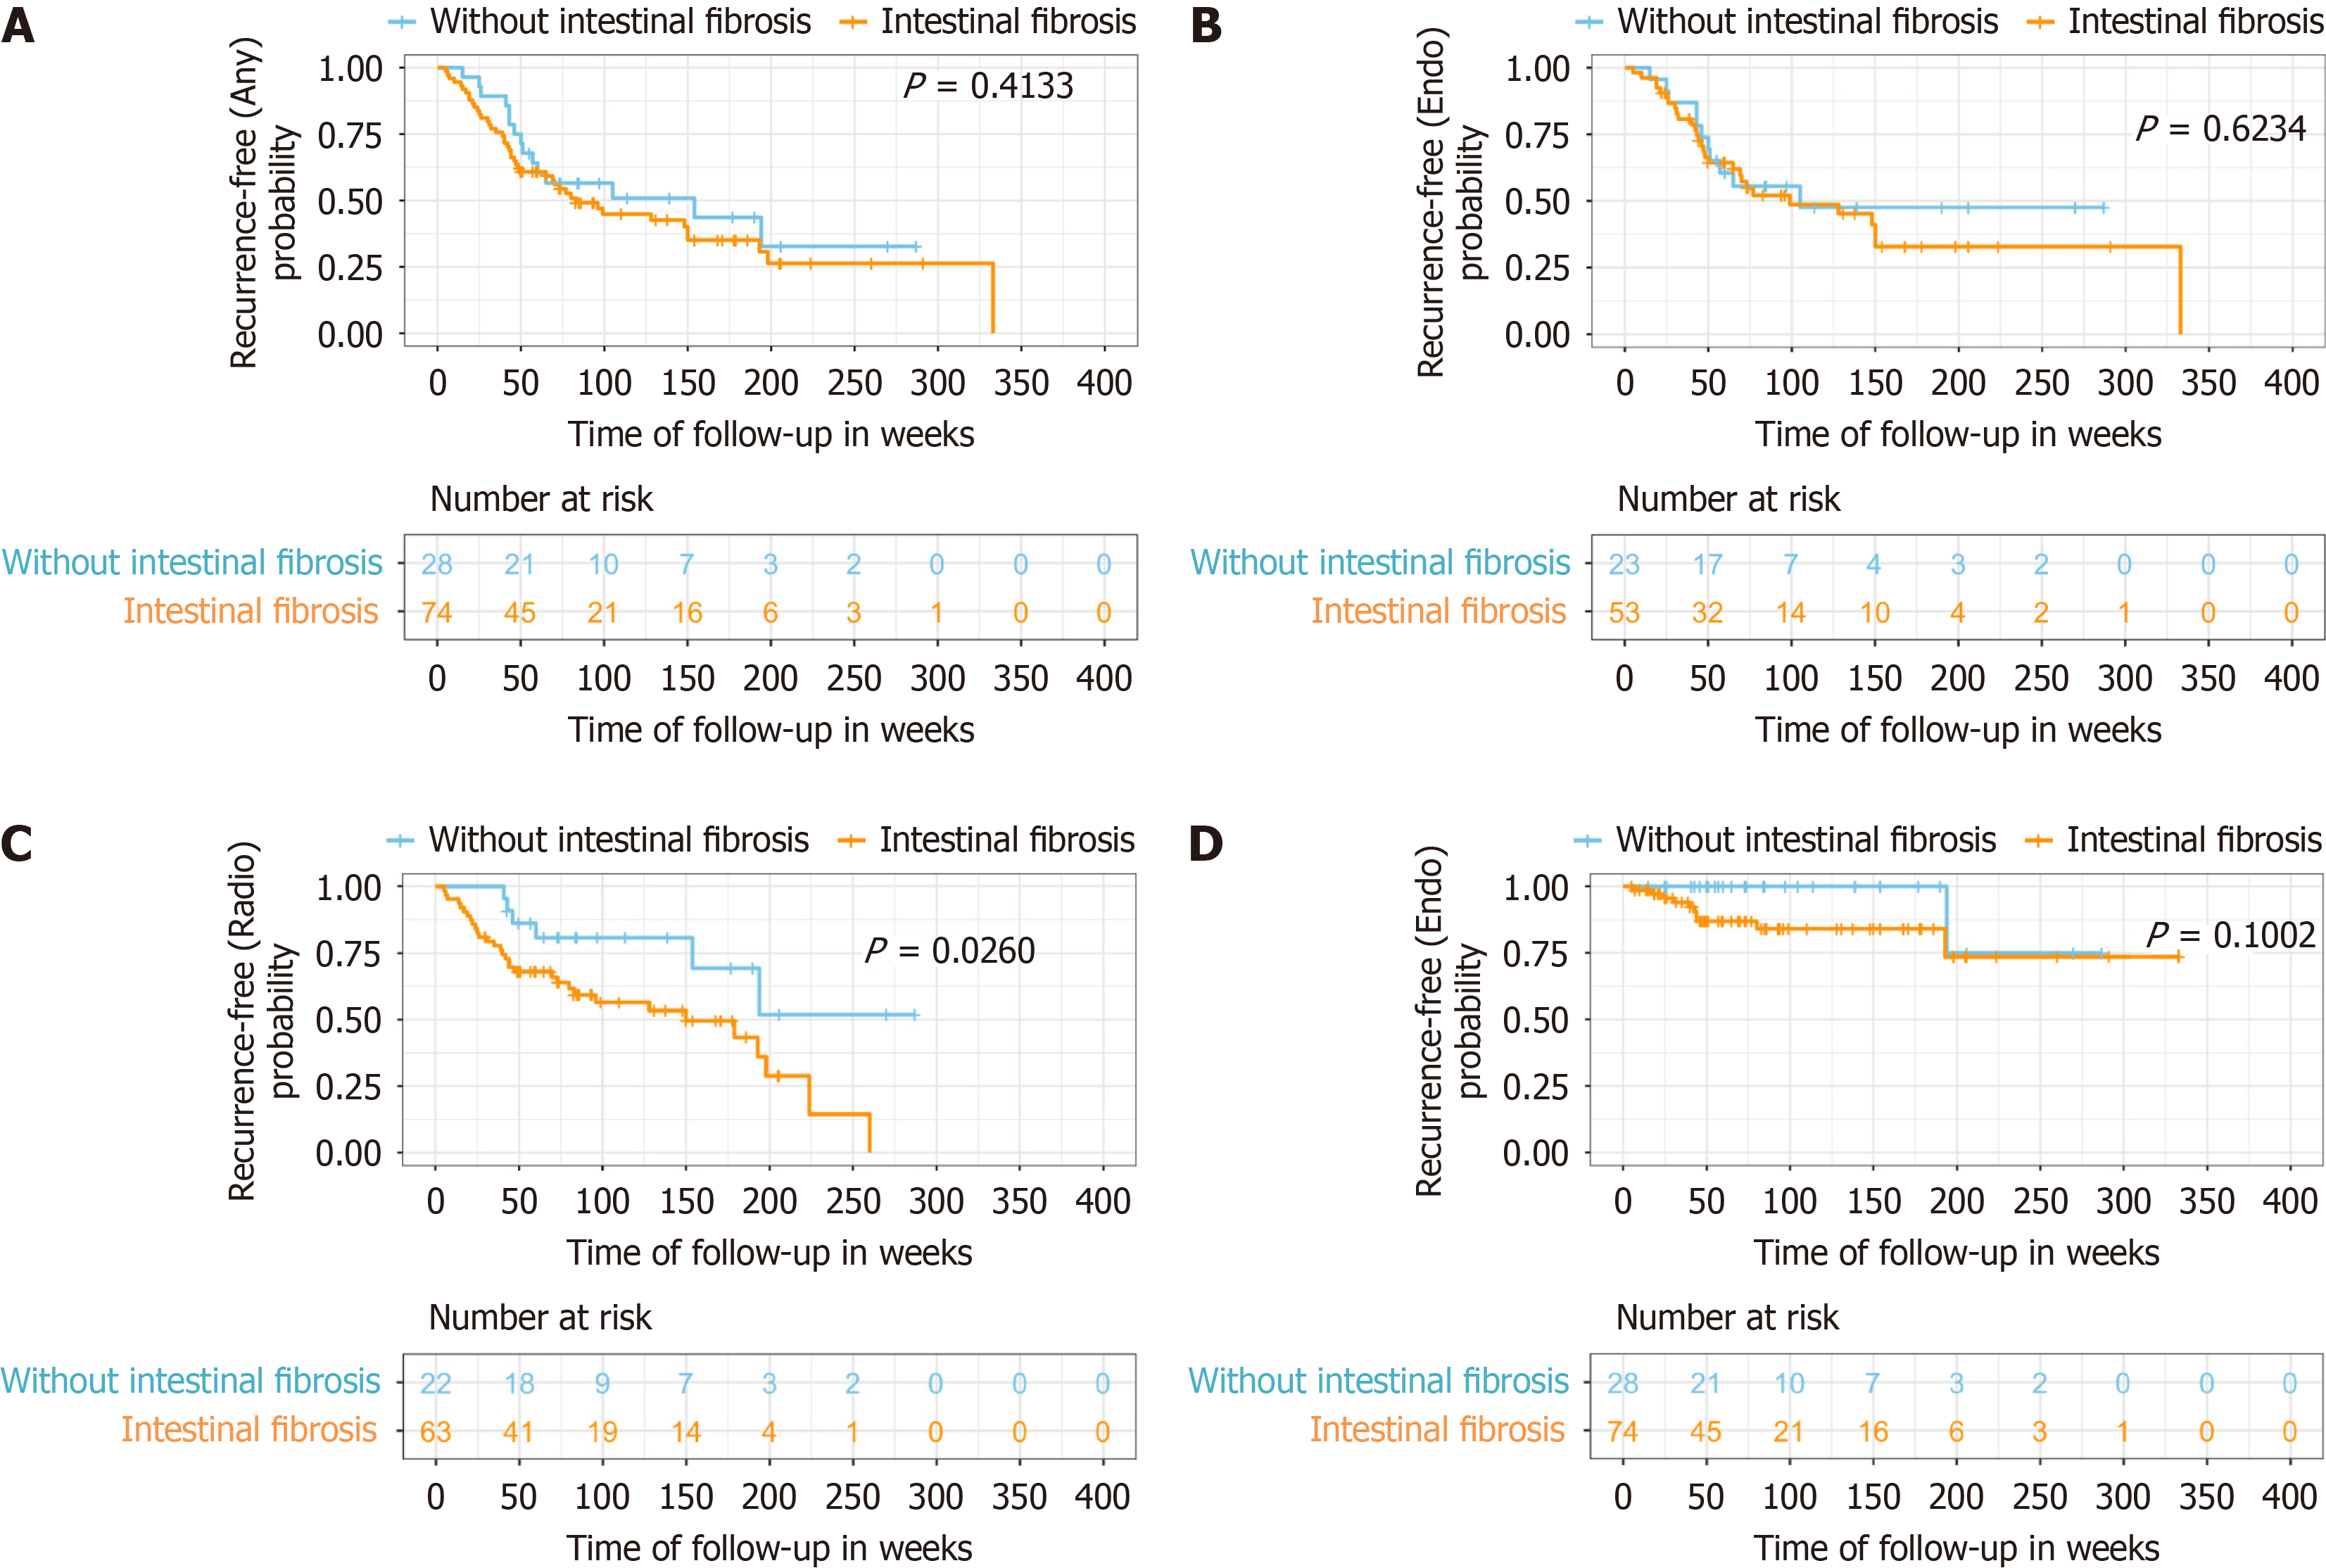
Figure 2 Kaplan-Meier curve.
A: Kaplan-Meier curve for postoperative recurrences of Crohn’s disease (including endoscopic, radiographic and surgical) according to the existence of intestinal fibrosis; B-D: Kaplan-Meier curves for endoscopic postoperative recurrence (B), radiographic postoperative recurrence (C), and surgical recurrence (D), according to the existence of intestinal fibrosis.
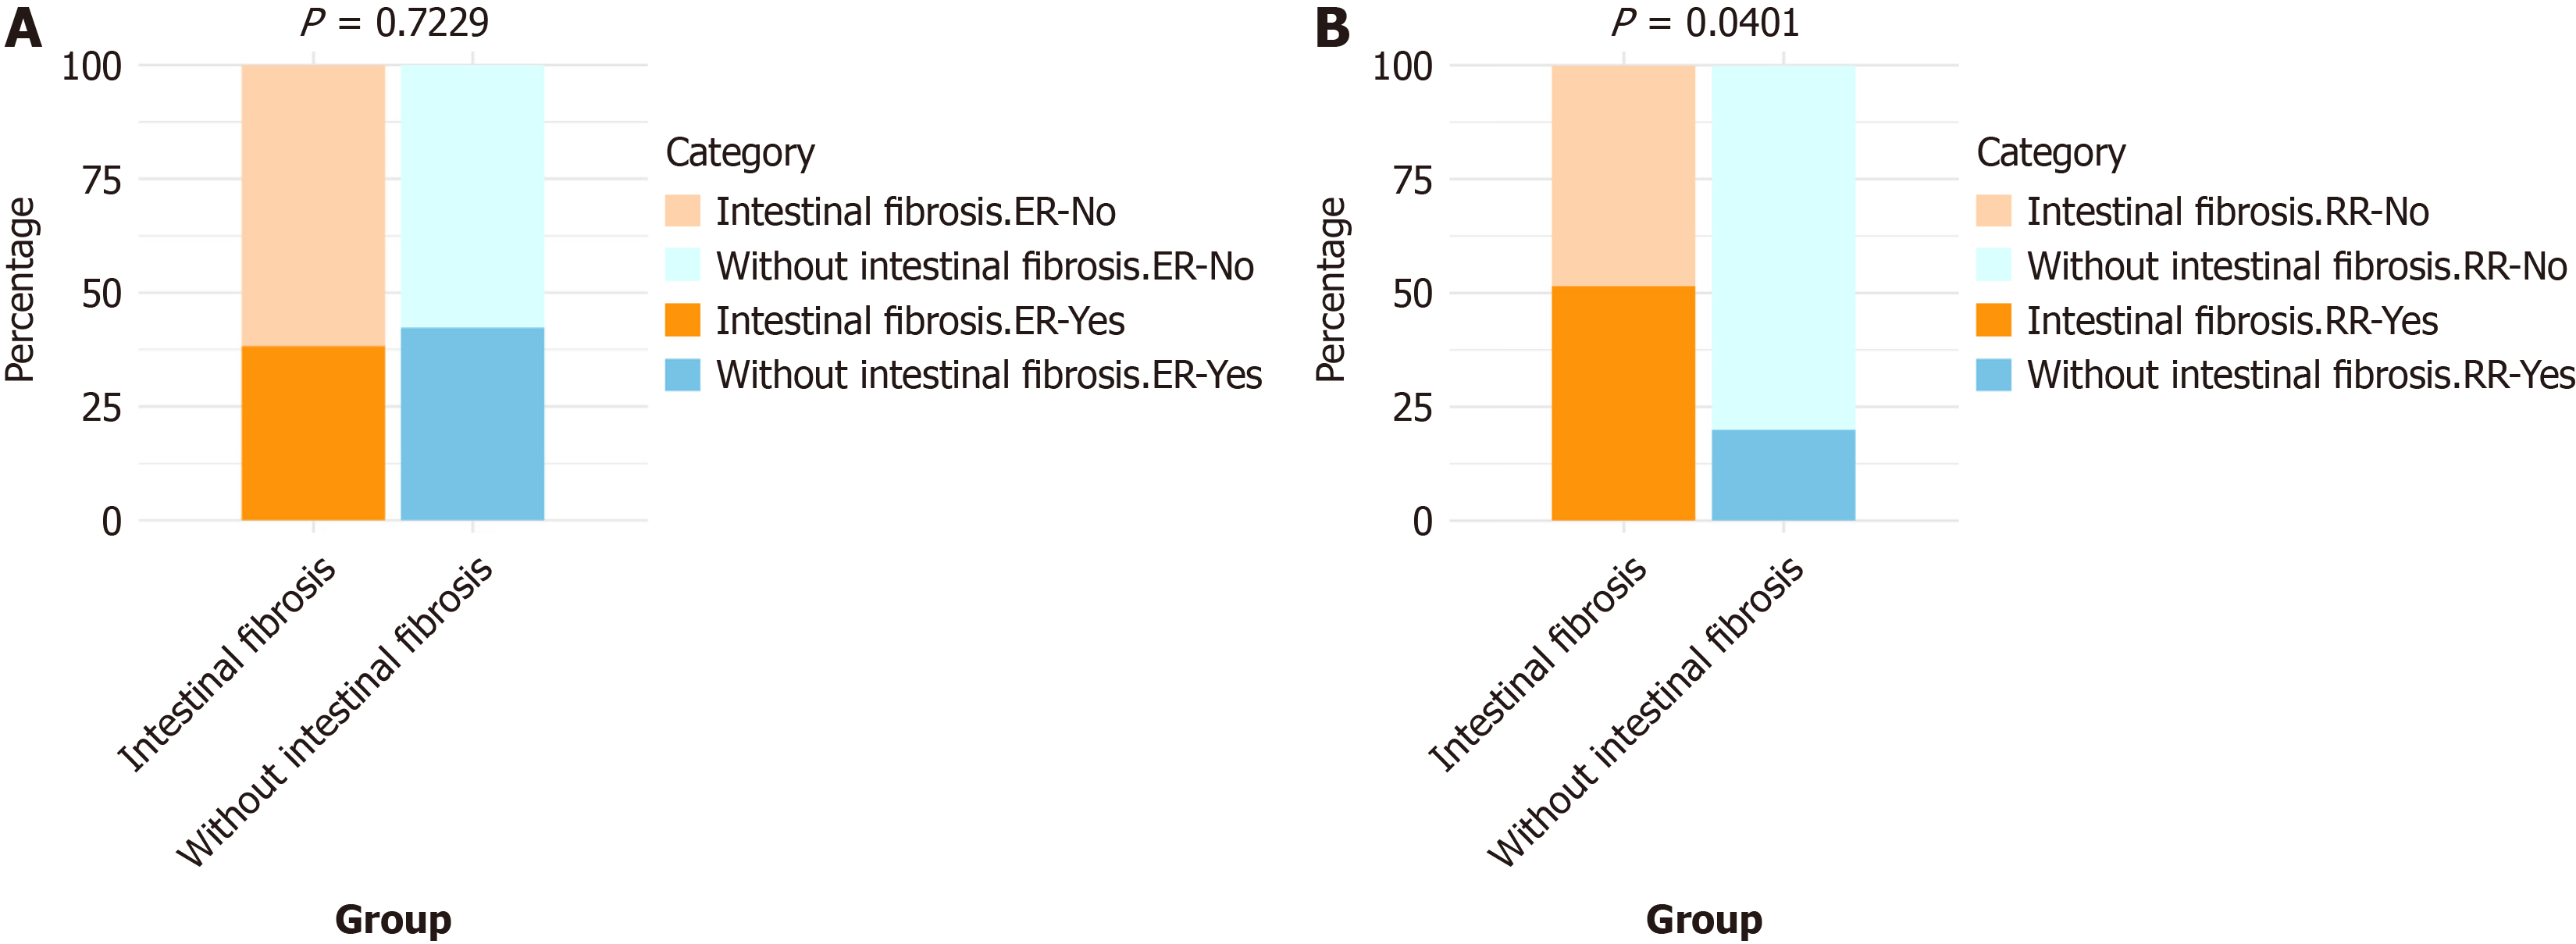
Figure 3 Rates of endoscopic and radiographic postoperative recurrence at 12 ± 6 months after therapy initiation, according to the existence of intestinal fibrosis.
ER: Endoscopic recurrence; RR: Radiographic recurrence.
- Citation: Ding ZY, Wang YJ, Yao DH, Tian T, Huang YH, Li YS. Intestinal fibrosis attenuates the prophylactic effect of anti-tumour necrosis factor therapy on the postoperative recurrence of Crohn’s disease. World J Gastrointest Surg 2025; 17(8): 106455
- URL: https://www.wjgnet.com/1948-9366/full/v17/i8/106455.htm
- DOI: https://dx.doi.org/10.4240/wjgs.v17.i8.106455


