Copyright
©The Author(s) 2025.
World J Gastrointest Surg. May 27, 2025; 17(5): 105220
Published online May 27, 2025. doi: 10.4240/wjgs.v17.i5.105220
Published online May 27, 2025. doi: 10.4240/wjgs.v17.i5.105220
Figure 1 Images of the first contrast-enhanced computed tomography.
A: The lesion demonstrated significant enhancement in the arterial phase; B and C: Slightly higher enhancement in the portal vein and delayed phases compared to the hepatic parenchyma.
Figure 2 Images of the second contrast-enhanced computed tomography.
A: During the arterial phase, the lesion demonstrated heterogeneous enhancement, while the contrast agent was being washed out during the portal vein phase and delayed phase; B and C: Patchy low-density shadows.
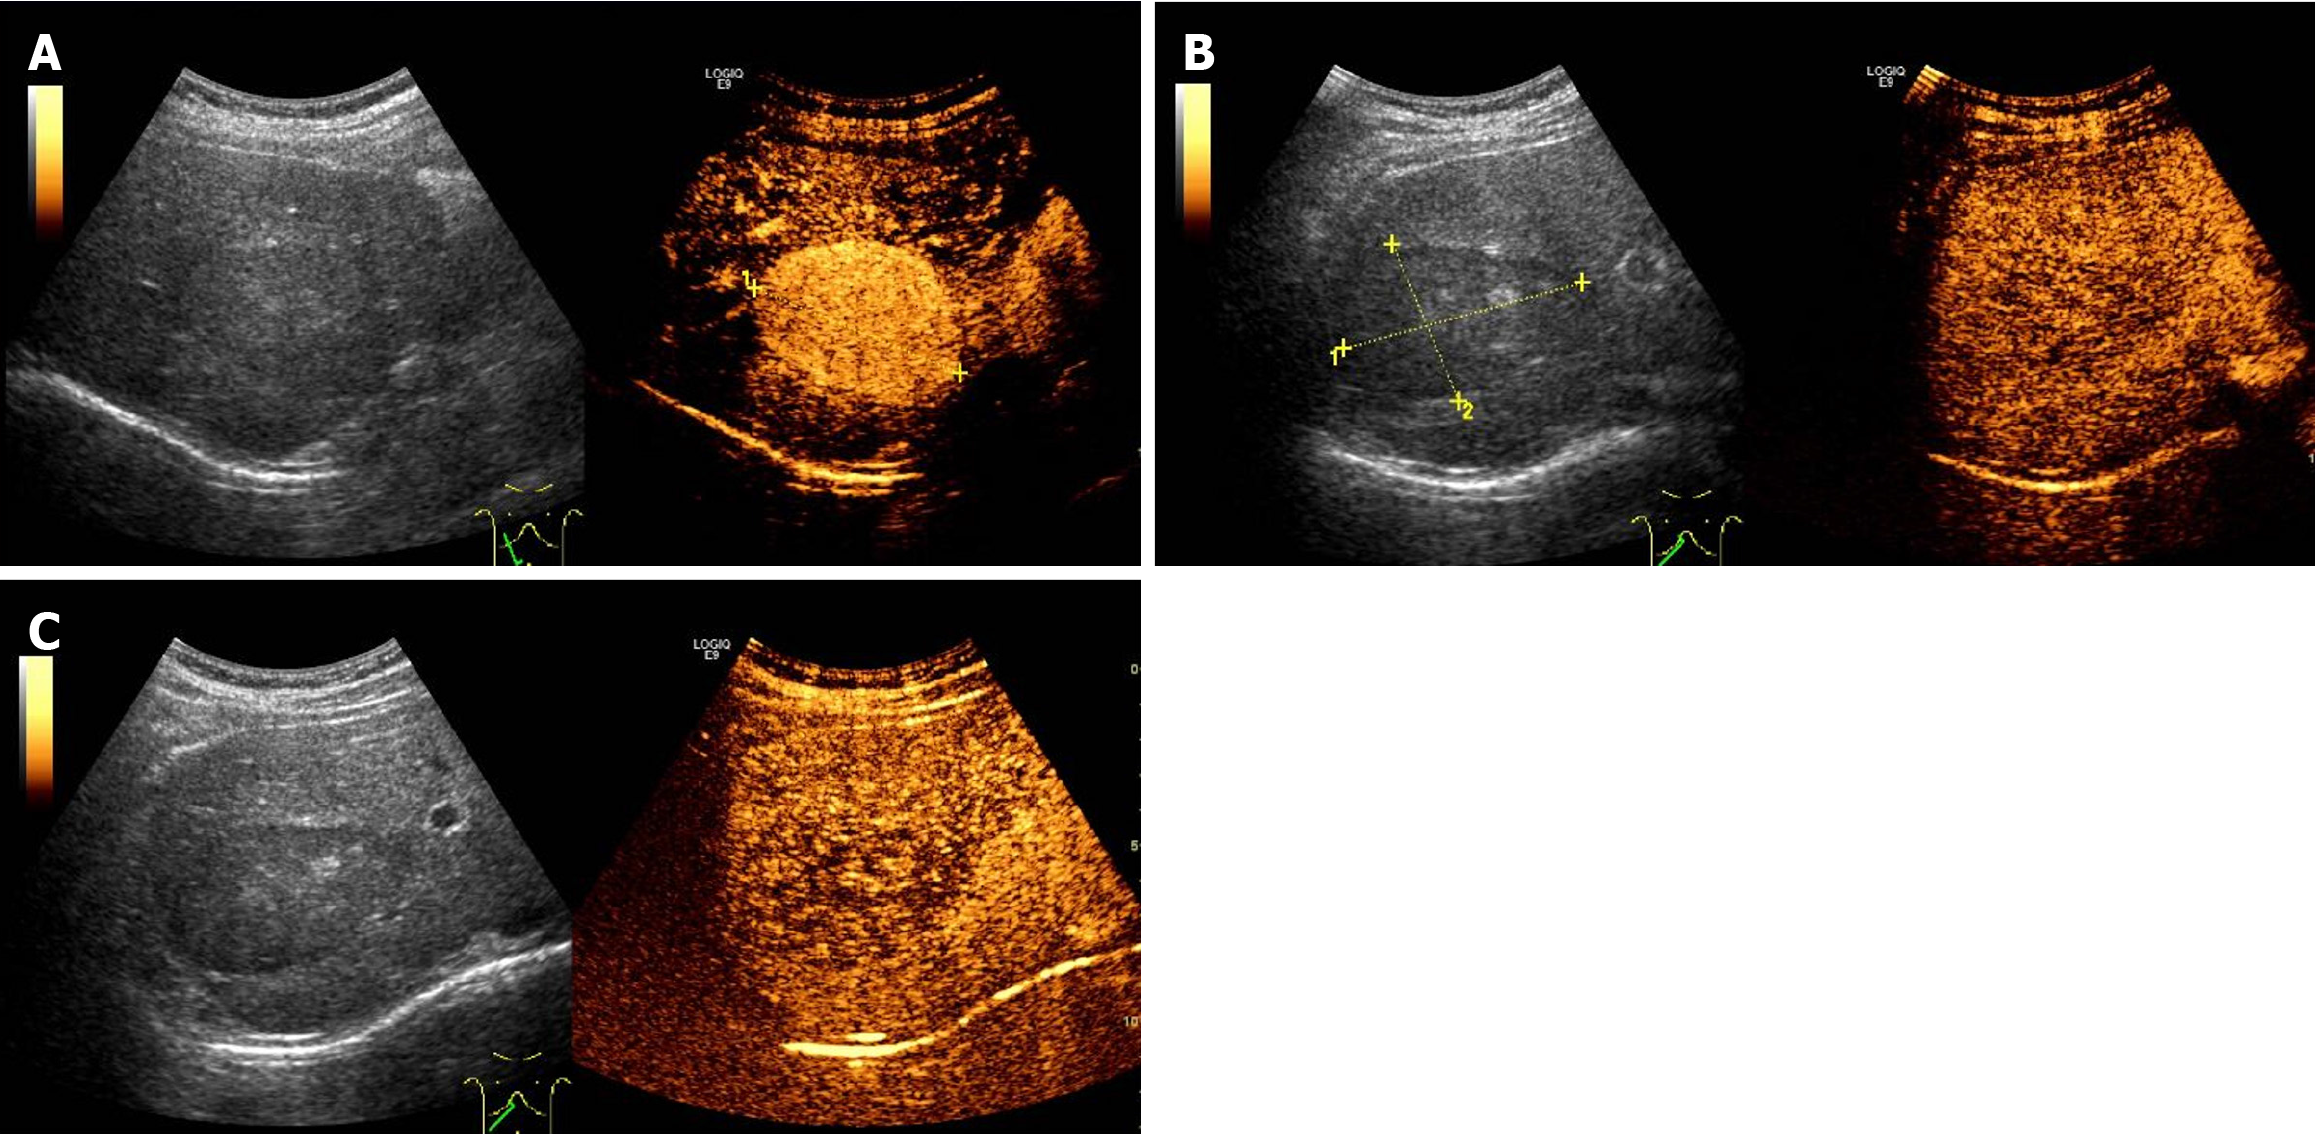
Figure 3 Enhancement patterns of contrast-enhanced ultrasound.
A: The lesion demonstrated a marked enhancement in the arterial phase; B: The lesion began to wash out during the portal vein phase; C: In the delayed phase, the lesion appeared slightly hypoechoic.
Figure 4 Postoperative pathological findings.
A: Hematoxylin-eosin staining. The tumor cells are polygonal with translucent cytoplasm containing uneven eosinophilic granules. Perinuclear eosinophilic condensation shows a clear appearance (black arrow). The nuclei are round or oval with a distinct nucleolus and sparse chromatin (white arrow); B and C: Immunohistochemical staining revealed positivity for HMB45 (B) and Melan-A (C), with increased expression in both the cytoplasm and nuclei of tumor cells compared to normal liver cells.
- Citation: Zhou JA, Fan ZC, Zheng RJ, Guo QX, Su S. Diagnostic challenges and radiological insights of rare hepatic perivascular epithelioid cell tumor: A case report and review of the literature. World J Gastrointest Surg 2025; 17(5): 105220
- URL: https://www.wjgnet.com/1948-9366/full/v17/i5/105220.htm
- DOI: https://dx.doi.org/10.4240/wjgs.v17.i5.105220


