Copyright
©The Author(s) 2025.
World J Gastrointest Surg. Feb 27, 2025; 17(2): 99529
Published online Feb 27, 2025. doi: 10.4240/wjgs.v17.i2.99529
Published online Feb 27, 2025. doi: 10.4240/wjgs.v17.i2.99529
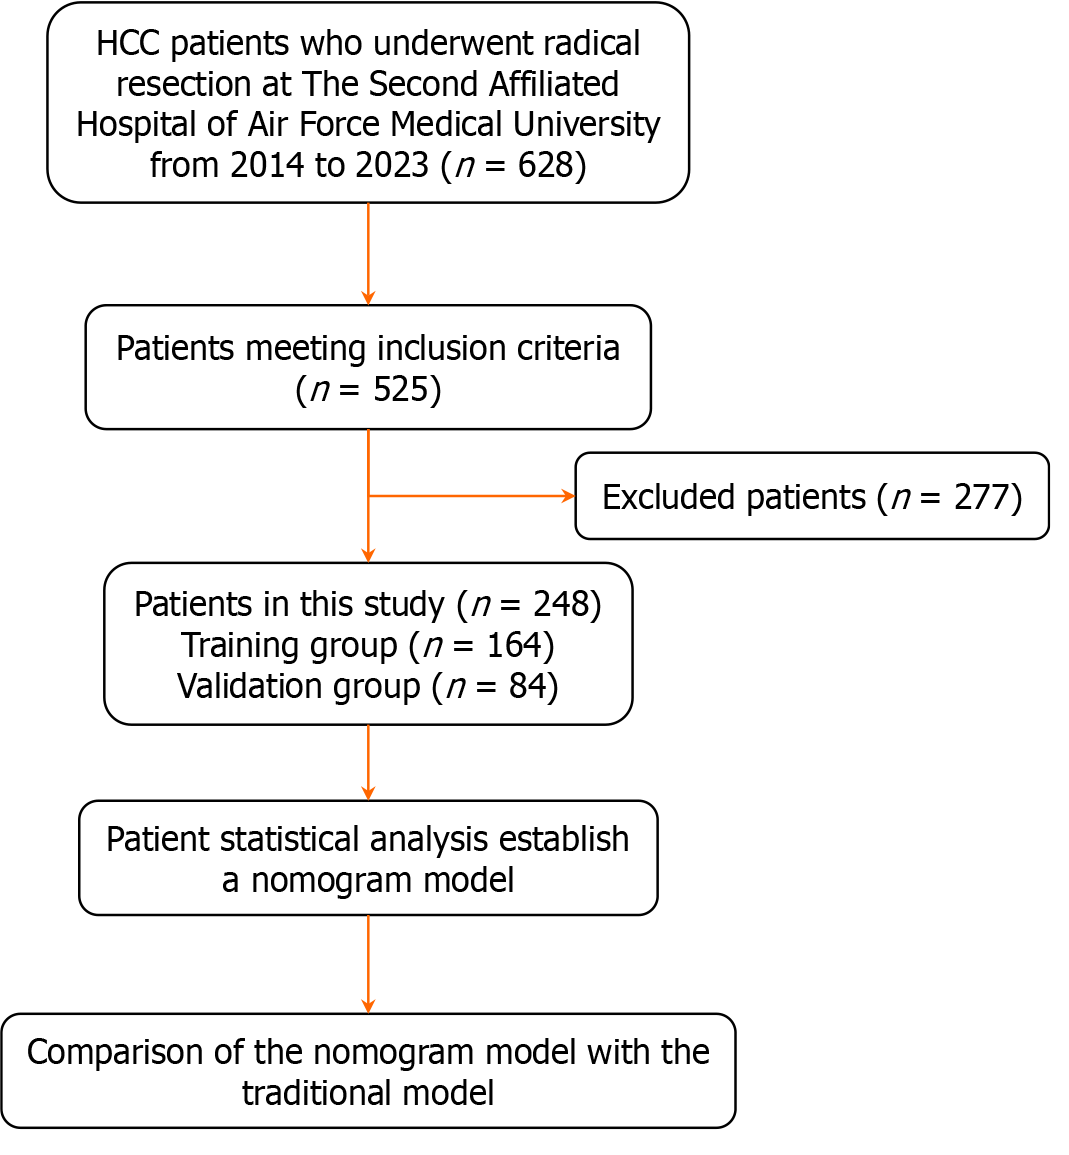
Figure 1 Research flow chart.
HCC: Hepatocellular carcinoma.
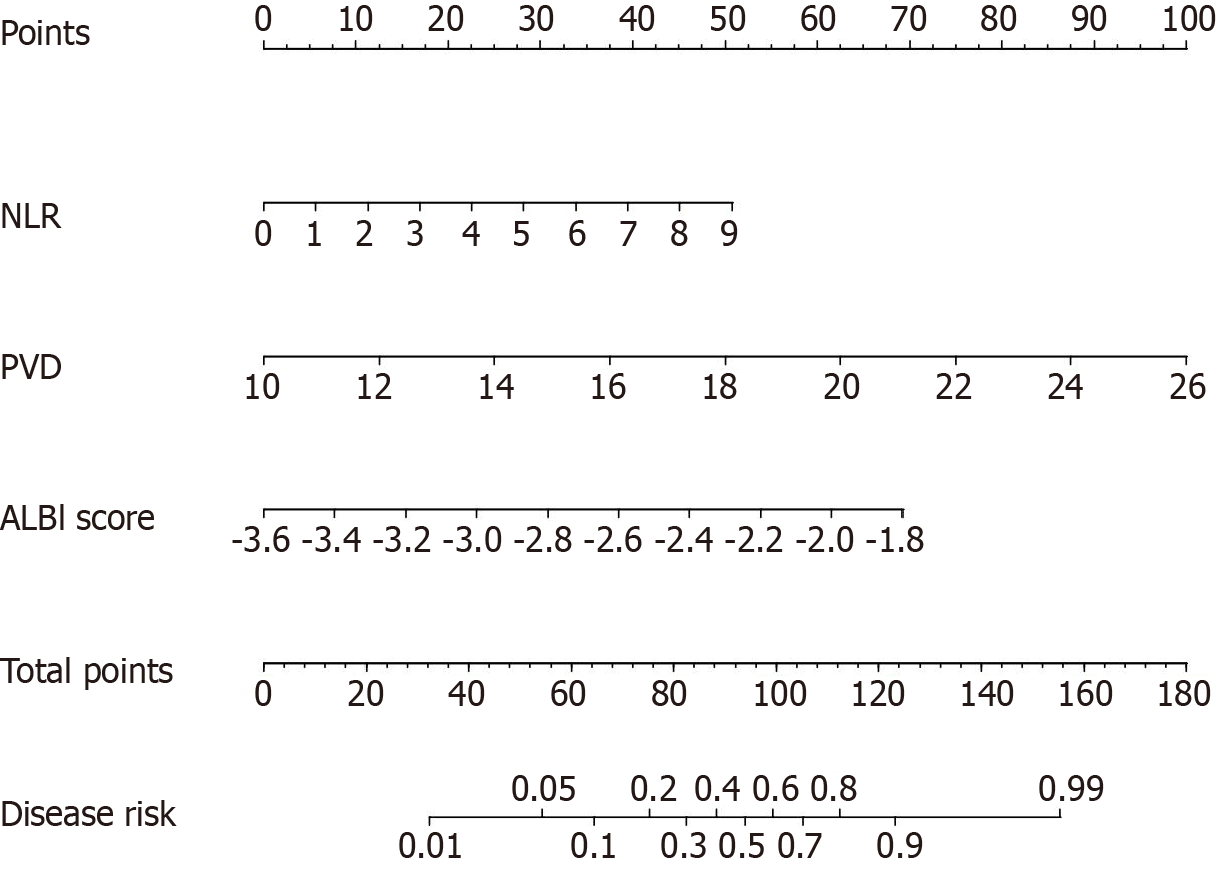
Figure 2 Predictive nomogram for assessing the probability of post-hepatectomy liver failure in patients with hepatocellular carcinoma.
NLR: Neutrophil-to-lymphocyte ratio; PVD: Portal vein width; ALBI: Albumin-bilirubin.
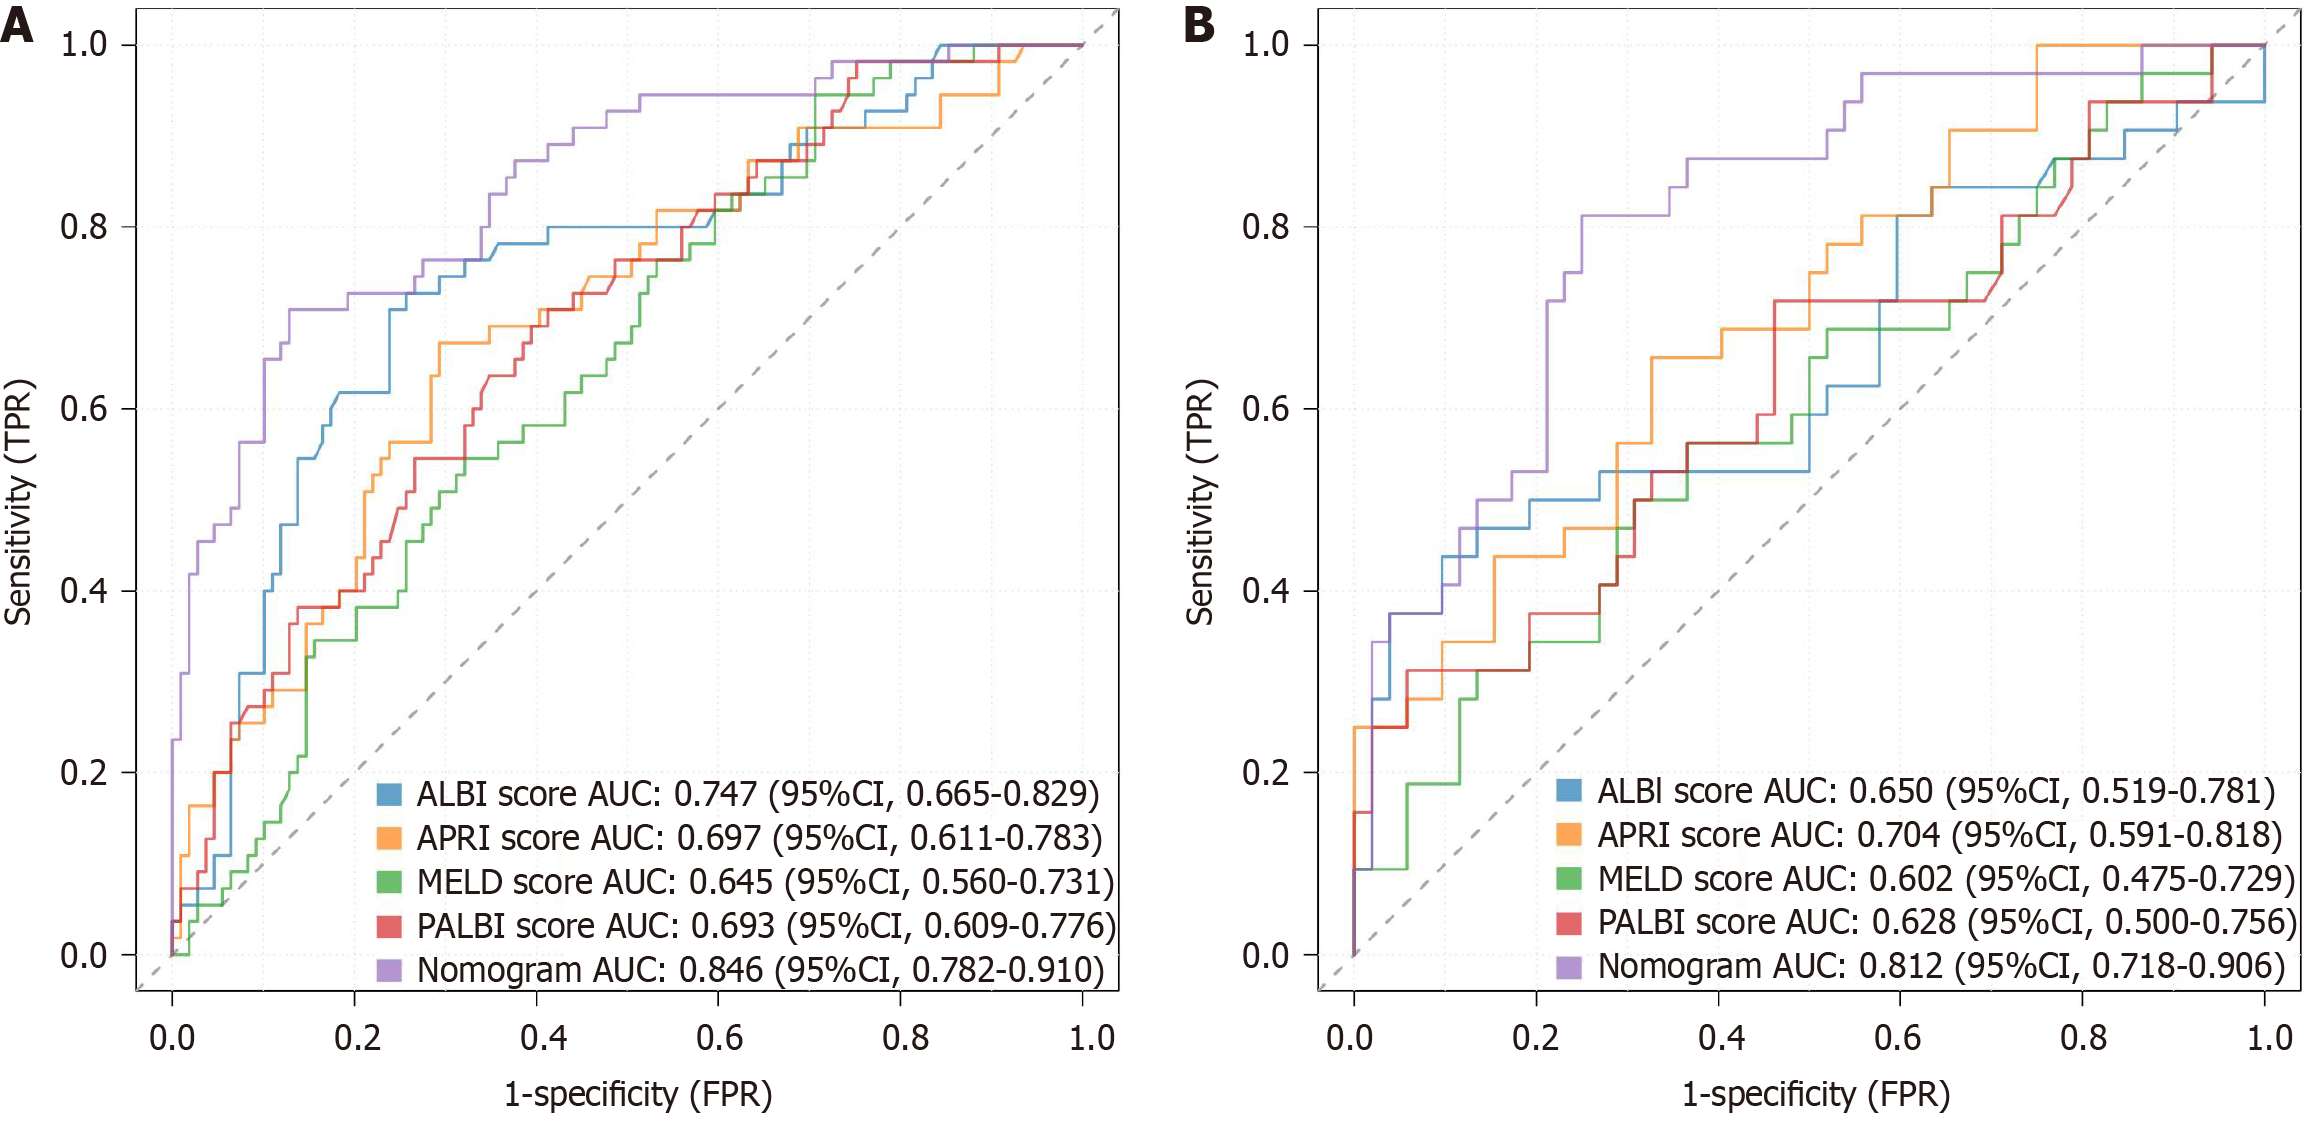
Figure 3 Comparison of receiver operating characteristic curves between the nomogram and the conventional models (aspartate-to-platelet ratio index score, model for end-stage liver disease score, albumin-bilirubin score, and platelet-albumin-bilirubin score) for post-hepatectomy liver failure.
A: The training set; B: The validation set. APRI: Aspartate-to-platelet ratio index; ALBI: Albumin-bilirubin; MELD: Model for end-stage liver disease; PALBI: Platelet-albumin-bilirubin
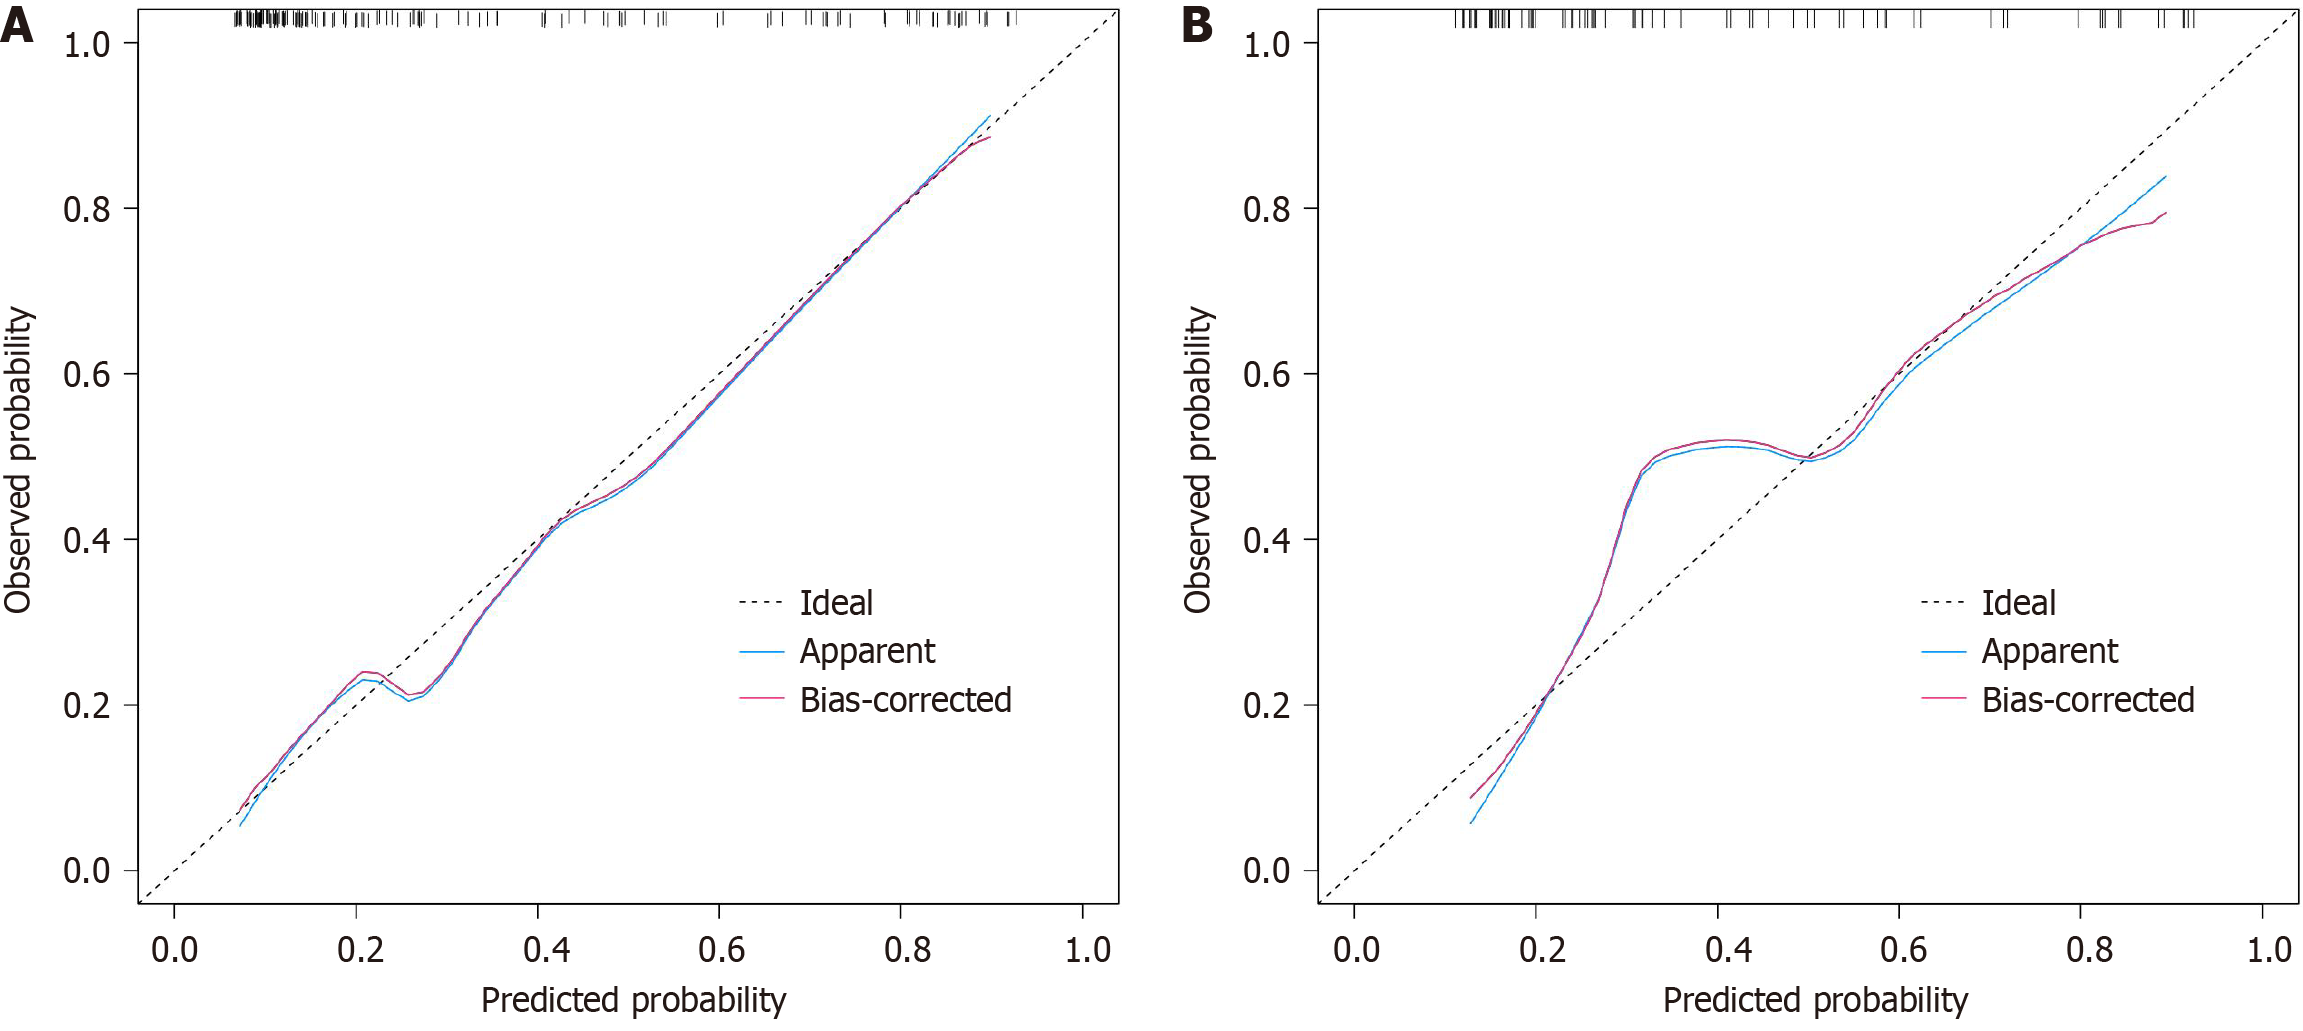
Figure 4 Calibration curve of the nomogram model.
A: The training set; B: The validation set.
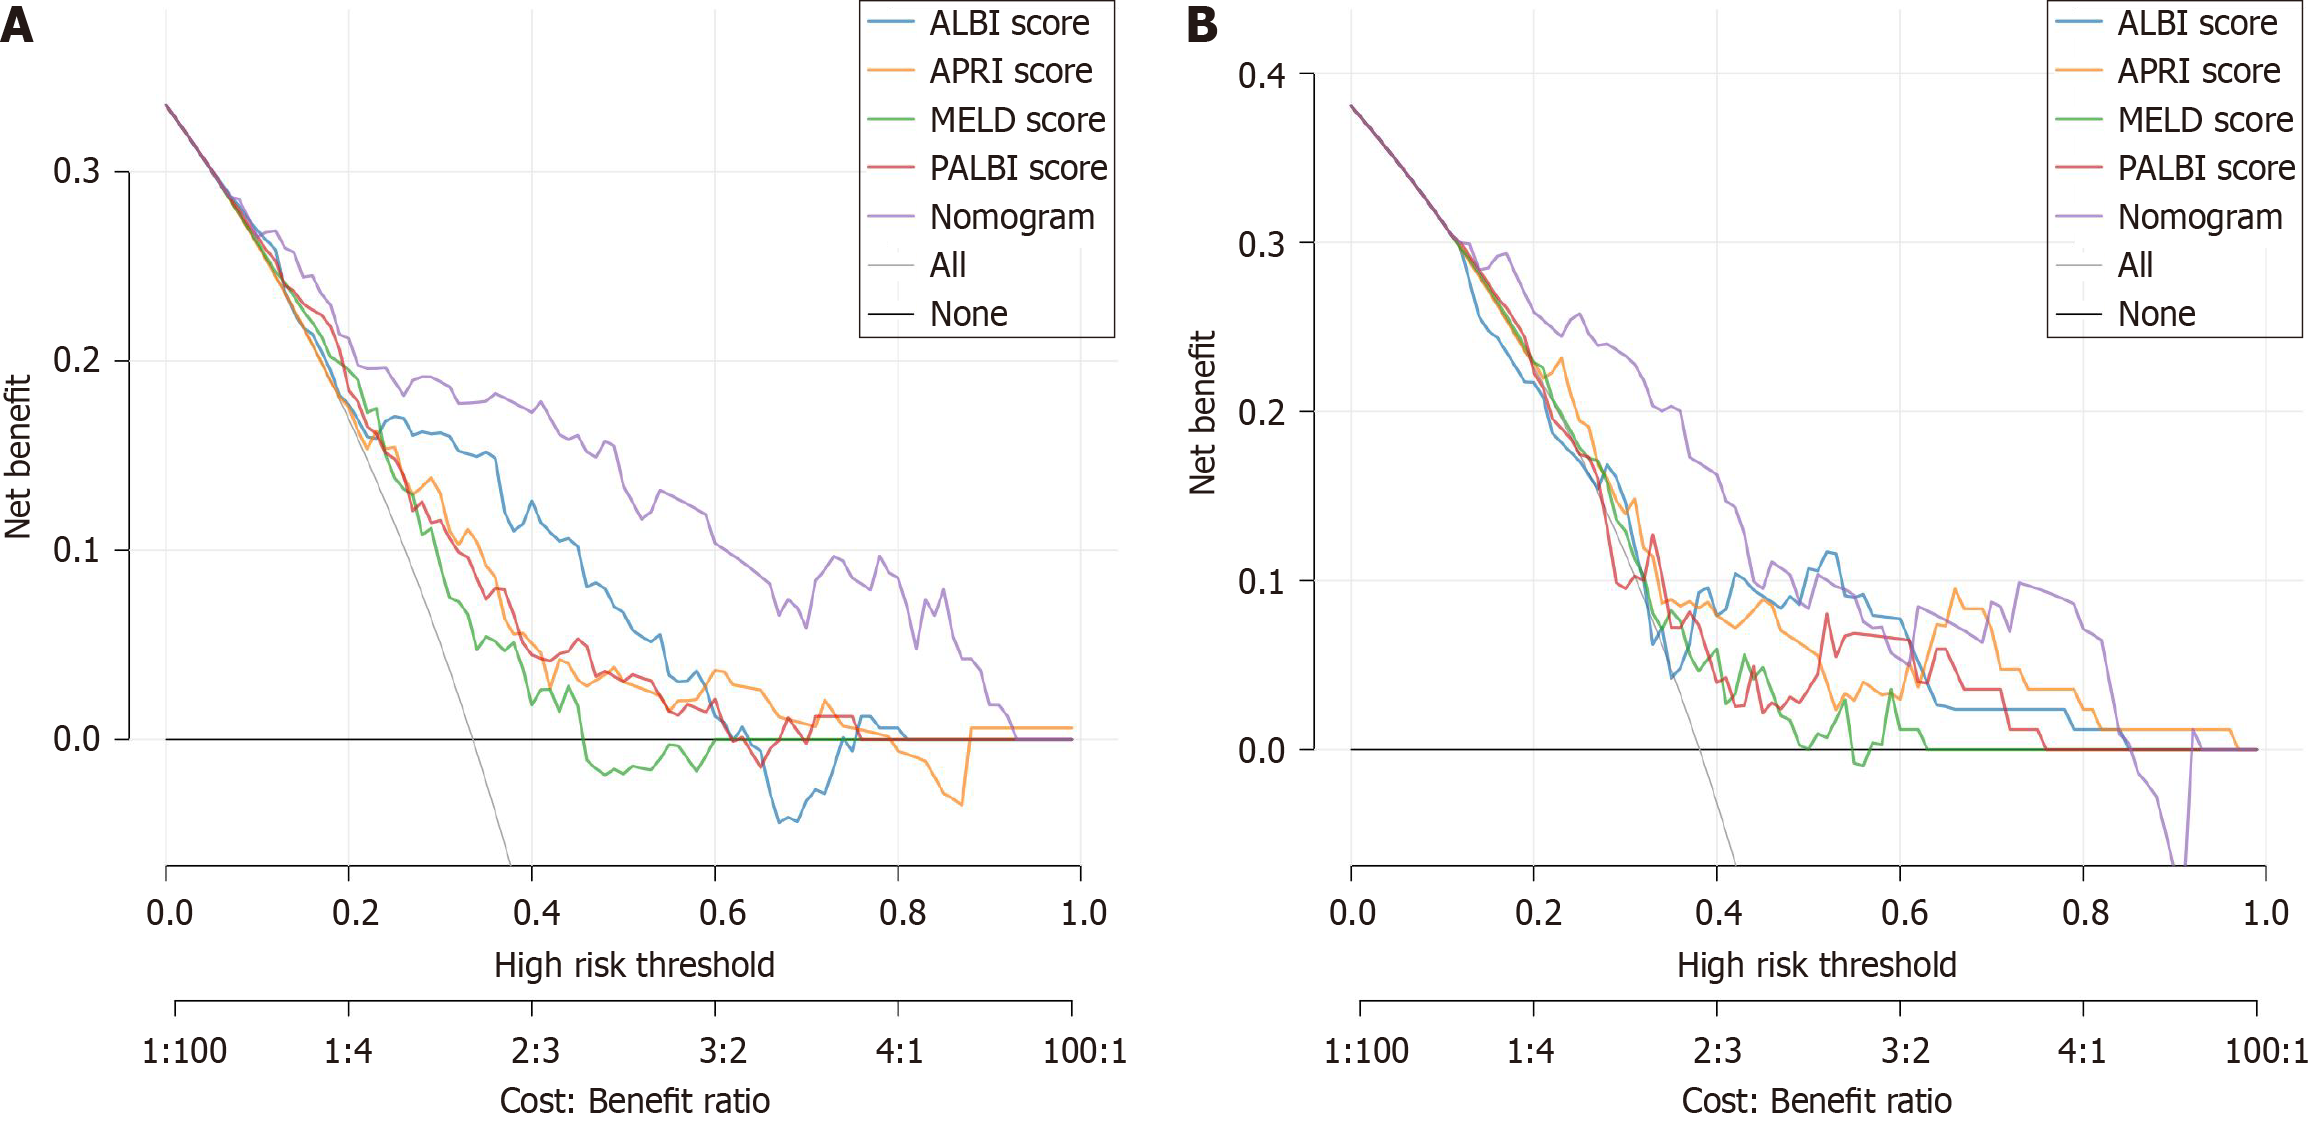
Figure 5 Comparison of decision curve analysis between the nomogram and the conventional models (aspartate-to-platelet ratio index score, model for end-stage liver disease score, albumin-bilirubin score, and platelet-albumin-bilirubin score) for post-hepatectomy liver failure.
A: The training set; B: The validation set. APRI: Aspartate-to-platelet ratio index; ALBI: Albumin-bilirubin; MELD: Model for end-stage liver disease; PALBI: Platelet-albumin-bilirubin.
- Citation: Sun K, Li JB, Chen YF, Zhai ZJ, Chen L, Dong R. Predicting post-hepatectomy liver failure using a nomogram based on portal vein width, inflammatory indices, and the albumin-bilirubin score. World J Gastrointest Surg 2025; 17(2): 99529
- URL: https://www.wjgnet.com/1948-9366/full/v17/i2/99529.htm
- DOI: https://dx.doi.org/10.4240/wjgs.v17.i2.99529


