Copyright
©The Author(s) 2025.
World J Gastrointest Surg. Feb 27, 2025; 17(2): 98578
Published online Feb 27, 2025. doi: 10.4240/wjgs.v17.i2.98578
Published online Feb 27, 2025. doi: 10.4240/wjgs.v17.i2.98578
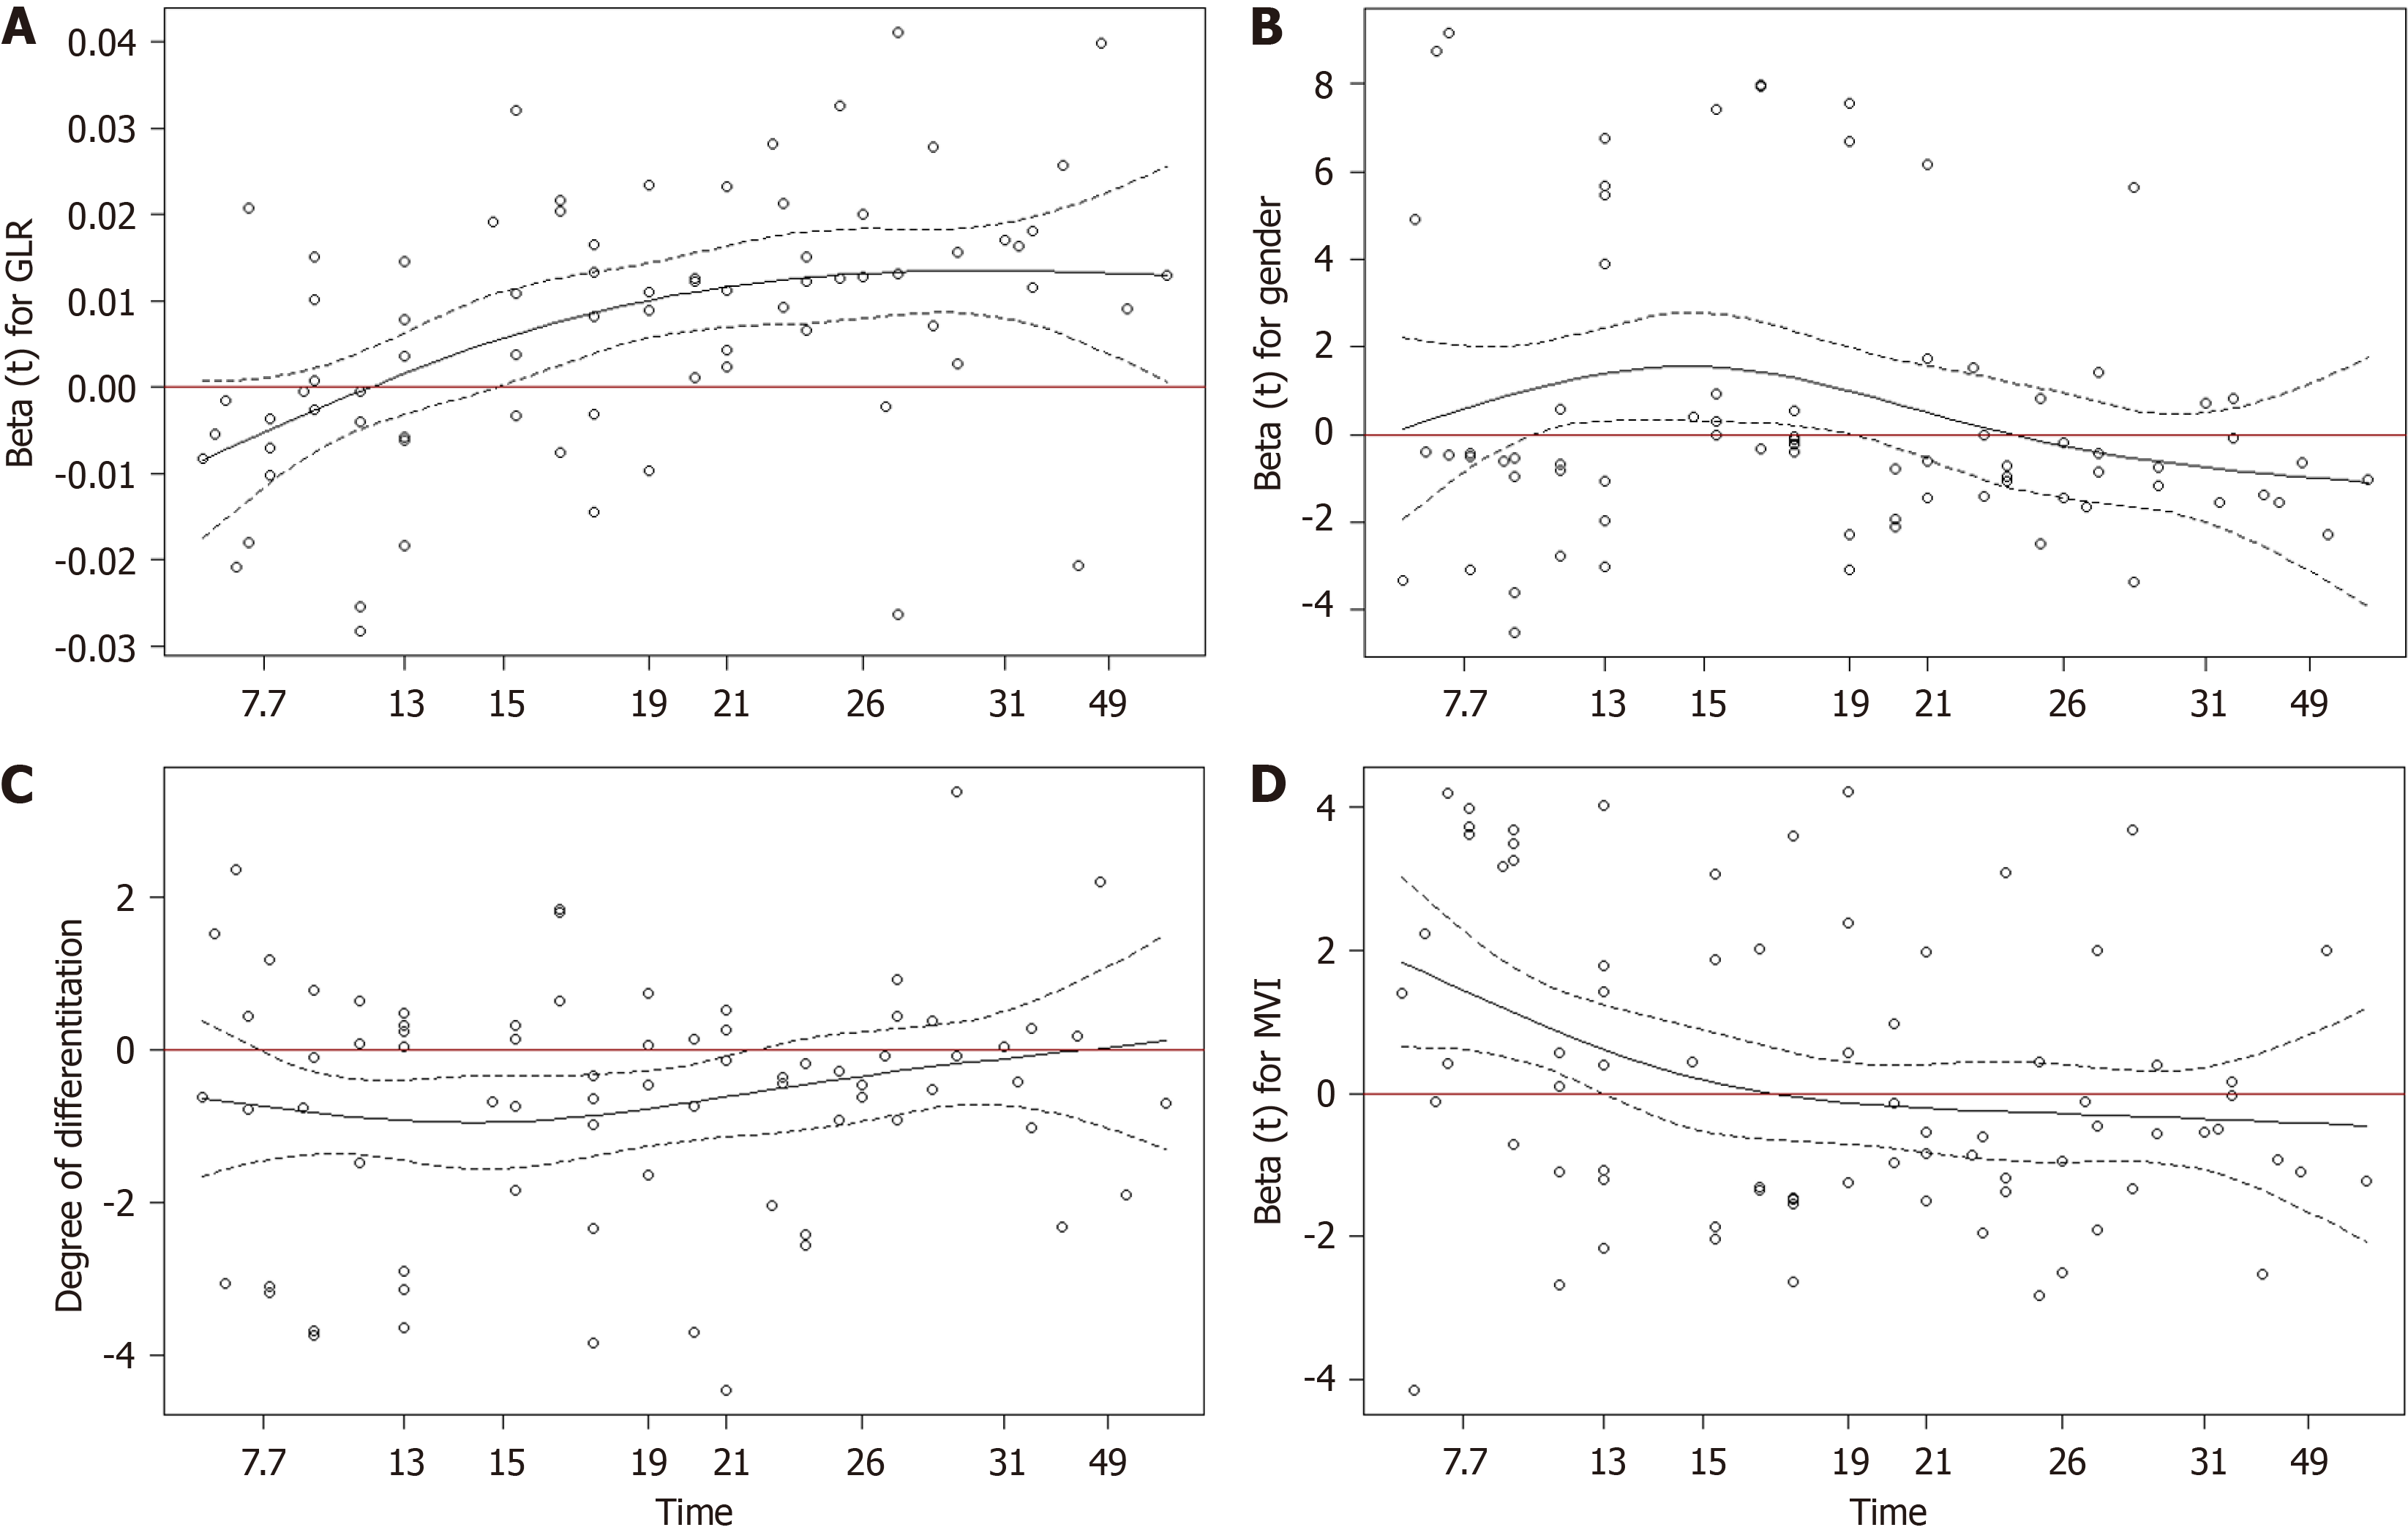
Figure 1 Schoenfeld residual plots.
A: Gamma-glutamyl transferase-to-lymphocyte ratio (GLR); B: Sex; C: Degree of differentiation; D: Microvascular invasion (MVI).
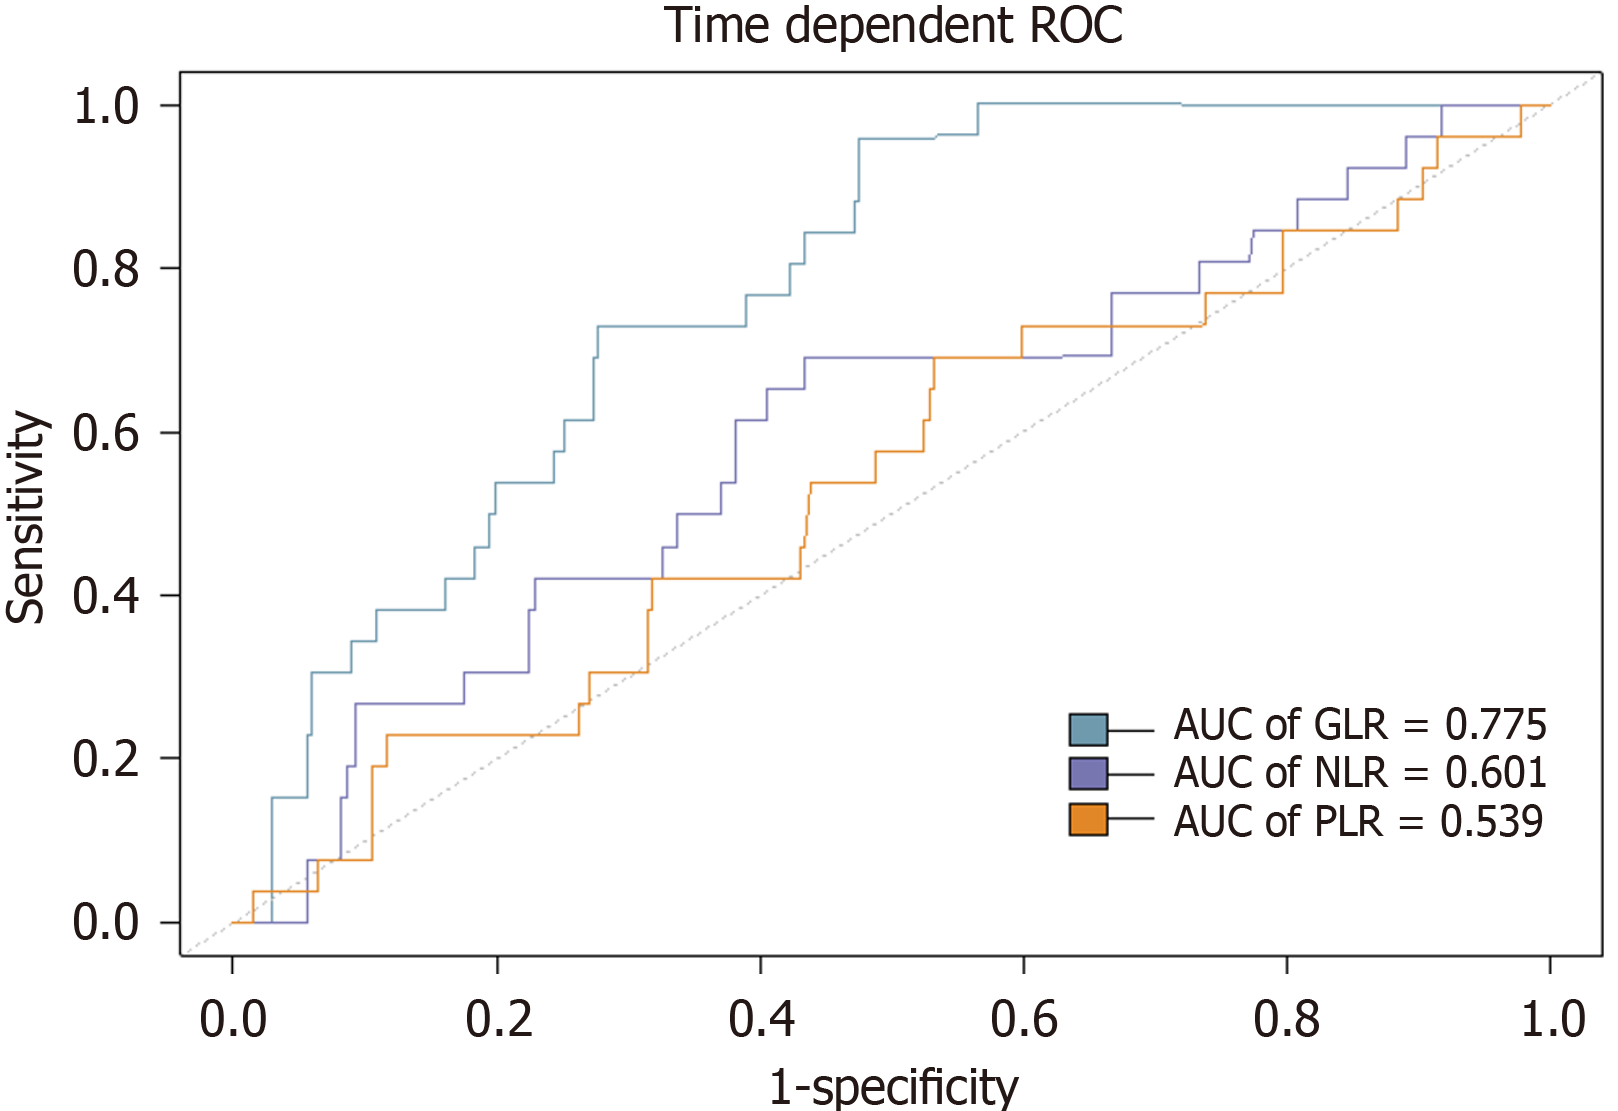
Figure 2 Receiver operating characteristic analysis of gamma-glutamyl transferase-to-lymphocyte ratio, platelet-to-lymphocyte ratio, and neutrophil-to-lymphocyte ratio.
Area under the curve (AUC) for overall survival was 0.775, 0.601, and 0.539 for gamma-glutamyl transferase-to-lymphocyte ratio (GLR), platelet-to-lymphocyte ratio (PLR), and neutrophil-to-lymphocyte ratio (NLR). ROC: Receiver operating characteristic.
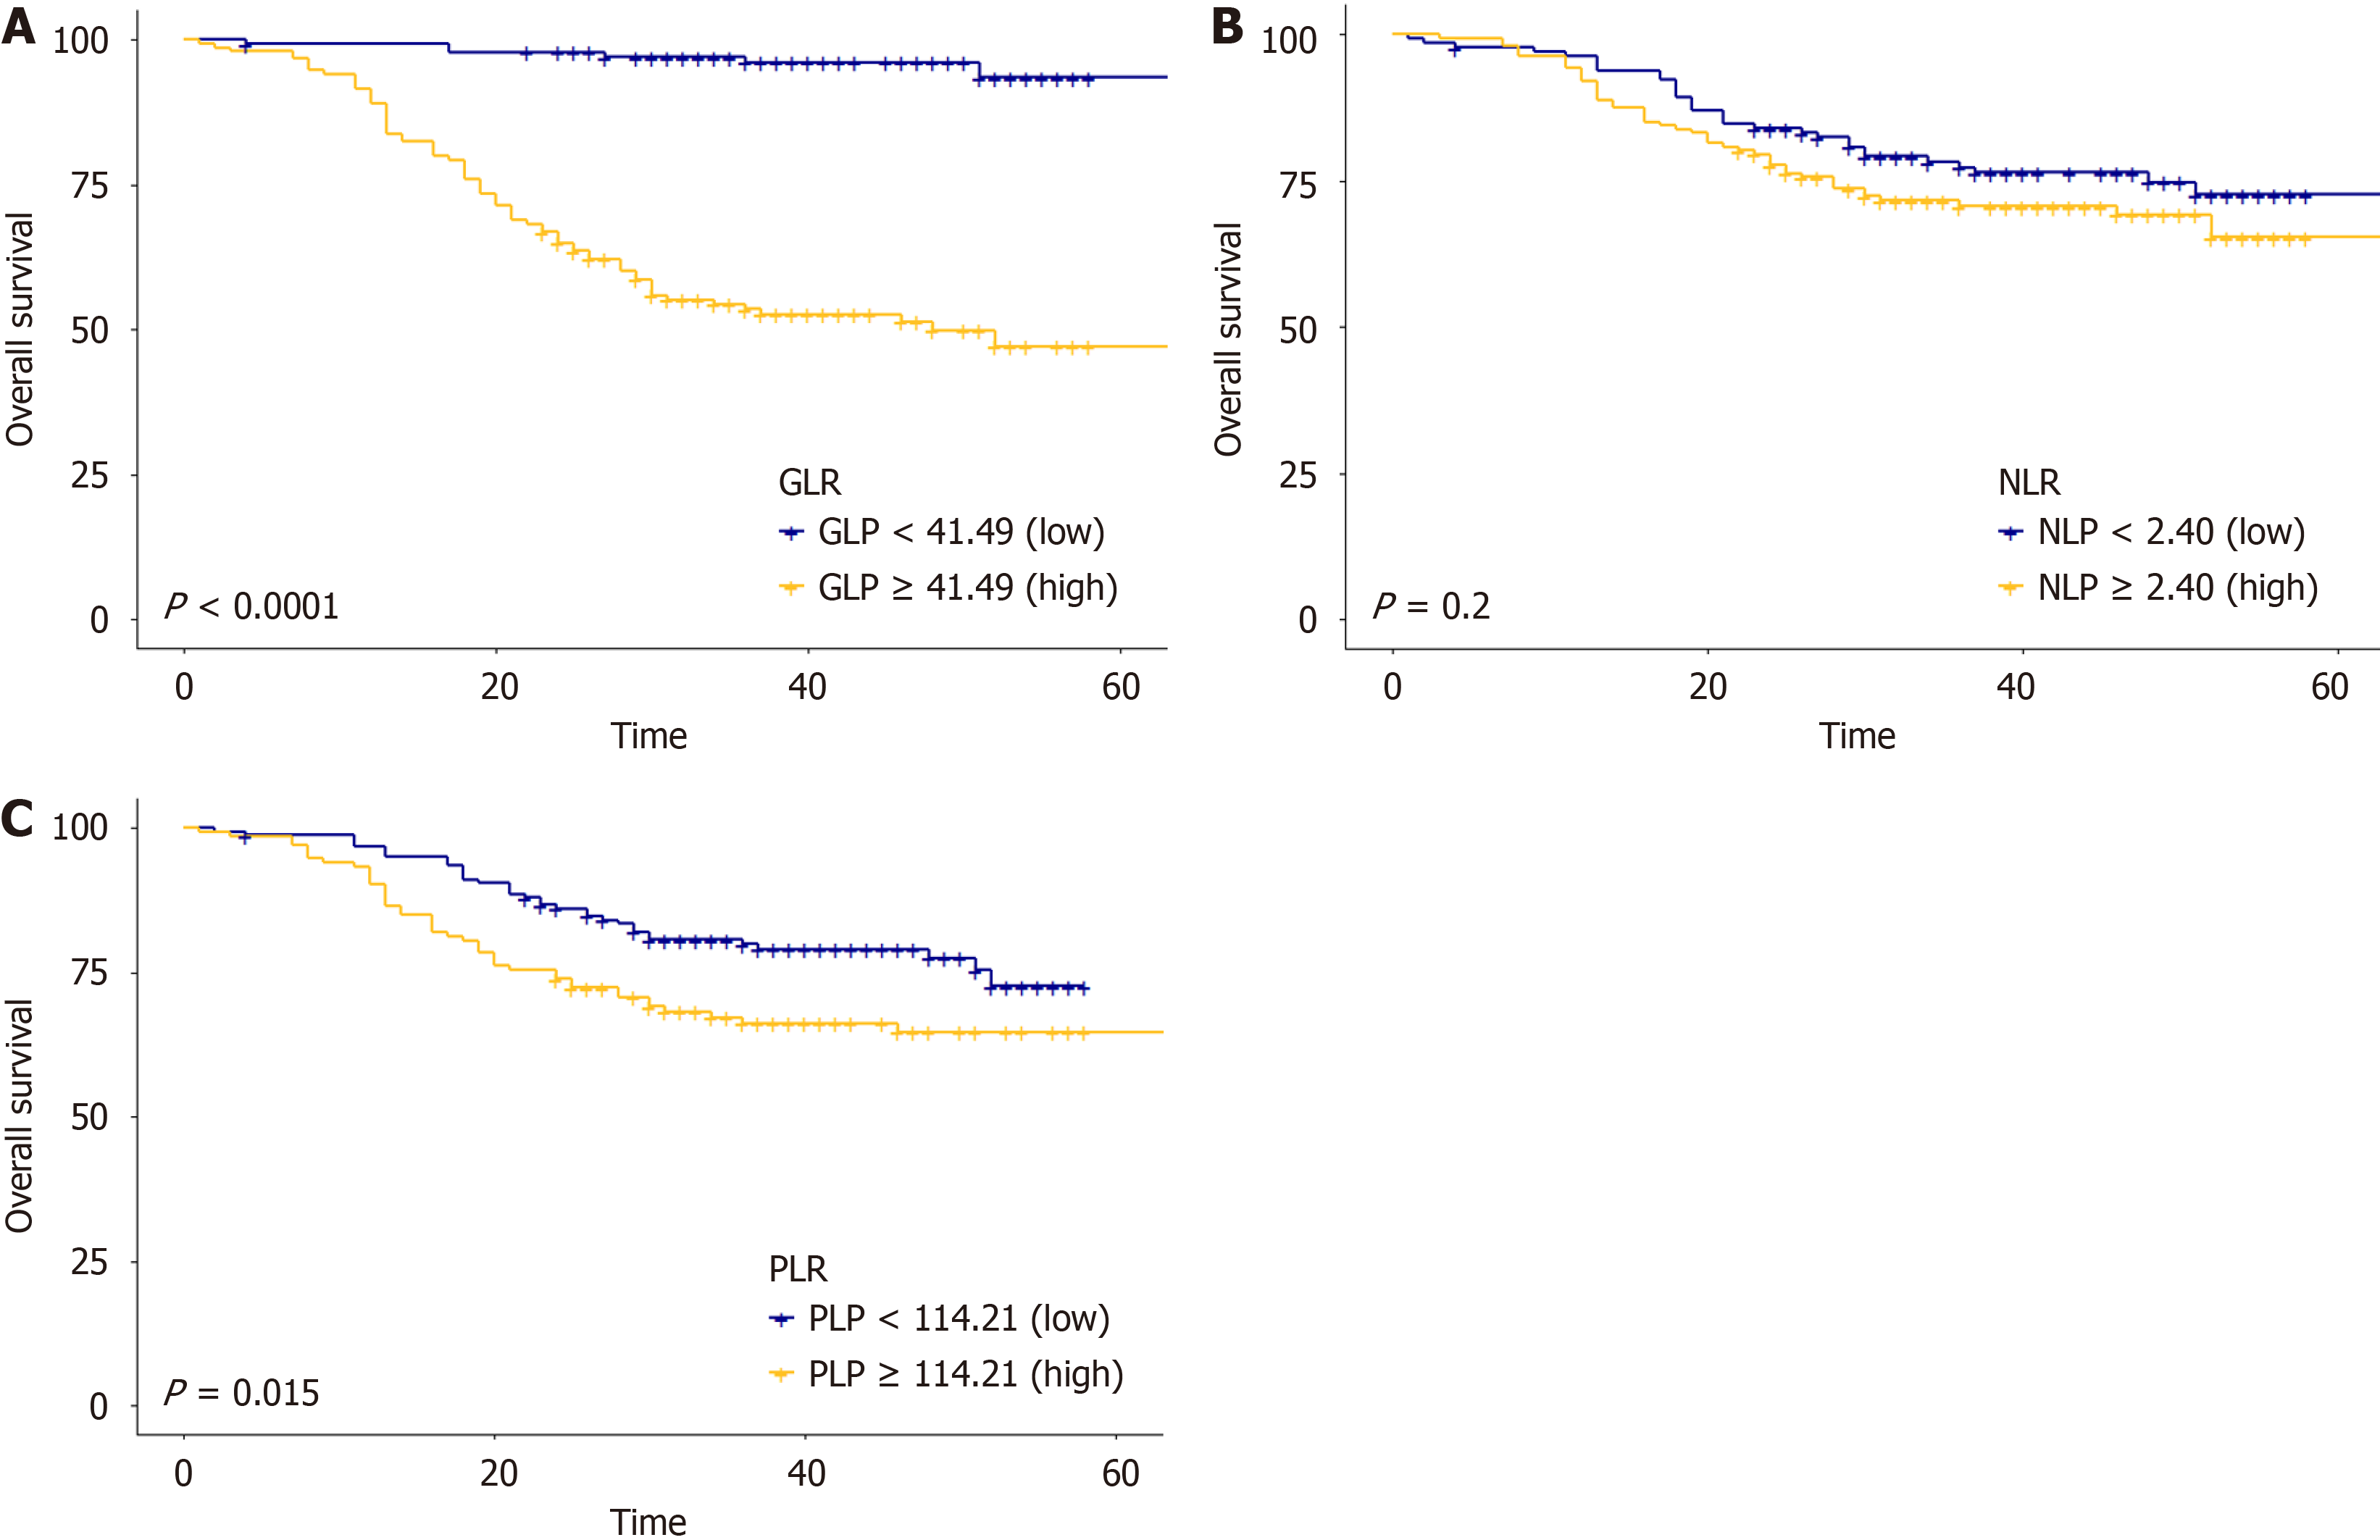
Figure 3 Kaplan-Meier survival curves for overall survival based on gamma-glutamyl transferase-to-lymphocyte ratio, neutrophil-to-lymphocyte ratio, and platelet-to-lymphocyte ratio in patients with hepatocellular carcinoma.
A: Kaplan-Meier curve for overall survival (OS) based on low and high gamma-glutamyl transferase-to-lymphocyte ratio (GLR) groups; B: Kaplan-Meier curve for OS based on low and high neutrophil-to-lymphocyte ratio (NLR) groups; C: Kaplan-Meier curve for OS based on low and high platelet-to-lymphocyte (PLR) ratio groups.
Figure 4 Nomogram for predicting overall survival of patients with hepatocellular carcinoma after curative resection.
GLR: Gamma-glutamyl transferase-to-lymphocyte ratio; MVI: Microvascular invasion; PLR: Platelet-to-lymphocyte ratio; TACE: Transarterial chemoembolization; TBIL: Total bilirubin.
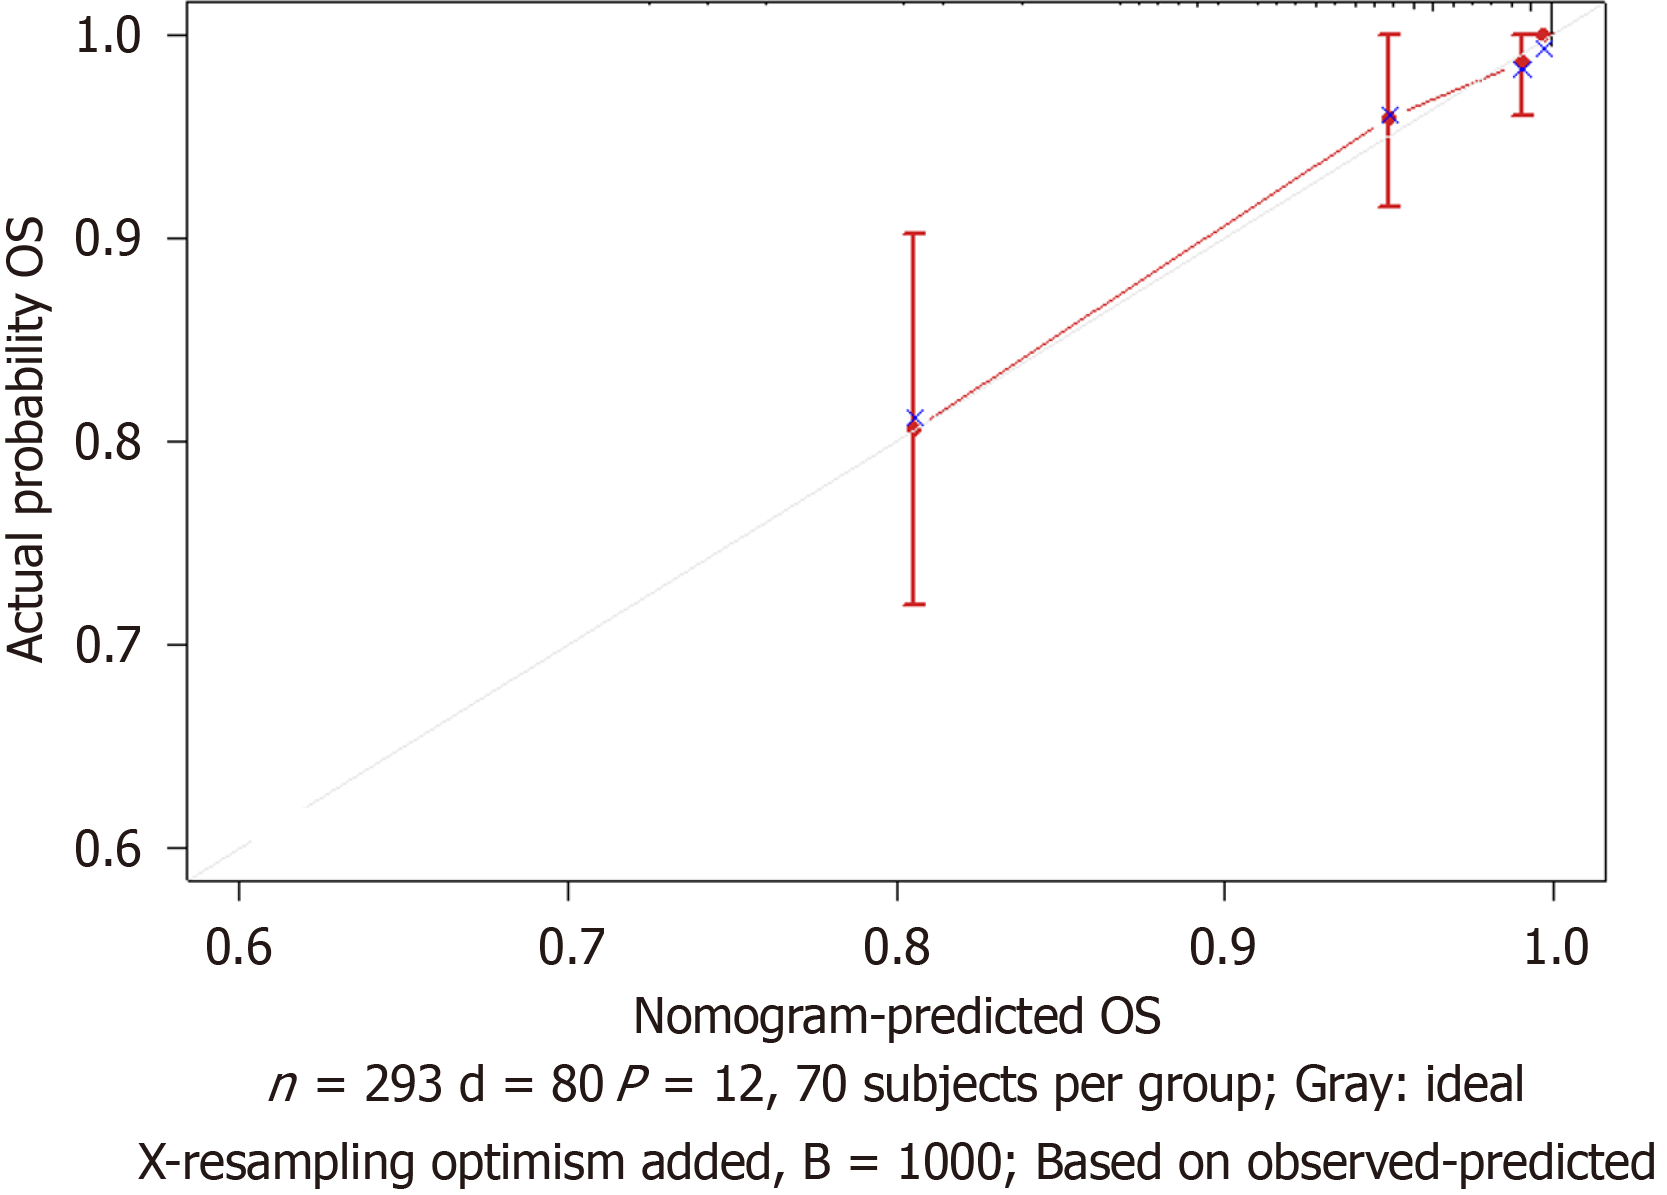
Figure 5 Calibration curve of the prognostic nomogram for overall survival in patients with hepatocellular carcinoma.
The 1-year overall survival (OS) prediction from the nomogram compared with the actual 1-year OS.
- Citation: Zhou PC, Huang R, Wang HT, Yang J, Peng JD, Fu ZX, Liao WJ, Ma HQ, Wu LQ, Li EL. Gamma-glutamyl transferase-to-lymphocyte ratio as a prognostic marker in patients with hepatocellular carcinoma undergoing hepatectomy. World J Gastrointest Surg 2025; 17(2): 98578
- URL: https://www.wjgnet.com/1948-9366/full/v17/i2/98578.htm
- DOI: https://dx.doi.org/10.4240/wjgs.v17.i2.98578


