Copyright
©The Author(s) 2025.
World J Gastrointest Surg. Feb 27, 2025; 17(2): 101897
Published online Feb 27, 2025. doi: 10.4240/wjgs.v17.i2.101897
Published online Feb 27, 2025. doi: 10.4240/wjgs.v17.i2.101897
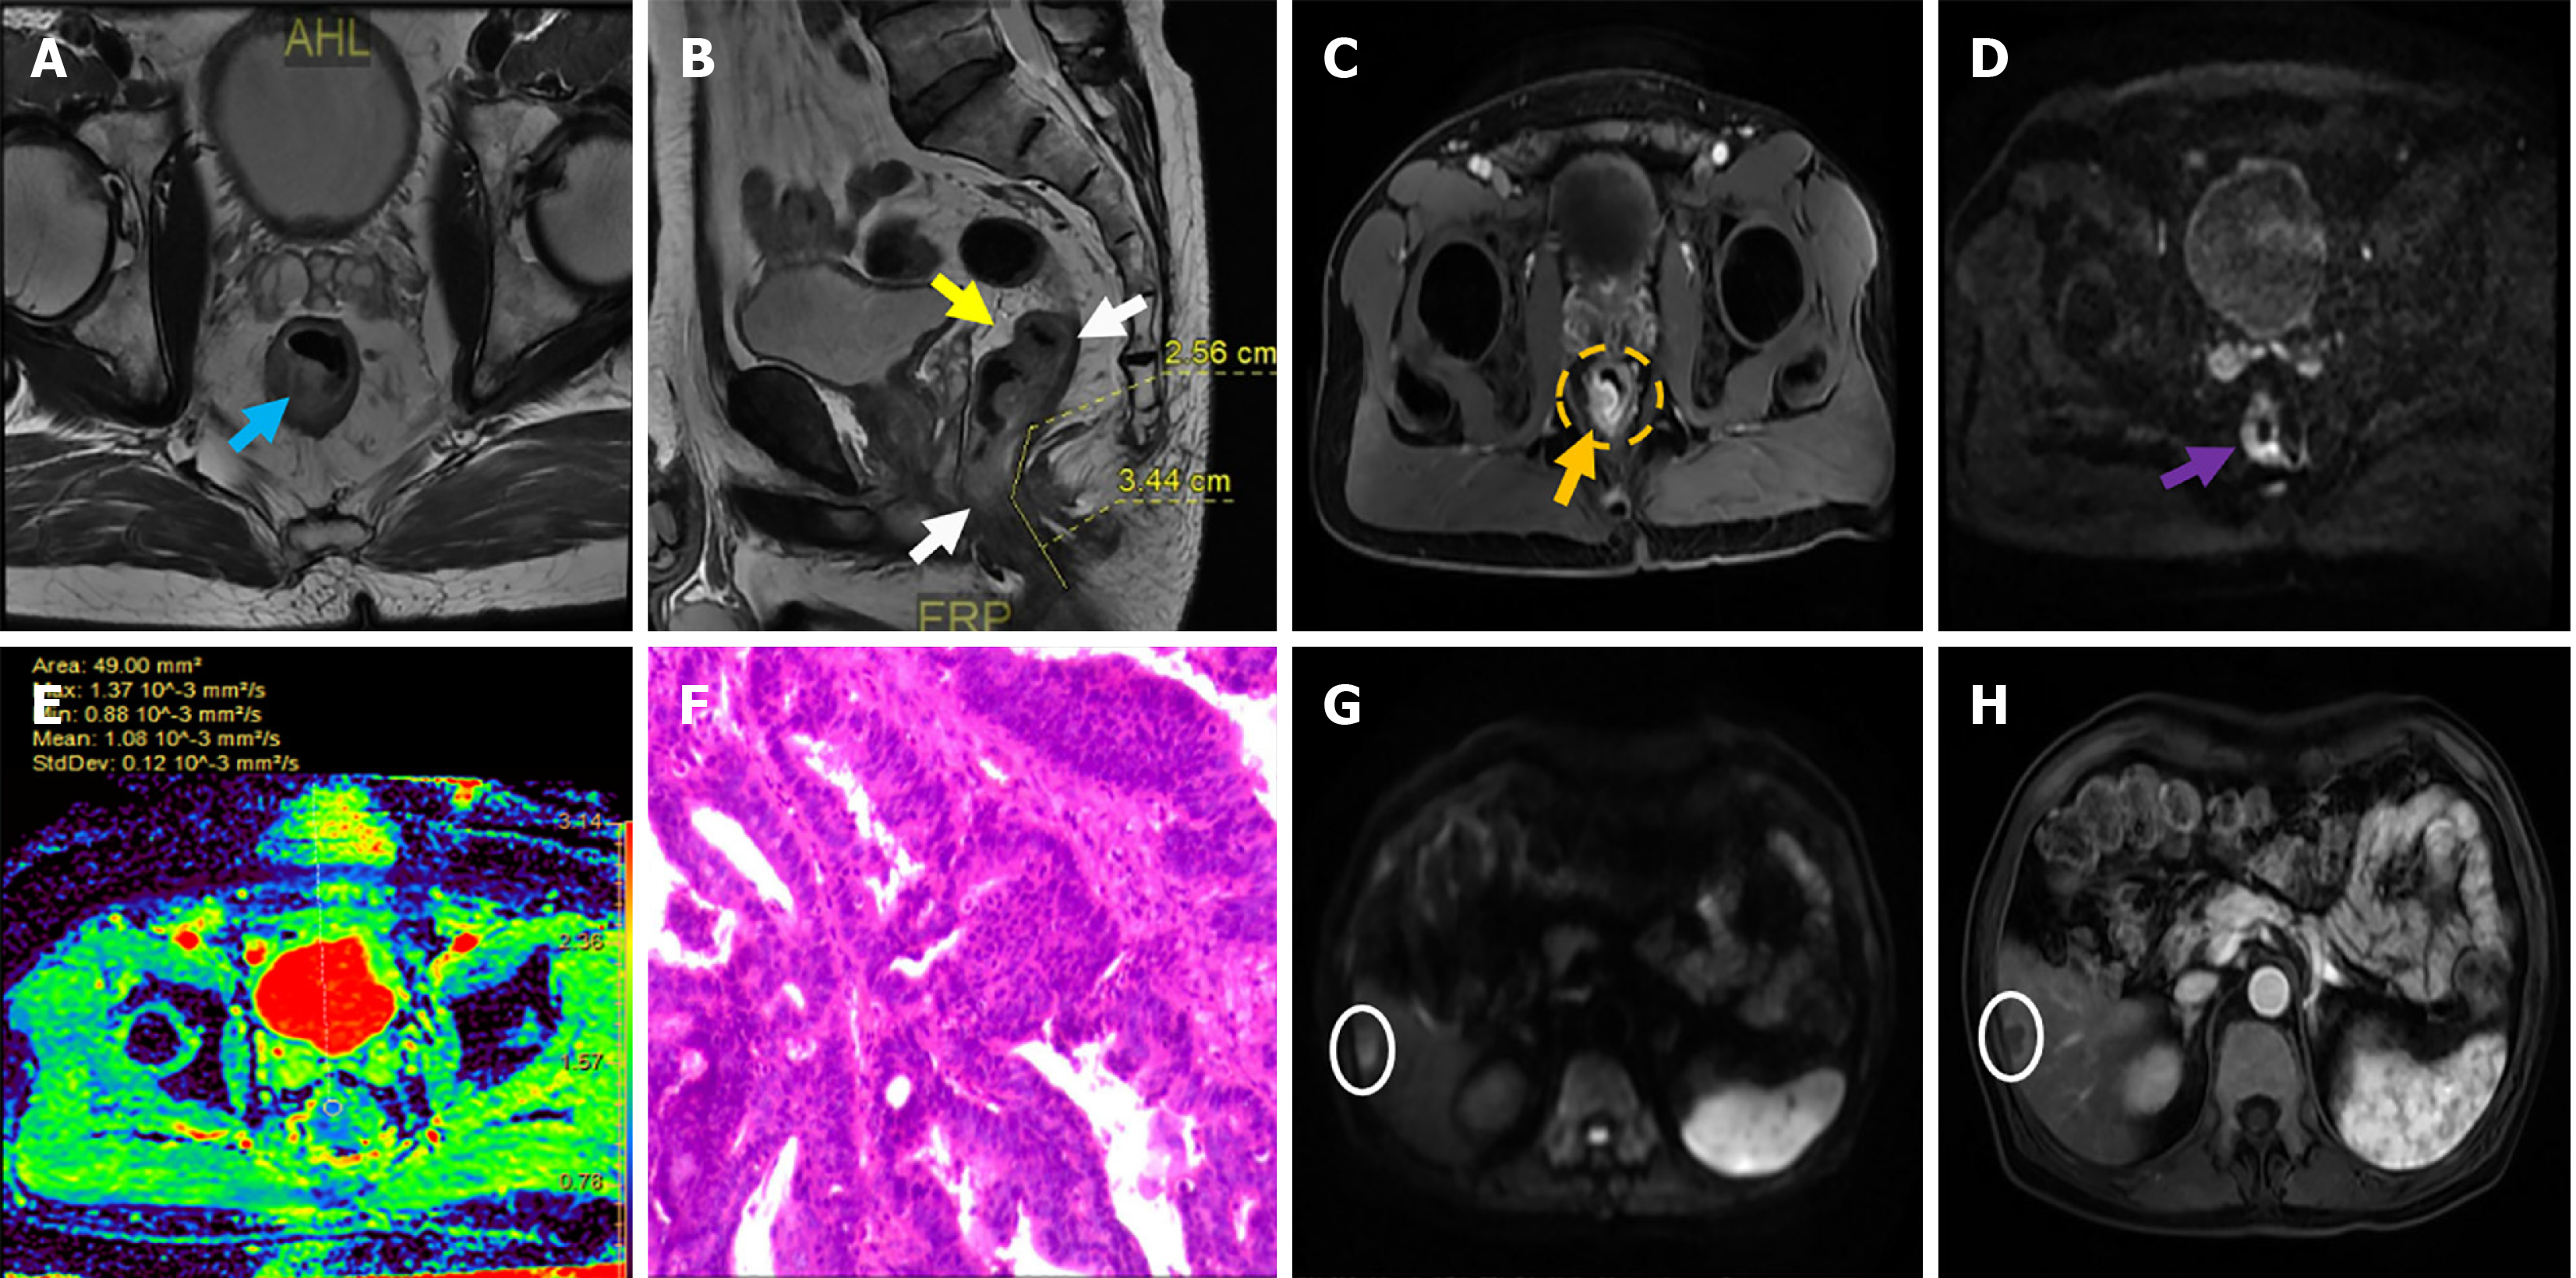
Figure 1 Images of a patient with rectal cancer, a 69-year-old male, and the pathological diagnosis was moderately differentiated adenocarcinoma.
A-C: Median rectal cancer, magnetic resonance stage T3cN0M0, middle and upper rectal tumor, involving about 2/3 of the peri-intestinal tract (blue arrow), the lower margin was about 6.0 cm from the anal margin (white arrow), peritoneal reflexion showed no invasion (yellow arrow), mass invaded the serosal layer (orange arrow), circumferential resection margin and extramural vascular invasion were negative, and perianal complex showed no invasion (yellow dotted circle); D and E: Diffusion-weighted imaging (b = 1000s/mm), the lesion showed a high signal (purple arrow), apparent diffusion coefficient diagram, the lesion presents a low signal, apparent diffusion coefficient value is 1.08 × 10⁻³ mm2/second (black bold arrow); F: The pathological findings showed a moderately differentiated adenocarcinoma of the rectum with no definite vasculature and nerve invasion, negative incisal margins at both ends and negative mesenteric lymph nodes. Immunohistochemical findings showed cancer cells CK (+), CD20 (+), MLH1 (+), MSH6 (+), MSH2 (+), PMS2 (+), Her-2 (-), Ki-67 (+, 70%); G and H: Postoperative follow-up of abdominal magnetic resonance imaging, a nodule in the right lobe of the liver, with limited diffusion on diffusion-weighted imaging, showing circular enhancement after enhancement (white circles), confirmed by biopsy pathology as liver metastasis.
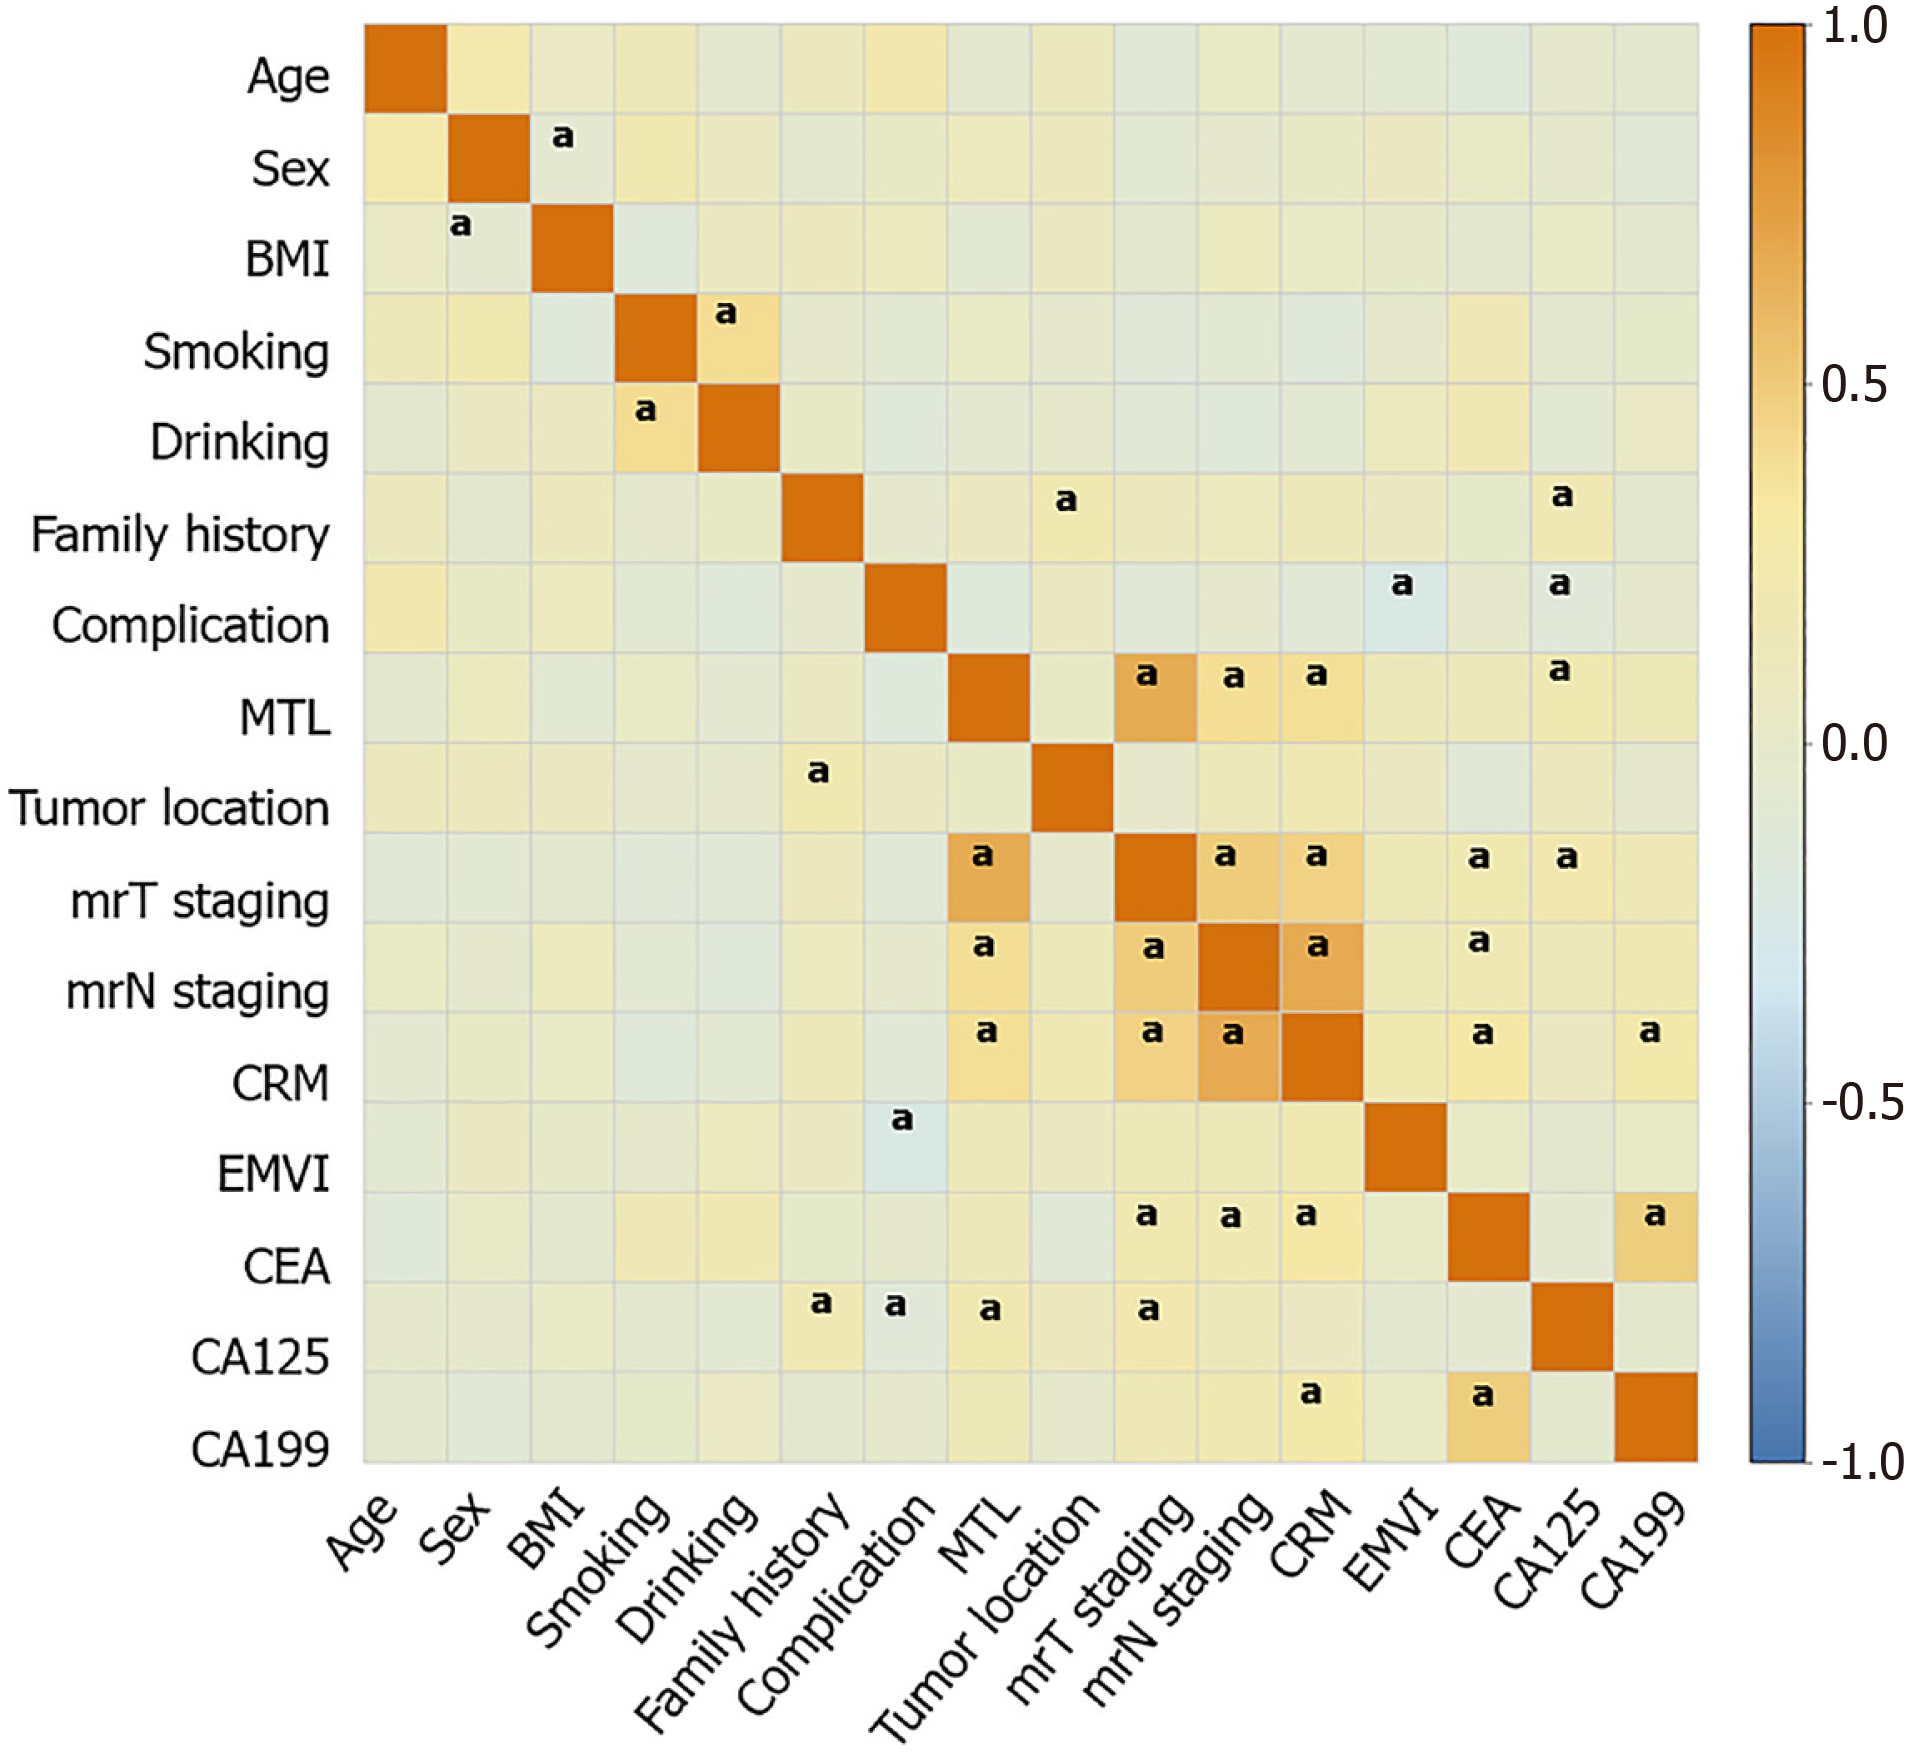
Figure 2 Correlation heat maps of demographic features, magnetic resonance imaging features, and levels of tumor markers of patients after rectal cancer surgery.
aP < 0.05. BMI: Body mass index; MTL: Maximum tumor length; mrT staging: Magnetic resonance based T staging; mrN staging: Magnetic resonance based N staging; CRM: Circumferential resection margin; EMVI: Extramural vascular invasion; CEA: Carcinoembryonic antigen; CA: Carbohydrate antigen.
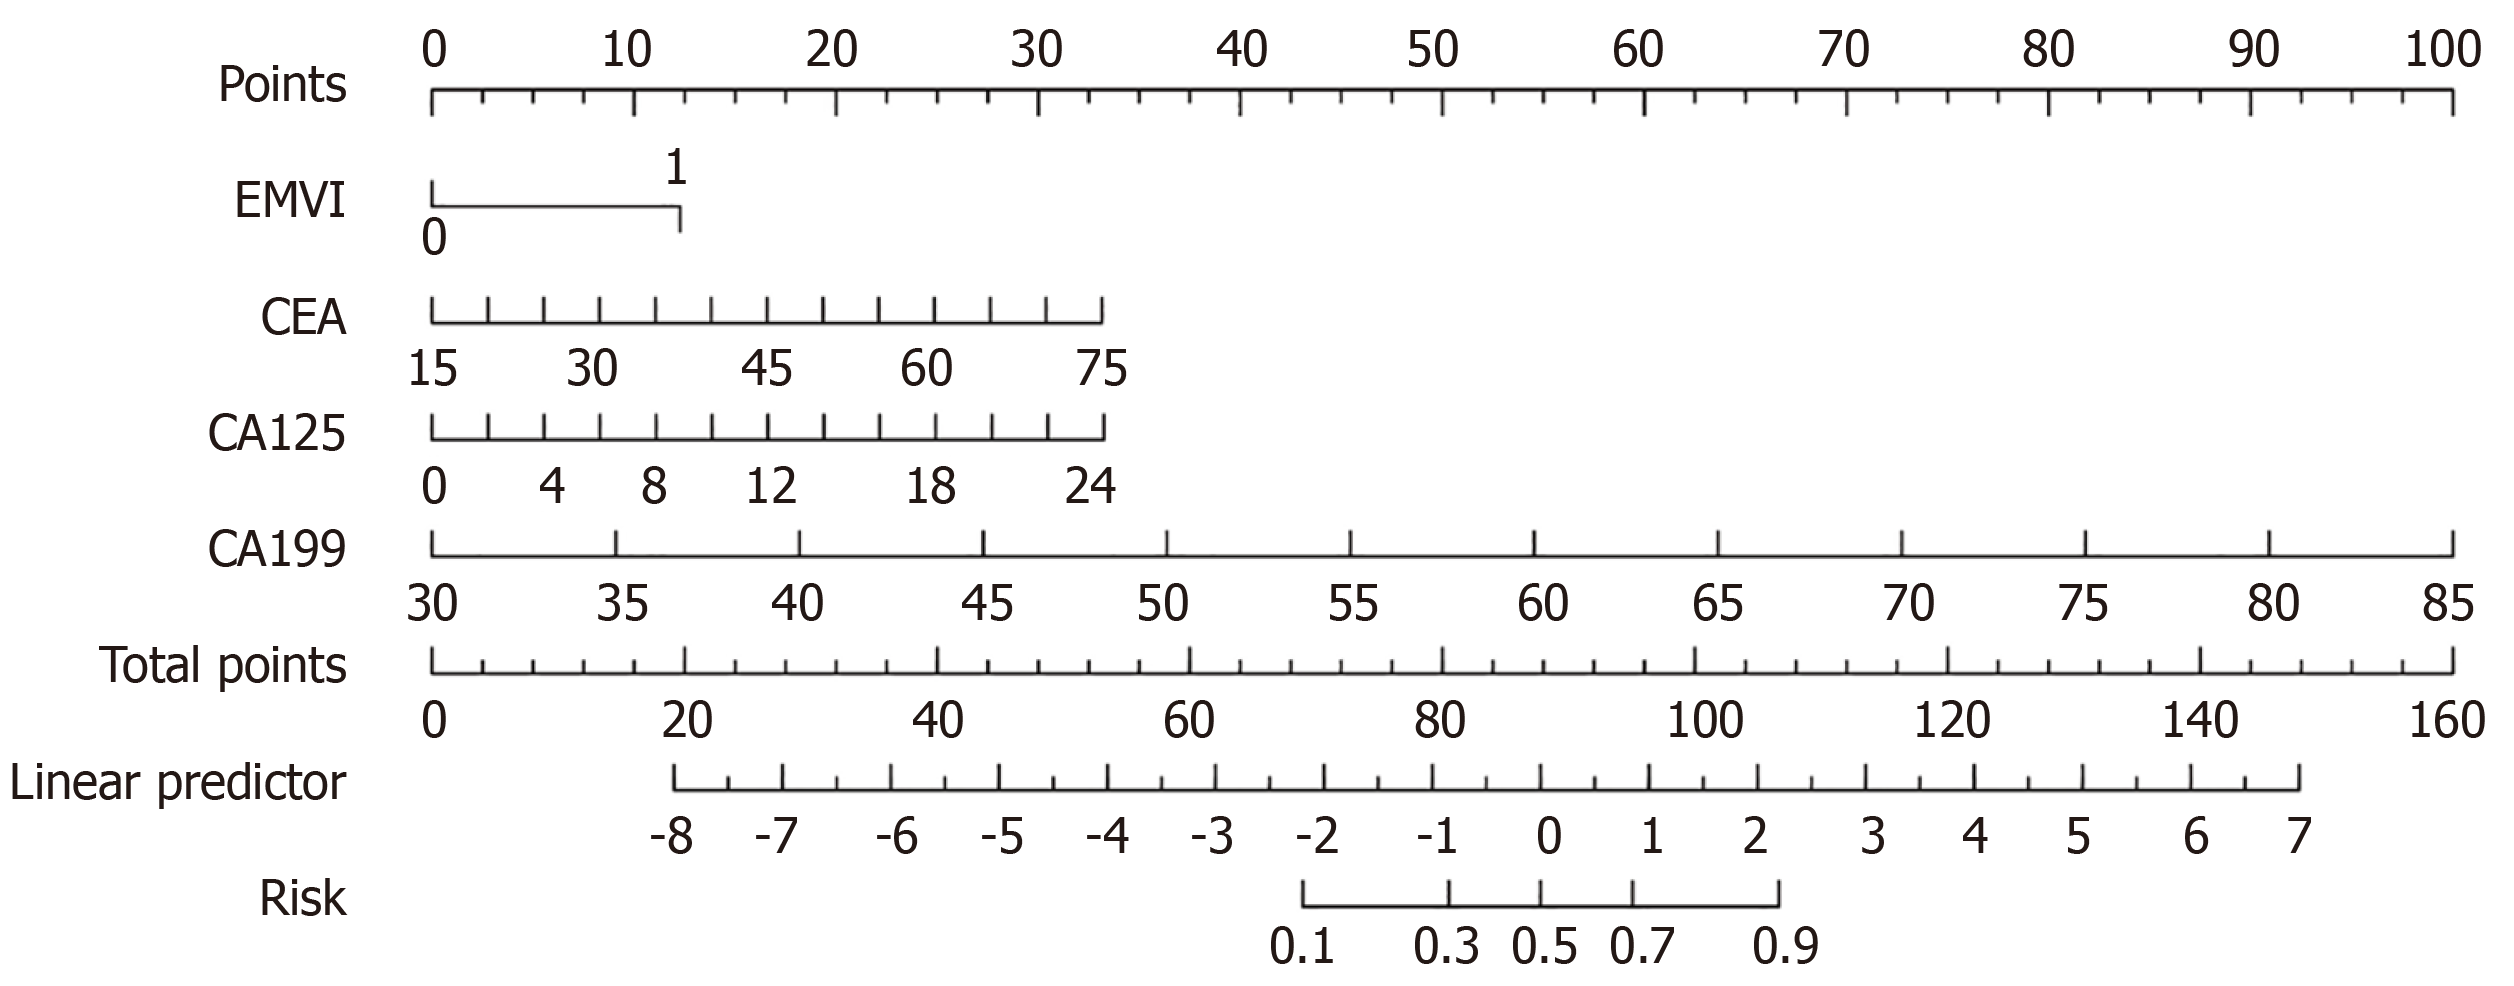
Figure 3 A clinical predictive model for predicting postoperative risk in patients with rectal cancer.
EMVI: Extramural vascular invasion; CEA: Carcinoembryonic antigen; CA: Carbohydrate antigen.
Figure 4 Evaluation of clinical predictive models.
A: Receiver operating characteristic curve analysis; B: Calibration curve and Hosmer-Lemeshow goodness of fit test; C: Decision curve analysis curve. AUC: Area under the curve.
- Citation: Wu L, Zhu JJ, Liang XH, Tong H, Song Y. Predictive value of magnetic resonance imaging parameters combined with tumor markers for rectal cancer recurrence risk after surgery. World J Gastrointest Surg 2025; 17(2): 101897
- URL: https://www.wjgnet.com/1948-9366/full/v17/i2/101897.htm
- DOI: https://dx.doi.org/10.4240/wjgs.v17.i2.101897


