Copyright
©The Author(s) 2025.
World J Gastrointest Surg. Feb 27, 2025; 17(2): 100237
Published online Feb 27, 2025. doi: 10.4240/wjgs.v17.i2.100237
Published online Feb 27, 2025. doi: 10.4240/wjgs.v17.i2.100237
Figure 1 Overview of study design.
SCD: Stearoyl-coenzyme A desaturase; CRC: Colorectal cancer; NC: Nitidine chloride; GEO: Gene Expression Omnibus; GTEx: Genotype-Tissue Expression; SRA: Sequence Read Archive; TCGA: The Cancer Genome Atlas.
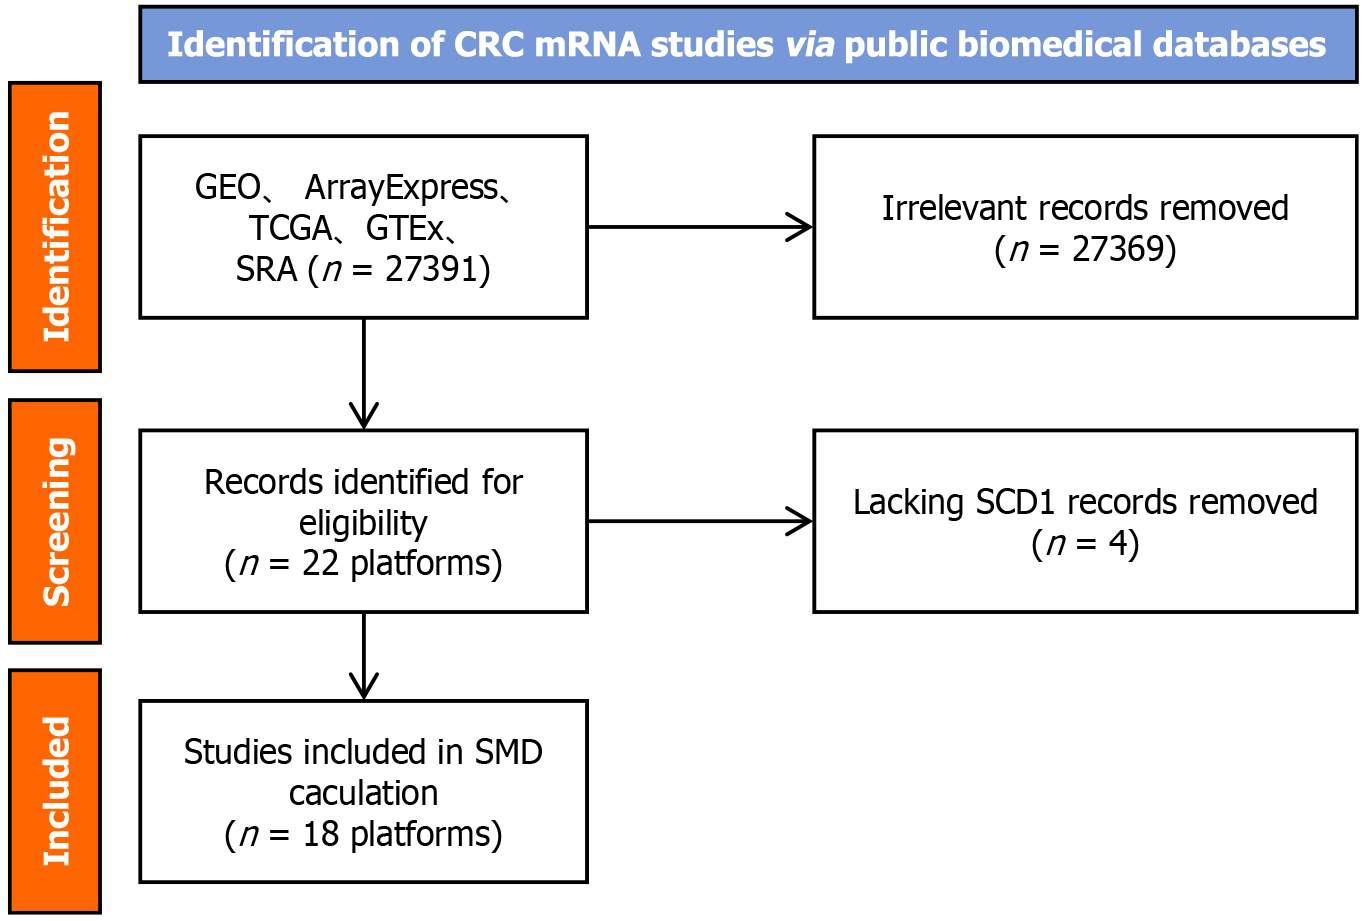
Figure 2 Schematic representation of the screening procedure for the stearoyl-coenzyme A desaturase mRNA dataset.
CRC: Colorectal cancer; SCD: Stearoyl-coenzyme A desaturase; GEO: Gene Expression Omnibus; GTEx: Genotype-Tissue Expression; SRA: Sequence Read Archive; TCGA: The Cancer Genome Atlas; SMD: Standardized mean difference.
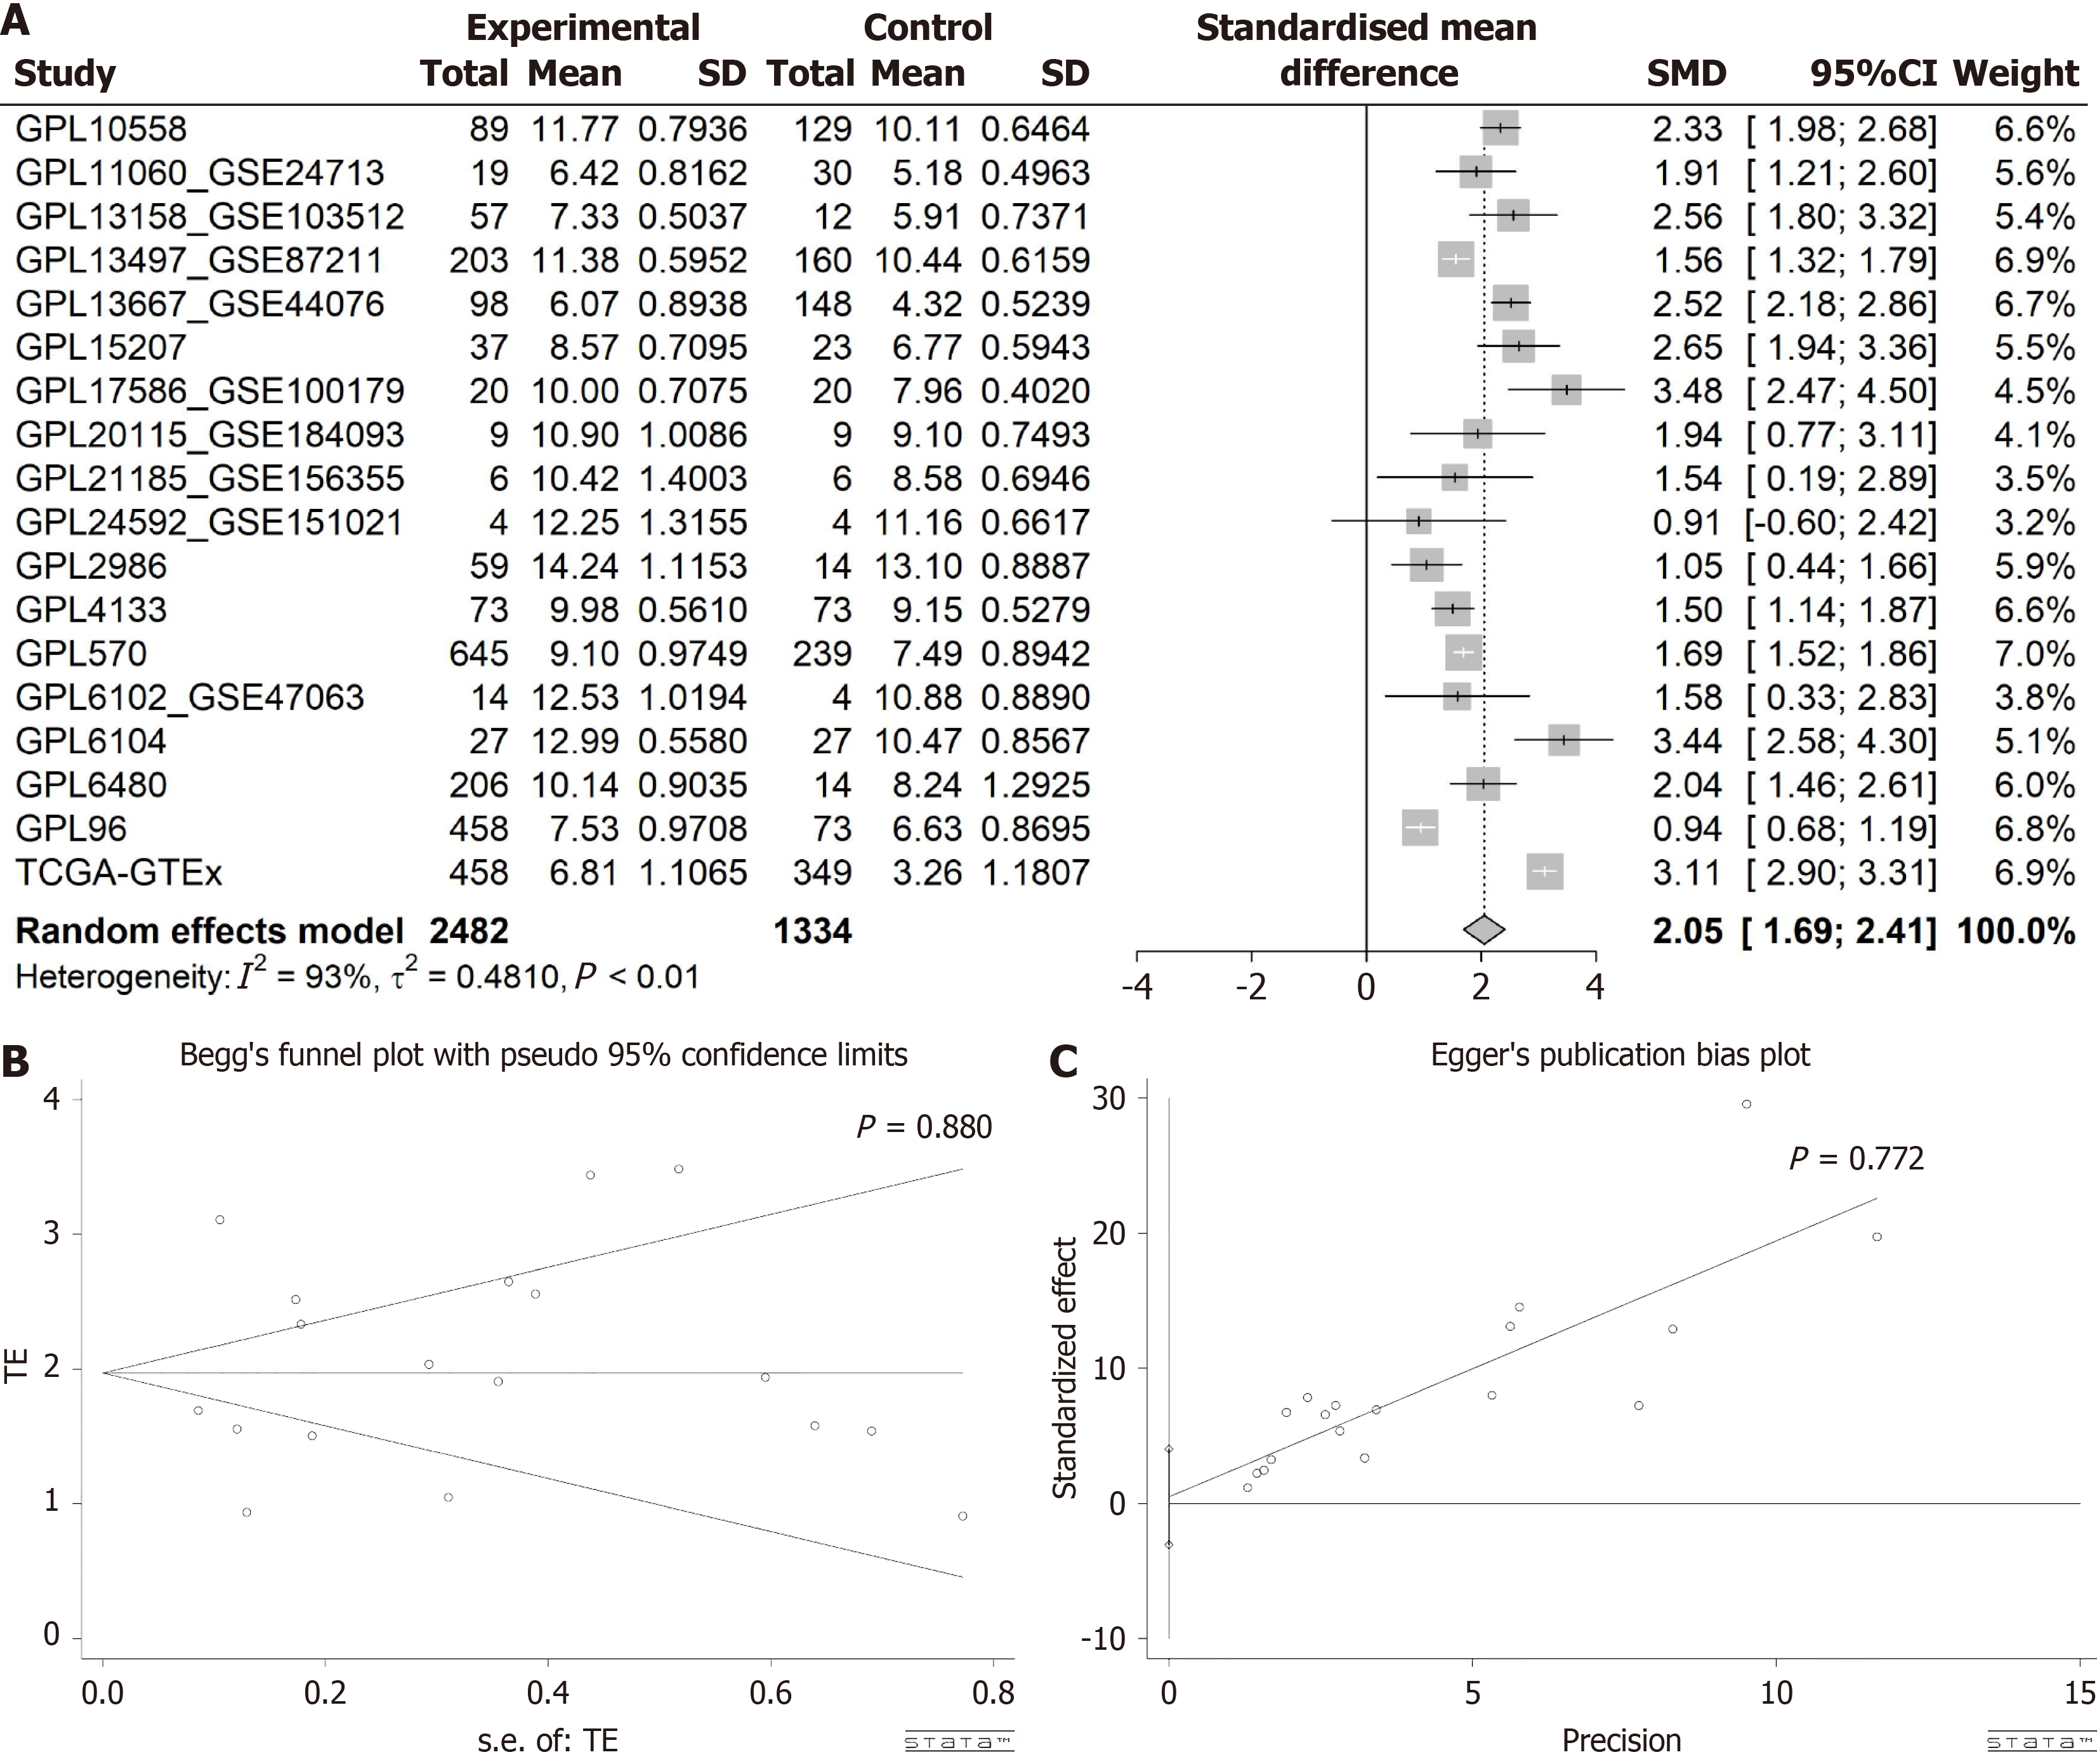
Figure 3 Evaluation of stearoyl-coenzyme A desaturase expression in colorectal cancer.
A: Forest plot depicting elevated stearoyl-coenzyme A desaturase expression in colorectal cancer vs normal colorectal tissue; B and C: Outcomes of Egger’s and Begg’s tests indicating absence of publication bias. GTEx: Genotype-Tissue Expression; TCGA: The Cancer Genome Atlas; SMD: Standardized mean difference; CI: Confidence interval.
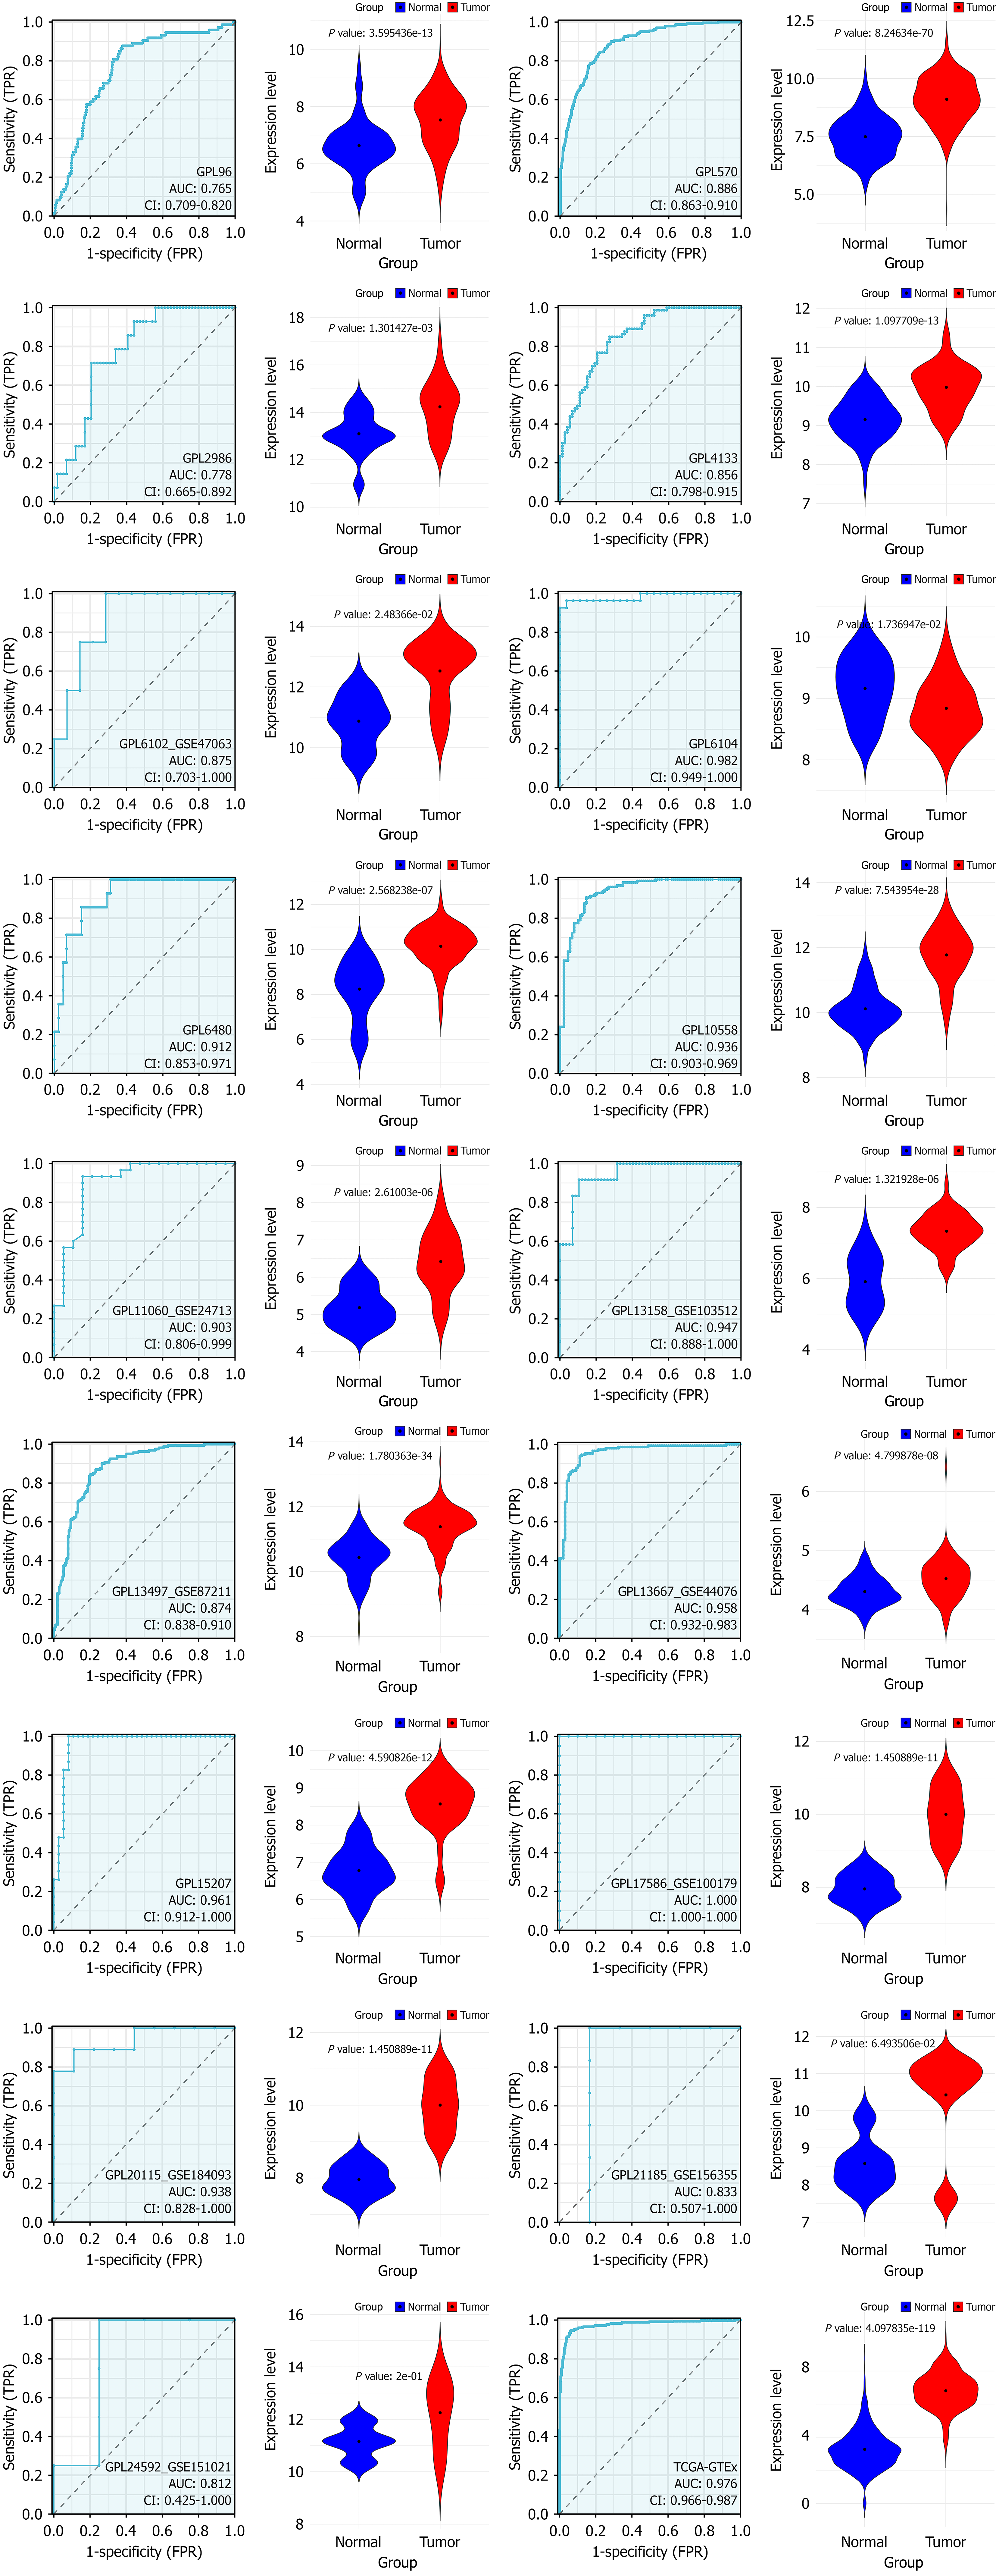
Figure 4 Violin plots illustrating differences in stearoyl-coenzyme A desaturase expression between colorectal cancer samples (red) and non-colorectal cancer samples (blue) across chosen datasets.
Statistical significance confirmed at P < 0.05 (continued). TPR: True positive rate; FPR: False positive rate.
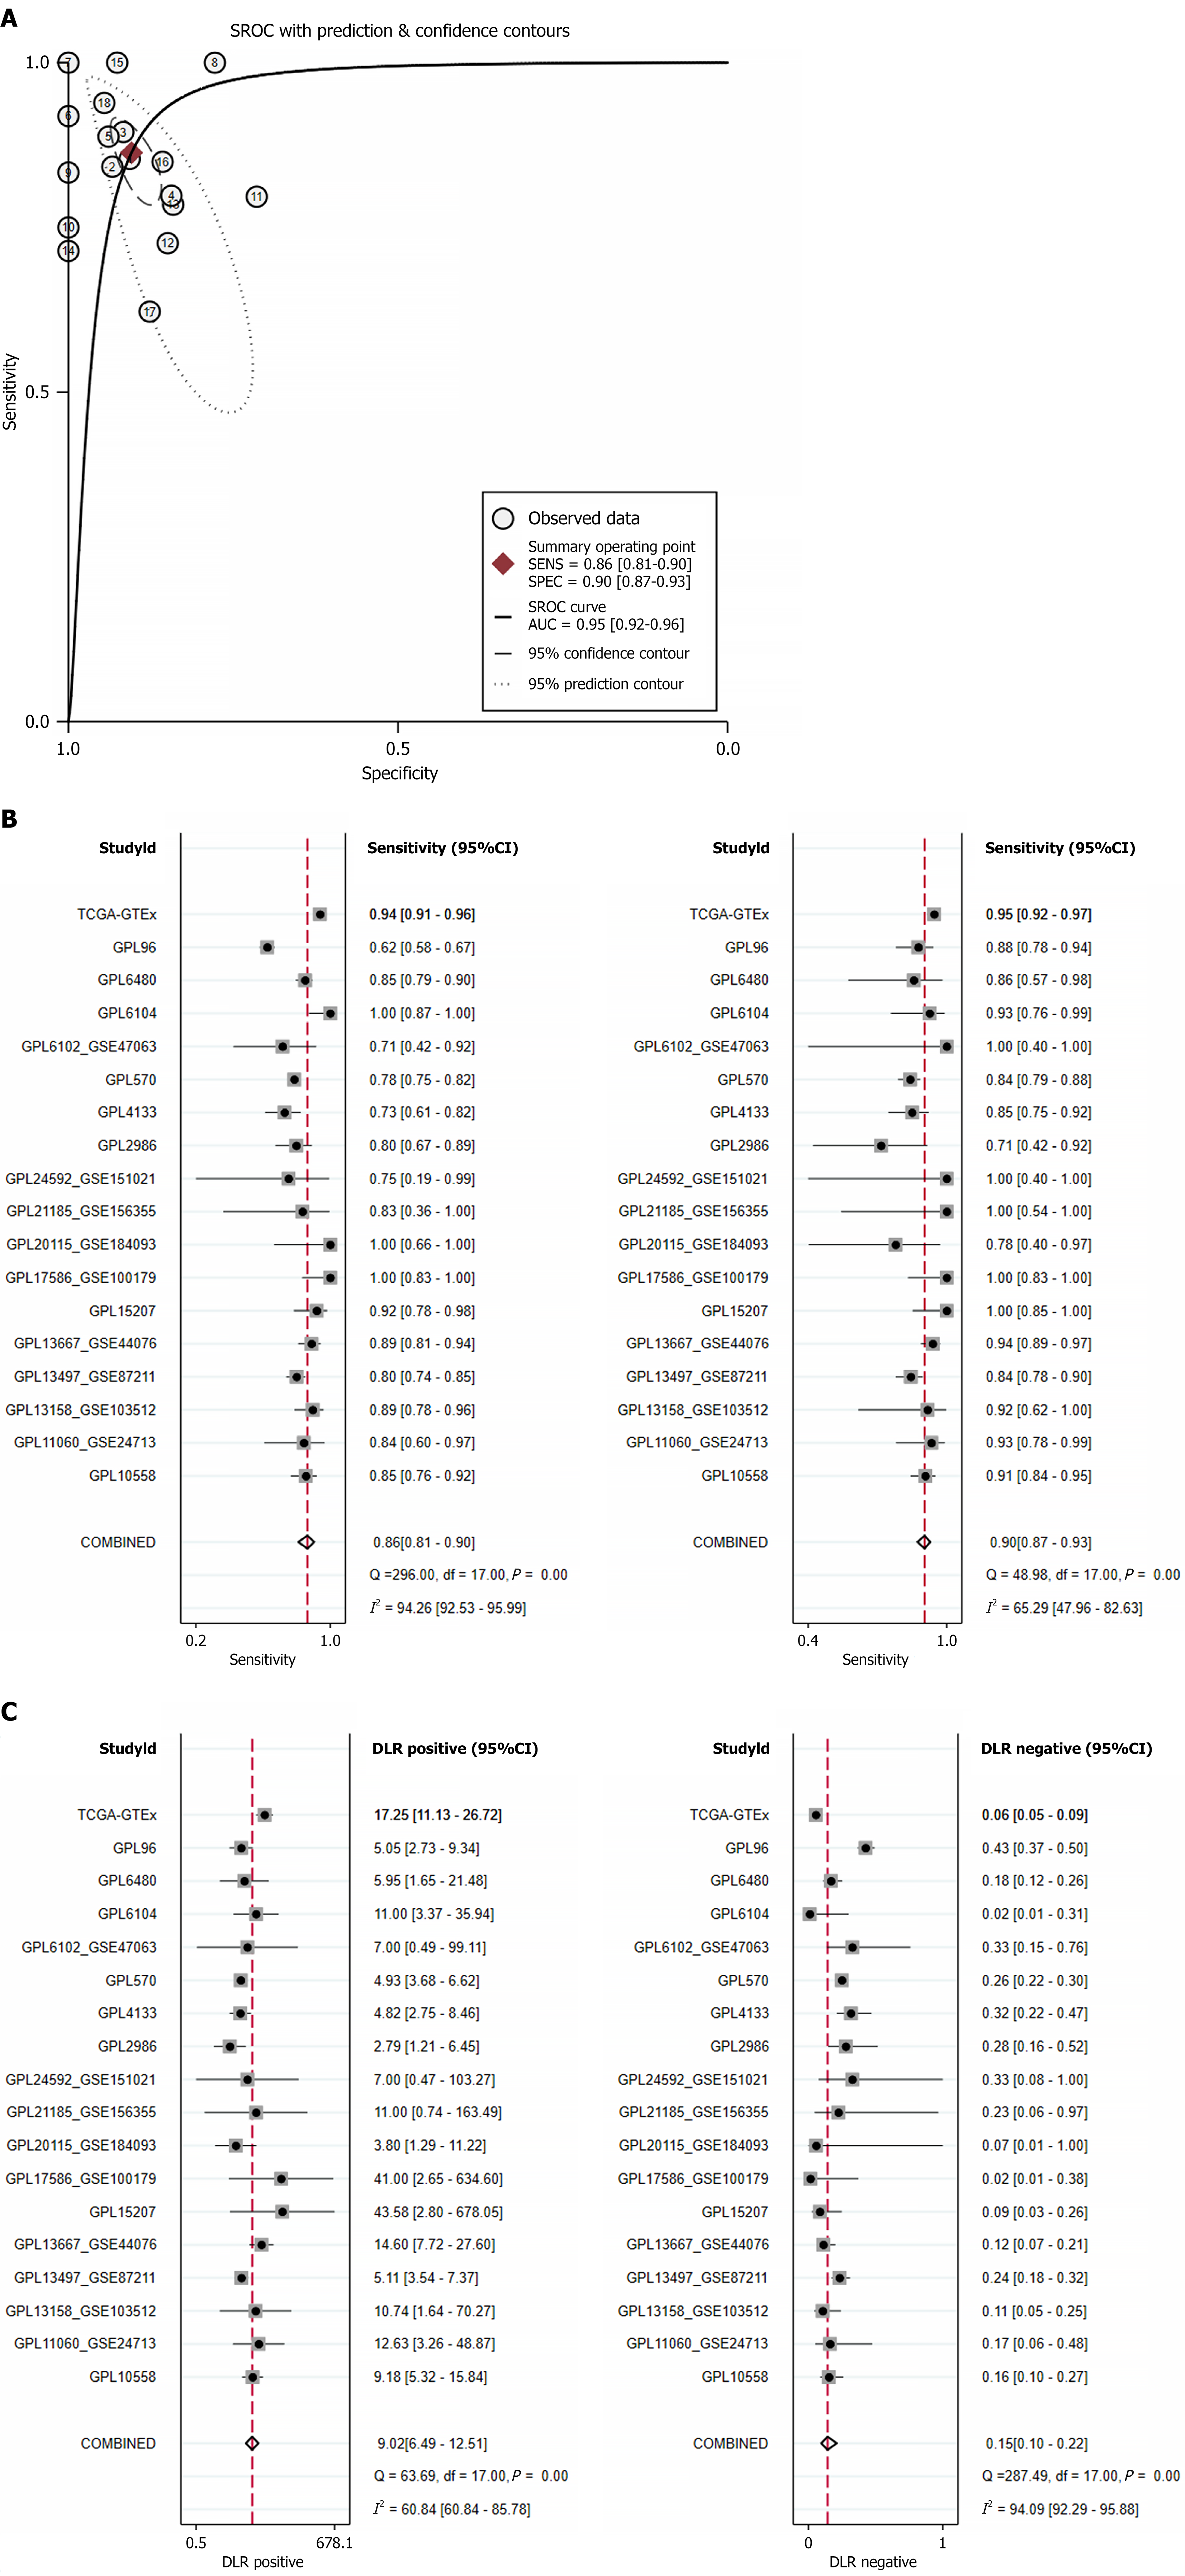
Figure 5 Comprehensive assessment of stearoyl-coenzyme A desaturase expression correlation with colorectal cancer outcomes.
A: Summary receiver operating characteristic curve; B: Sensitivity and specificity; C: Positive diagnostic likelihood ratio and negative diagnostic likelihood ratio. GTEx: Genotype-Tissue Expression; TCGA: The Cancer Genome Atlas; CI: Confidence interval; SROC: Summary receiver operating characteristic curve; AUC: Area under the curve.
Figure 6 Stearoyl-coenzyme A desaturase protein expression in adjacent non-tumor tissue of colorectal cancer and colorectal cancer tissue.
A: Stearoyl-coenzyme A desaturase protein expression in adjacent non-tumor tissue of colorectal cancer; B: Stearoyl-coenzyme A desaturase protein expression in colorectal cancer tissue. Left side of the image: Tissue image at 500 μm, middle side: Tissue image at 200 μm, right side: Tissue image at 50 μm.
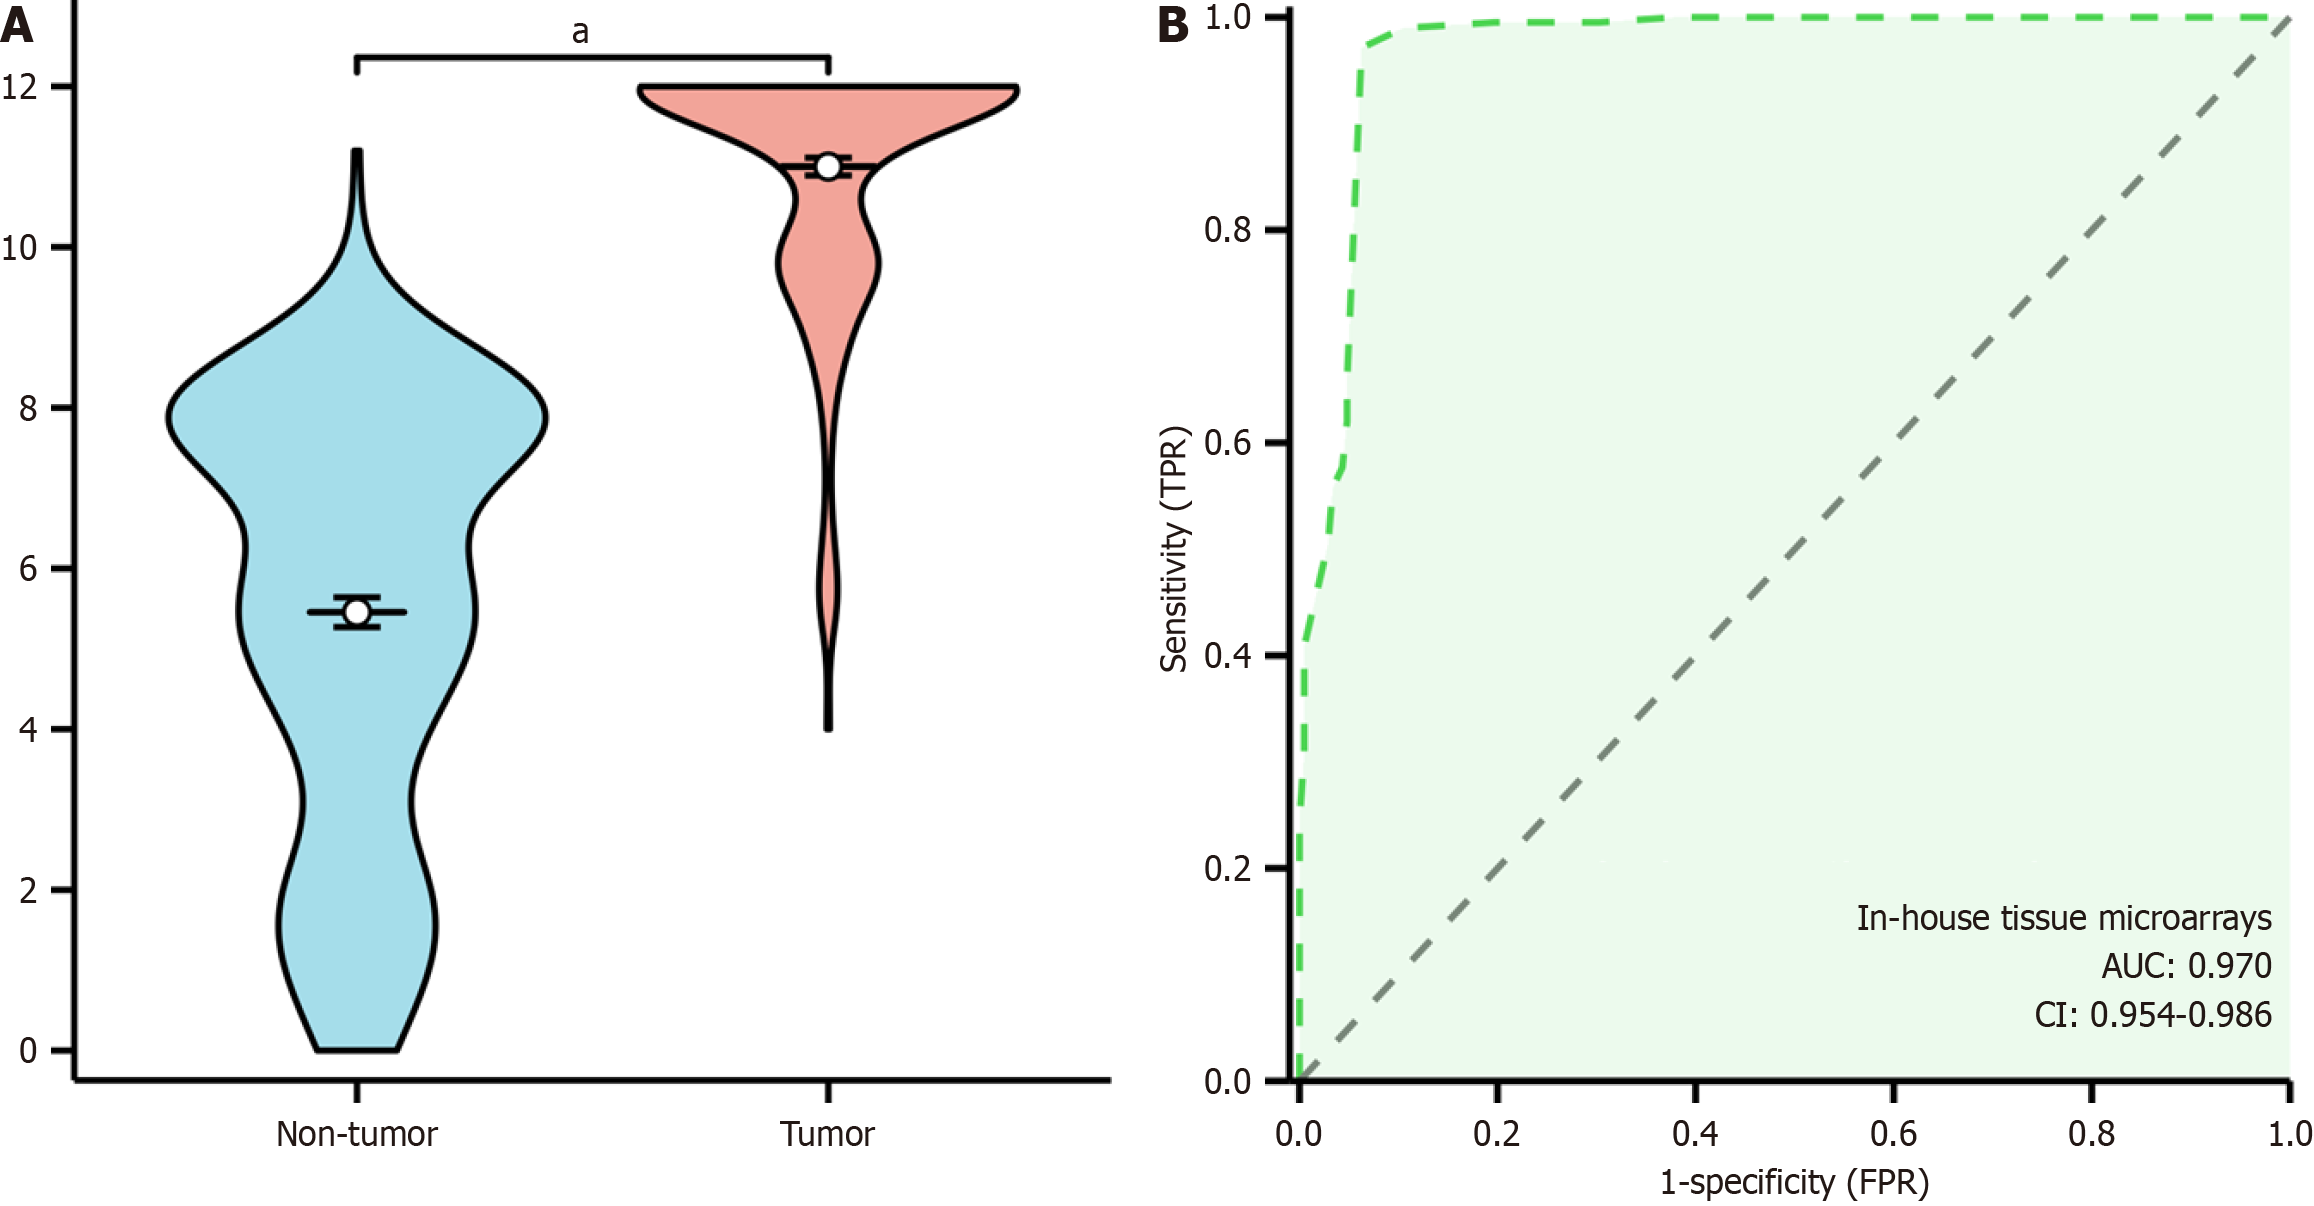
Figure 7 Elevated expression of stearoyl-coenzyme A desaturase protein in colorectal cancer tissue.
A: Violinplot; B: Receiver operating characteristic curve. TPR: True positive rate; FPR: False positive rate; CI: Confidence interval; AUC: Area under the curve. aP < 0.001.
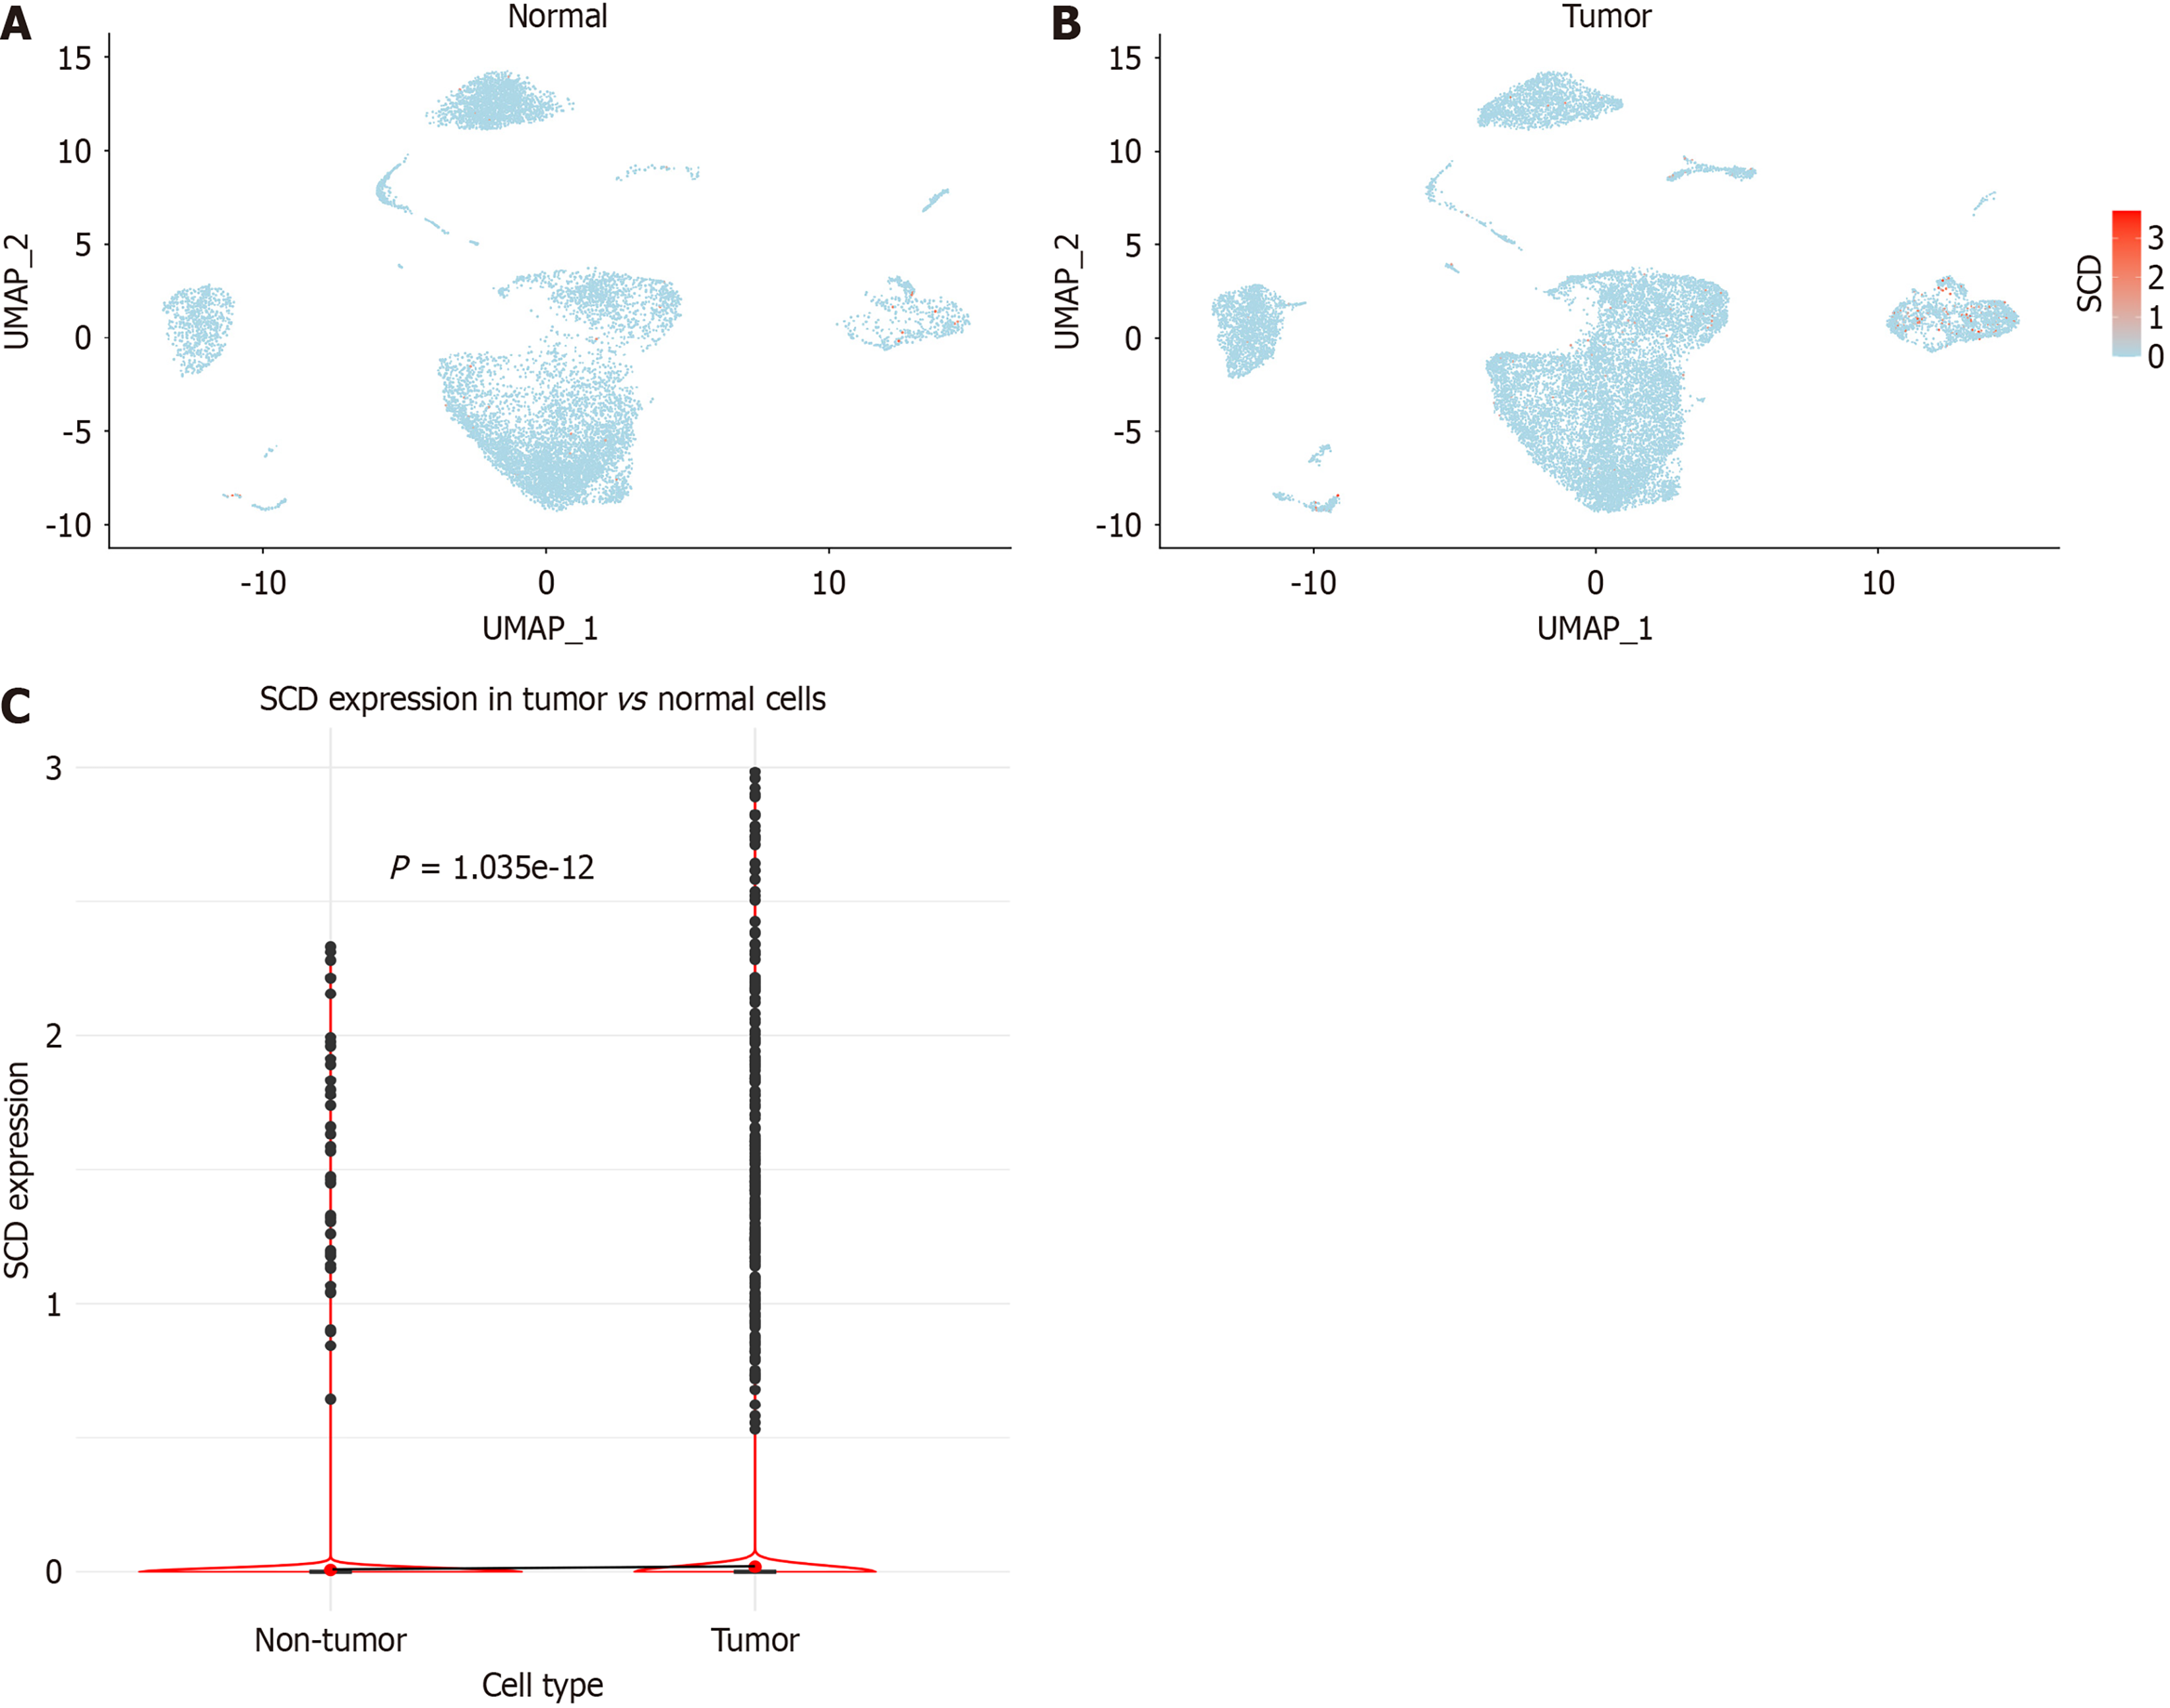
Figure 8 Analysis of stearoyl-coenzyme A desaturase expression in single cells.
A: Distribution within colorectal cancer samples; B: Distribution in normal colorectal samples; C: Comparative analysis of stearoyl-coenzyme A desaturase expression between colorectal cancer and normal colorectal cells. SCD: Stearoyl-coenzyme A desaturase.
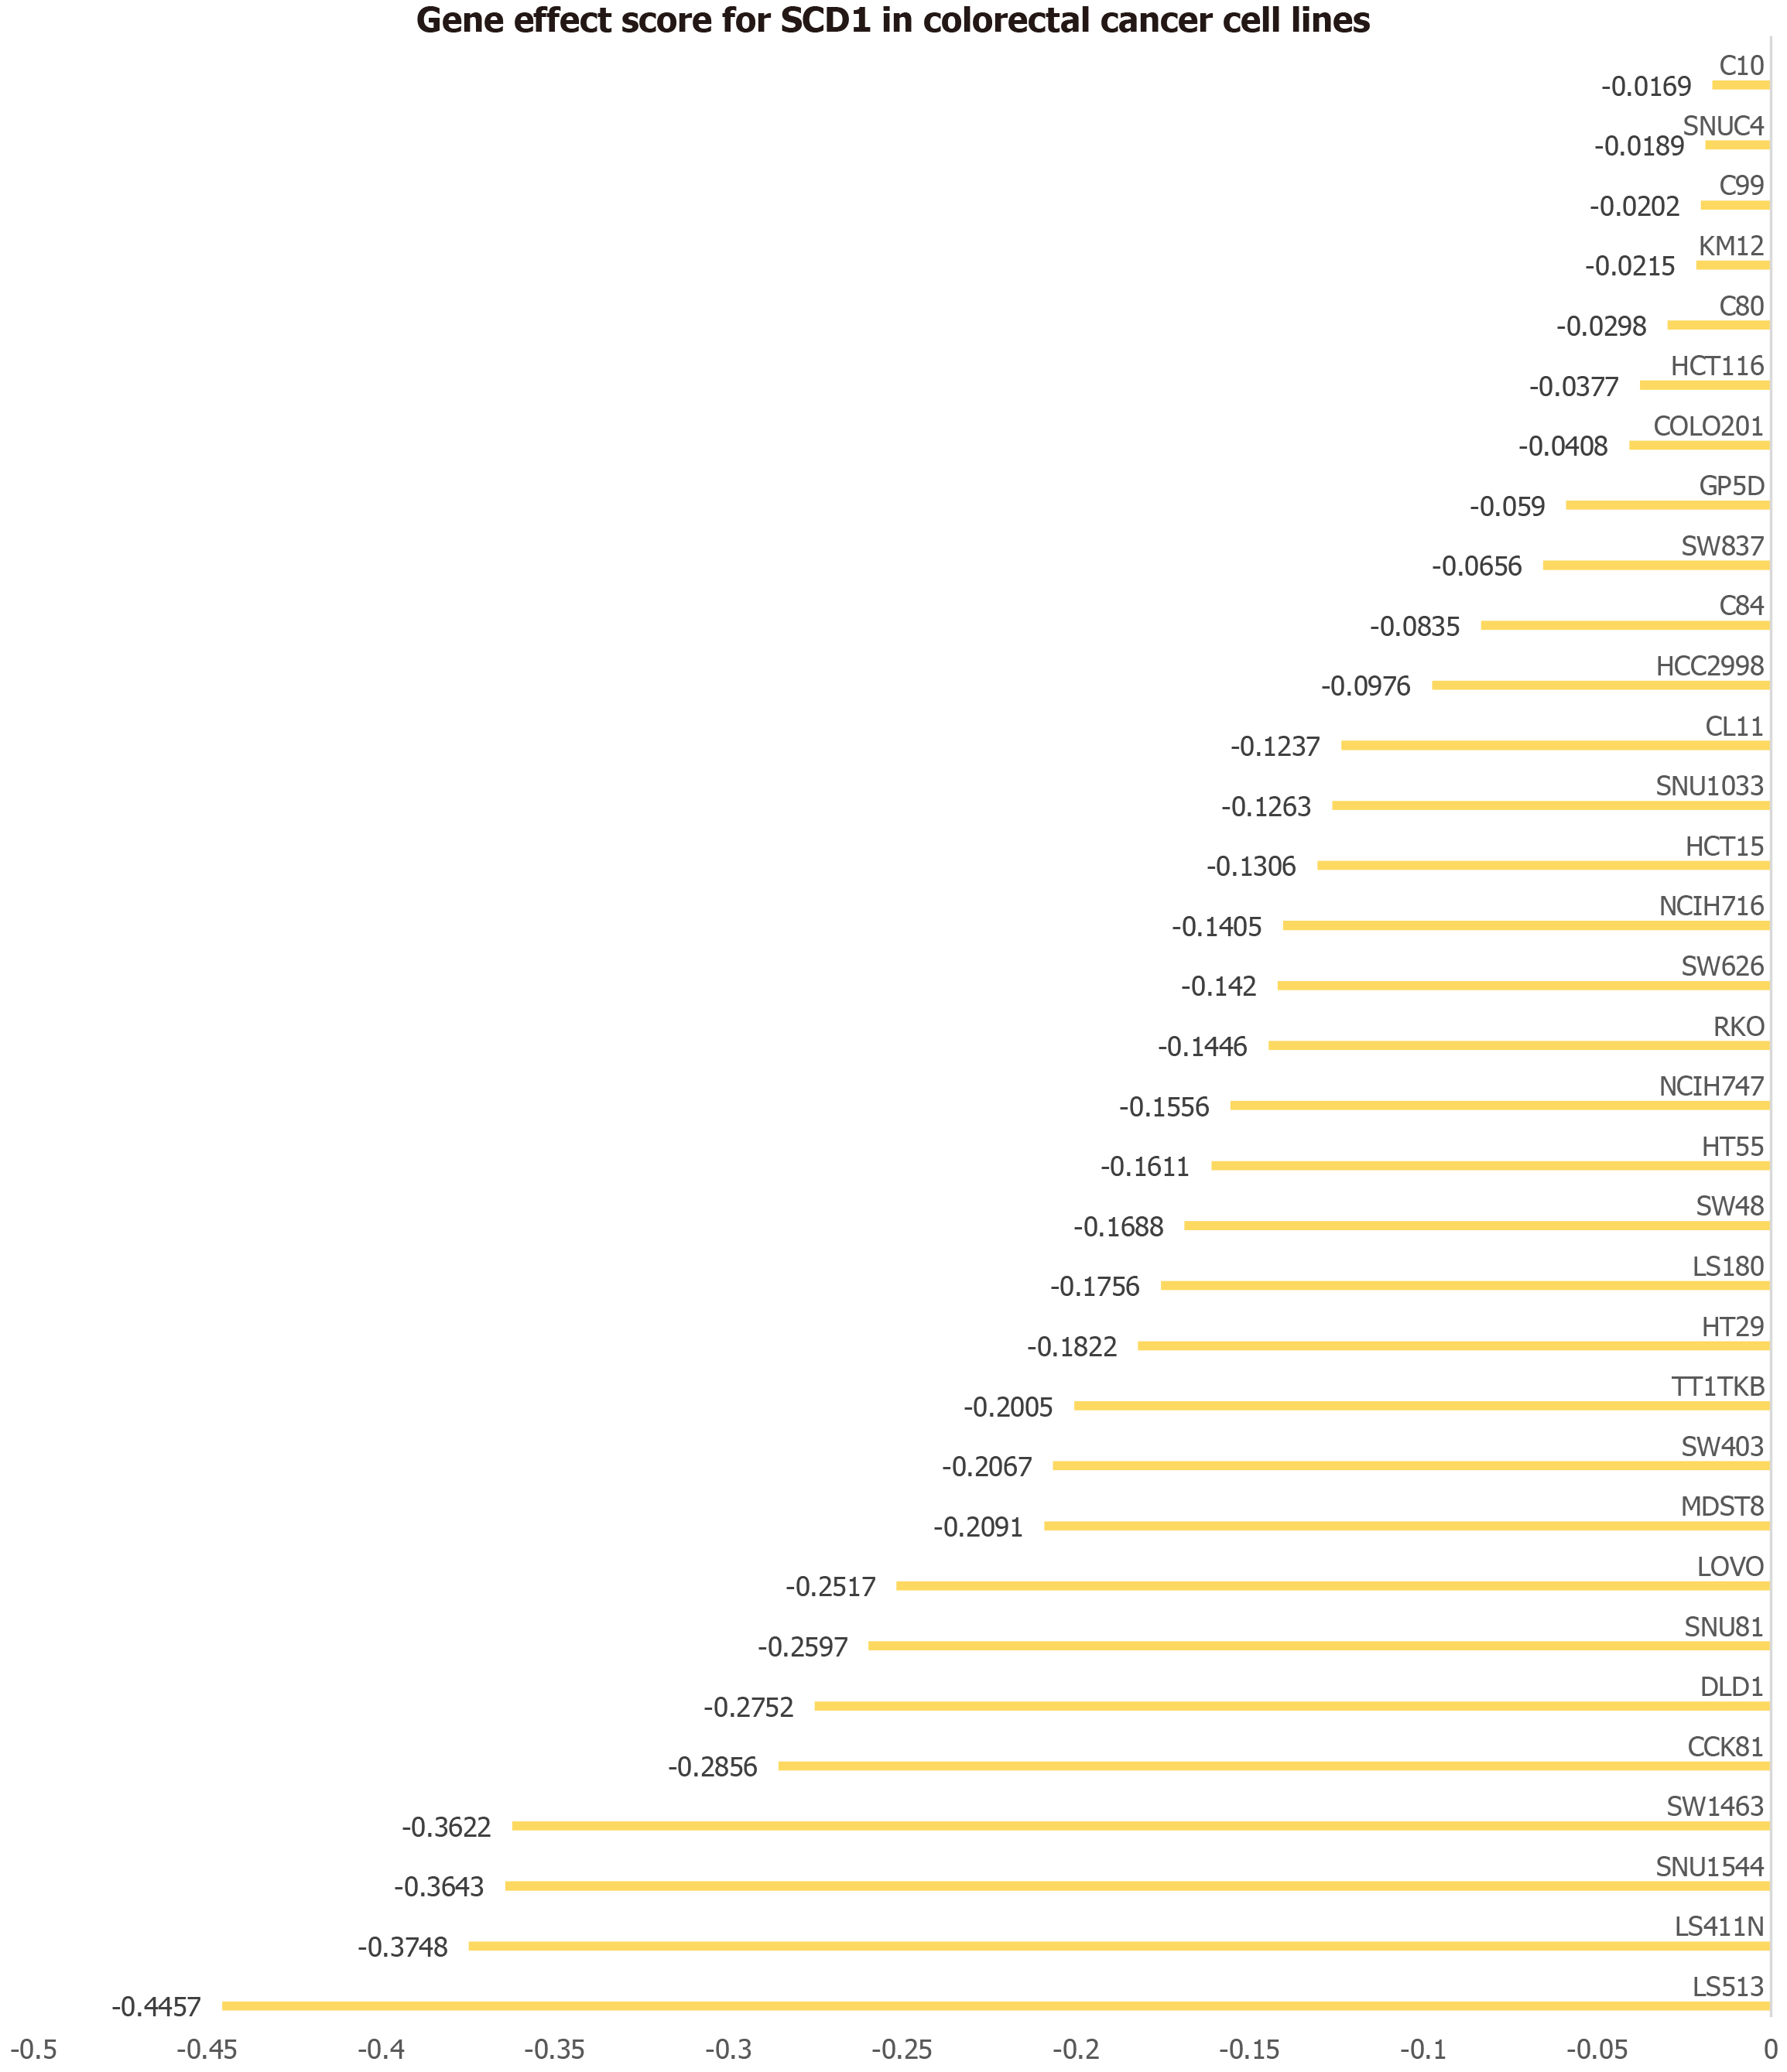
Figure 9 Impact of stearoyl-coenzyme A desaturase gene on 33 colorectal cancer cell lines.
The horizontal axis depicts the effect score of the stearoyl-coenzyme A desaturase gene for each cell line, while the vertical axis lists the various colorectal cancer cell lines. SCD: Stearoyl-coenzyme A desaturase.
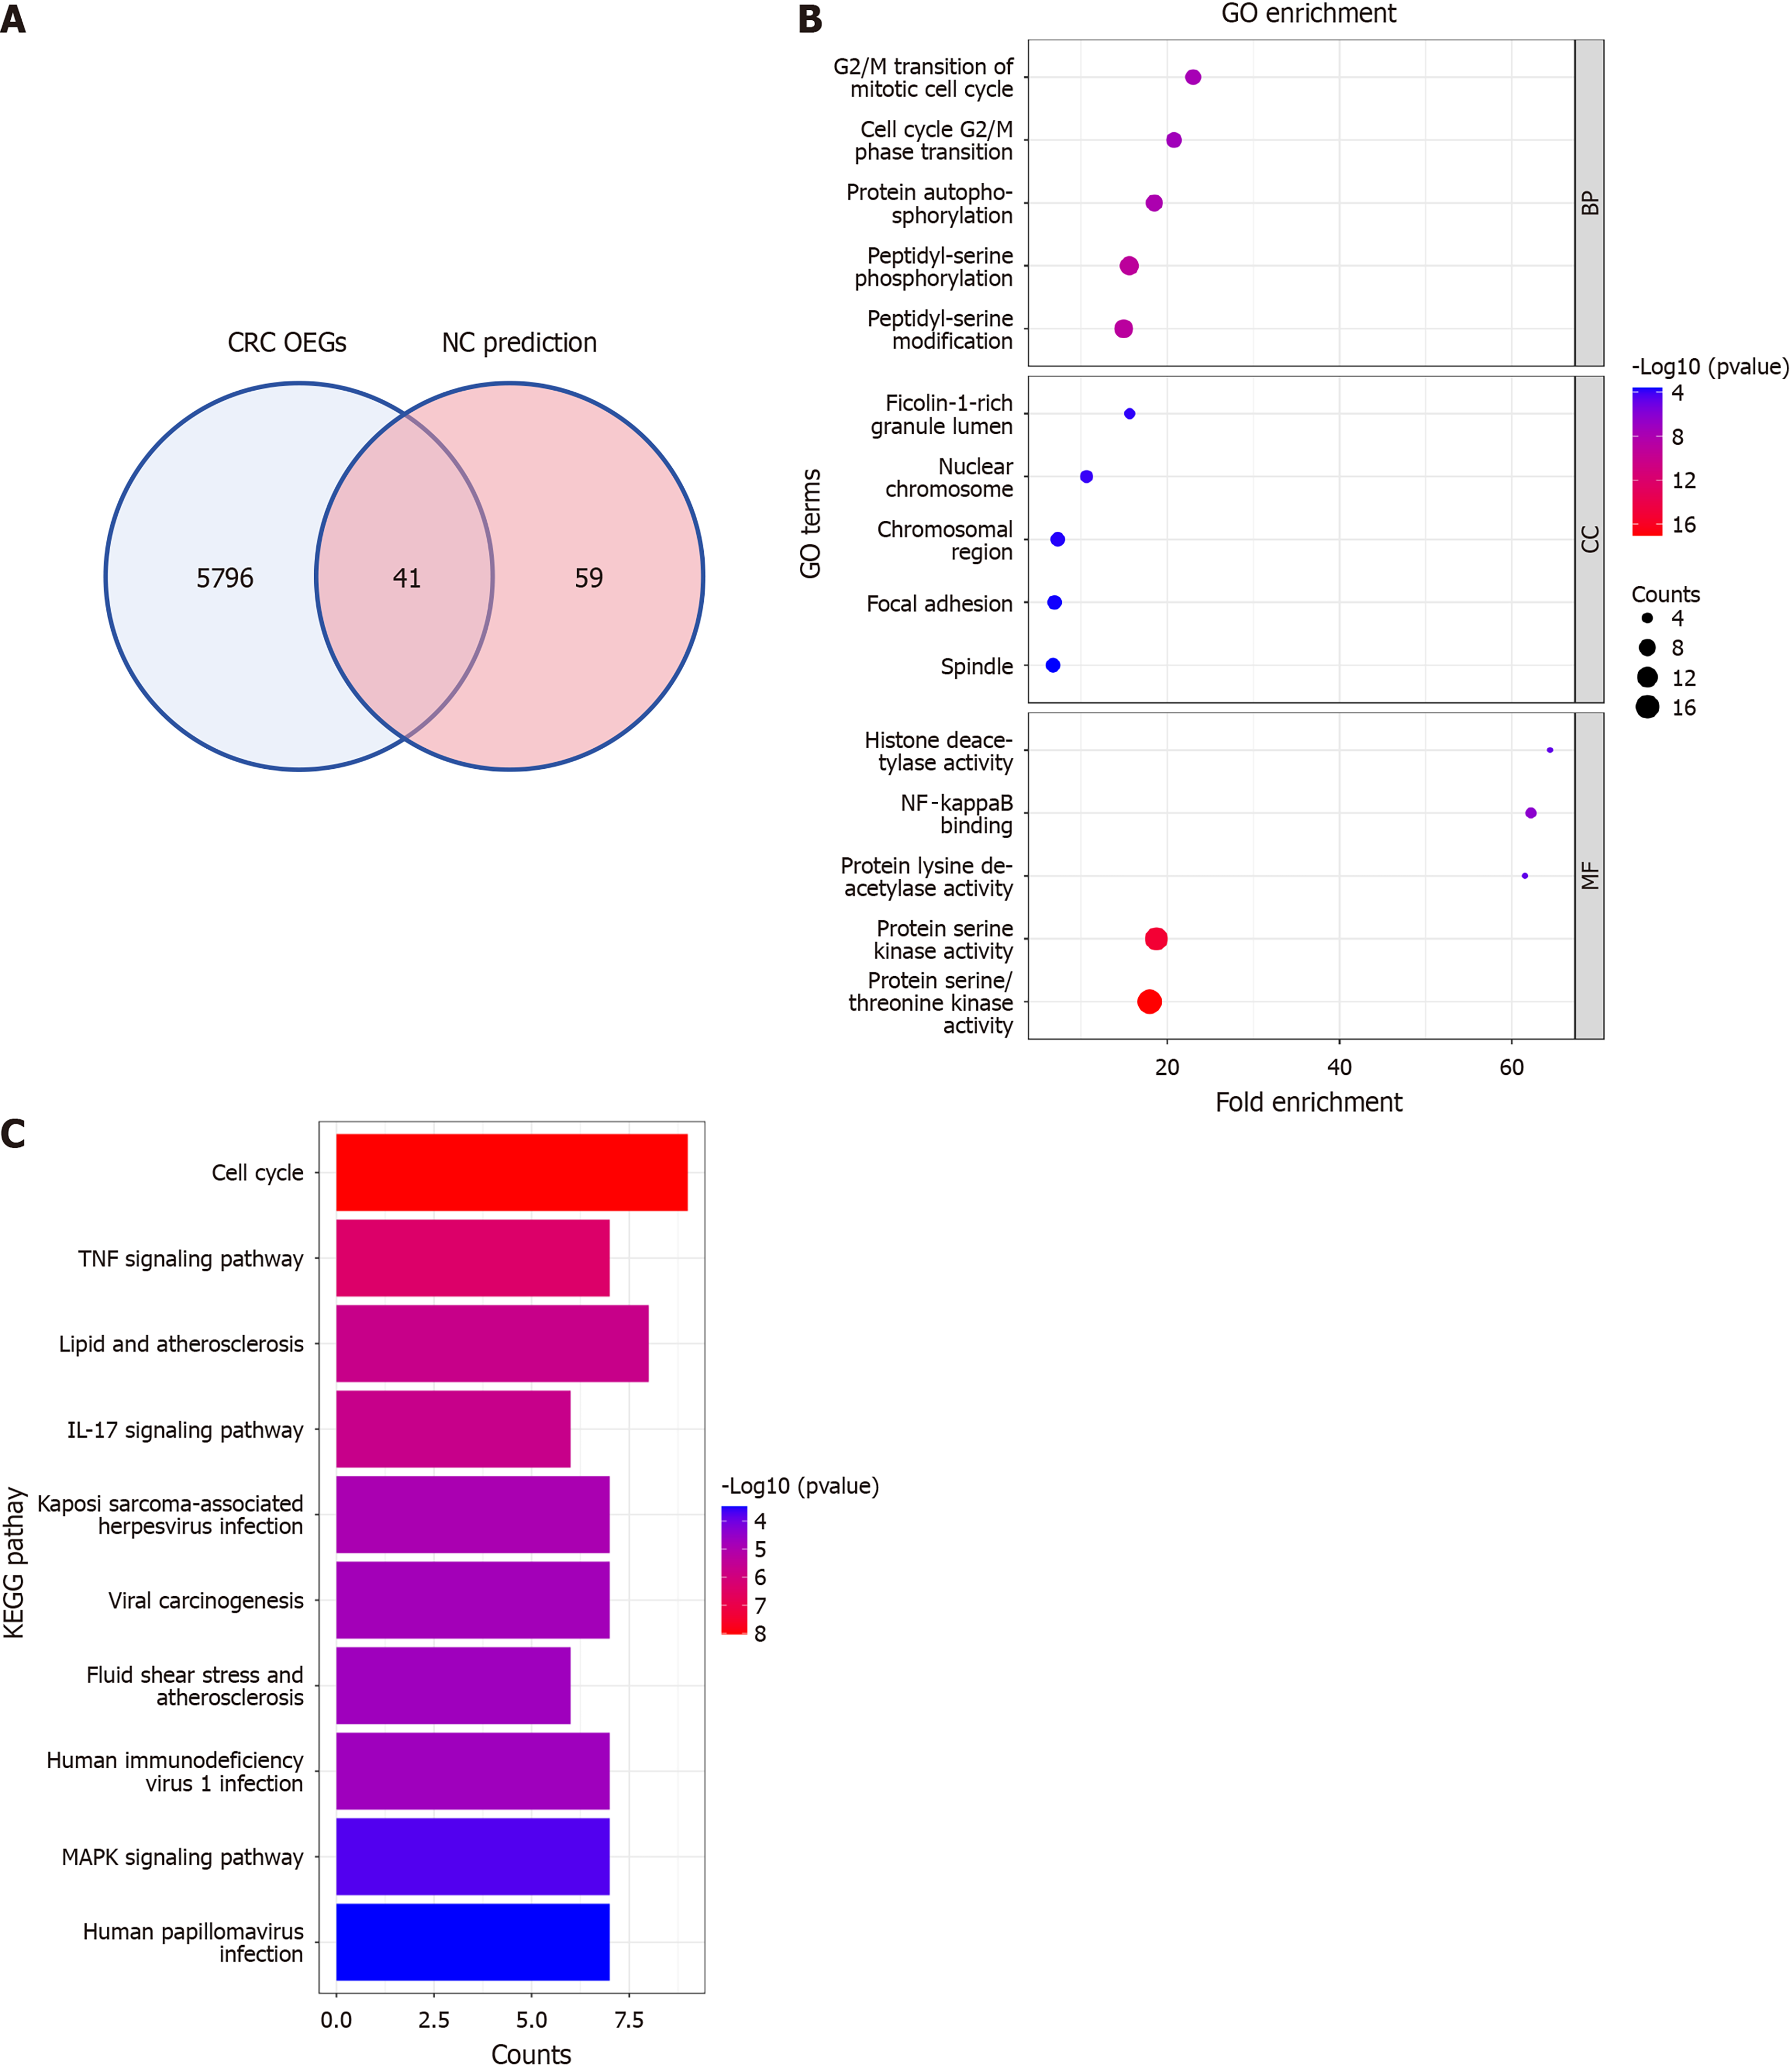
Figure 10 Investigating molecular mechanisms of nitidine chloride against colorectal cancer.
A: Identification of shared genes via colorectal cancer overexpressed genes and nitidine chloride target prediction overlap; B: Functional enrichment analysis of shared genes using Gene Ontology; C: Pathway analysis of shared genes using Kyoto Encyclopedia of Genes and Genomes. CRC: Colorectal cancer; OEG: Overexpressed gene; NC: Nitidine chloride; GO: Gene Ontology; KEGG: Kyoto Encyclopedia of Genes and Genomes.
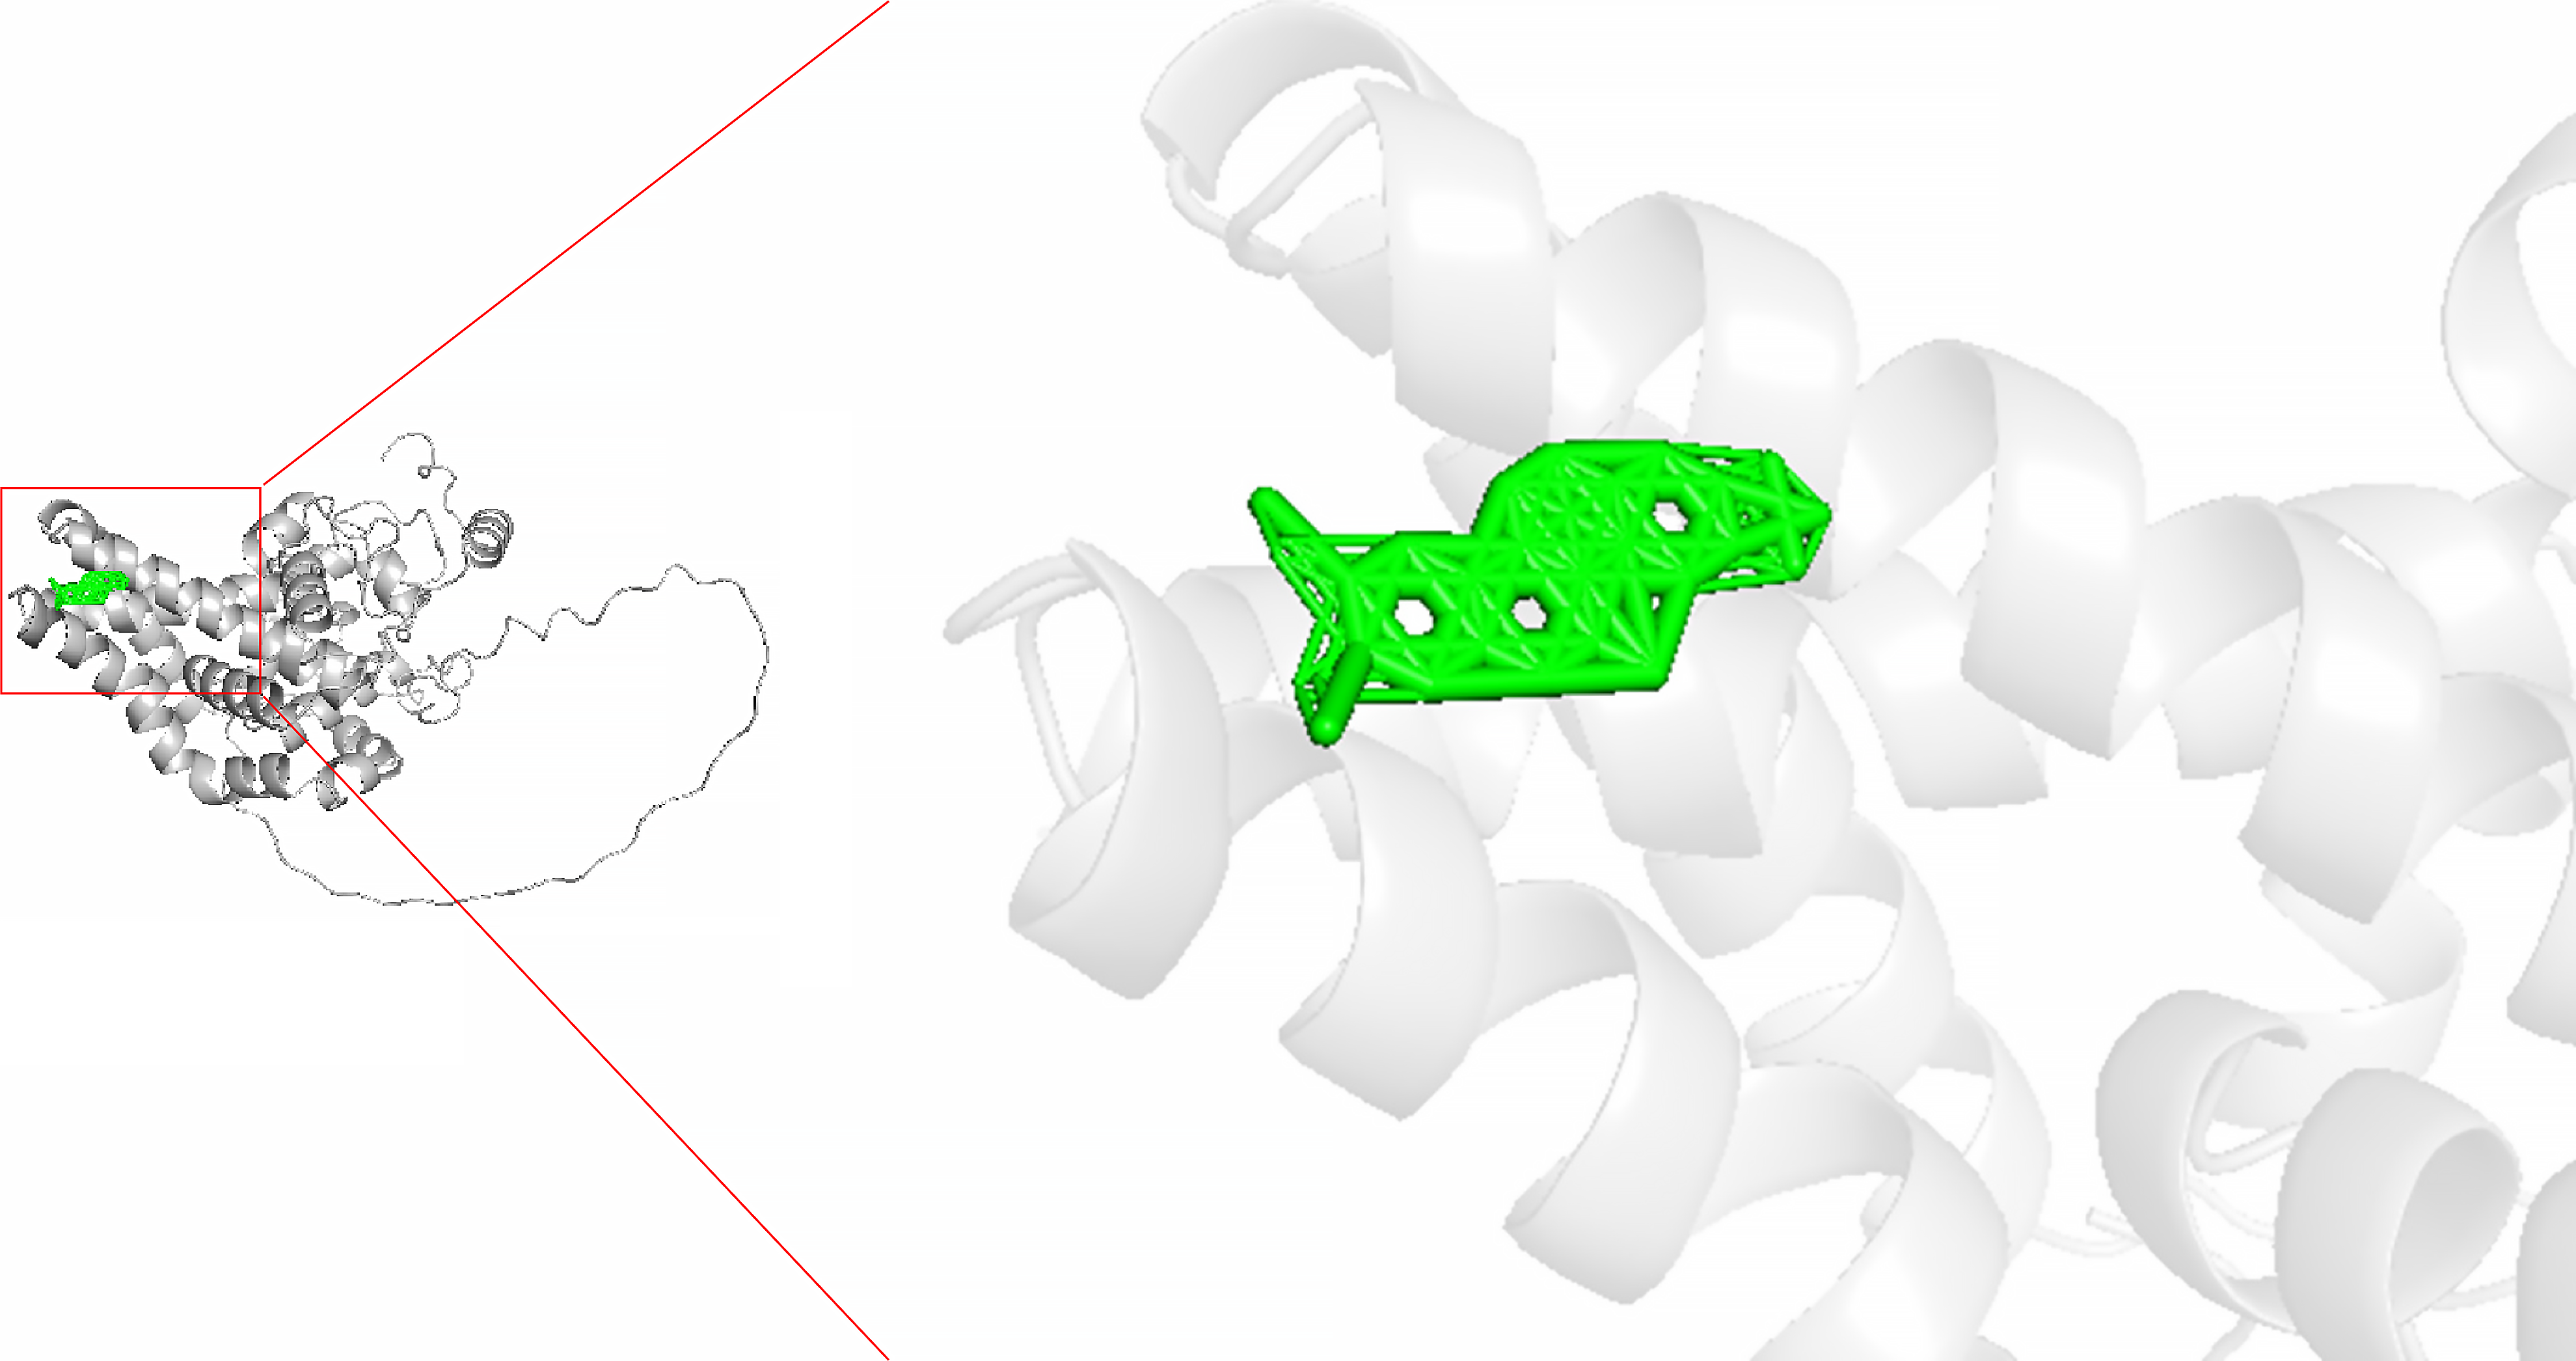
Figure 11
The molecular docking of nitidine chloride and stearoyl-coenzyme A desaturase (affinity energy: -8.
8 kcal/mol).
- Citation: Wang XW, Huang WY, Qin K, Zeng DT, Chen ZY, Chi BT, Tang YX, Li Q, Li B, Li DM, He RQ, Huang WJ, Chen G, Tang RX, Feng ZB. High expression of stearoyl-coenzyme A desaturase in colorectal cancer oncogenic functions and its potential as a therapeutic target. World J Gastrointest Surg 2025; 17(2): 100237
- URL: https://www.wjgnet.com/1948-9366/full/v17/i2/100237.htm
- DOI: https://dx.doi.org/10.4240/wjgs.v17.i2.100237


