Copyright
©The Author(s) 2025.
World J Gastrointest Surg. Jan 27, 2025; 17(1): 100544
Published online Jan 27, 2025. doi: 10.4240/wjgs.v17.i1.100544
Published online Jan 27, 2025. doi: 10.4240/wjgs.v17.i1.100544
Figure 1 Comparative analysis of surgical indicators.
A: Operation time of the control and observation groups; B: Intraoperative blood loss of the control and observation groups. aP < 0.05 and bP < 0.01 compared with the control group.
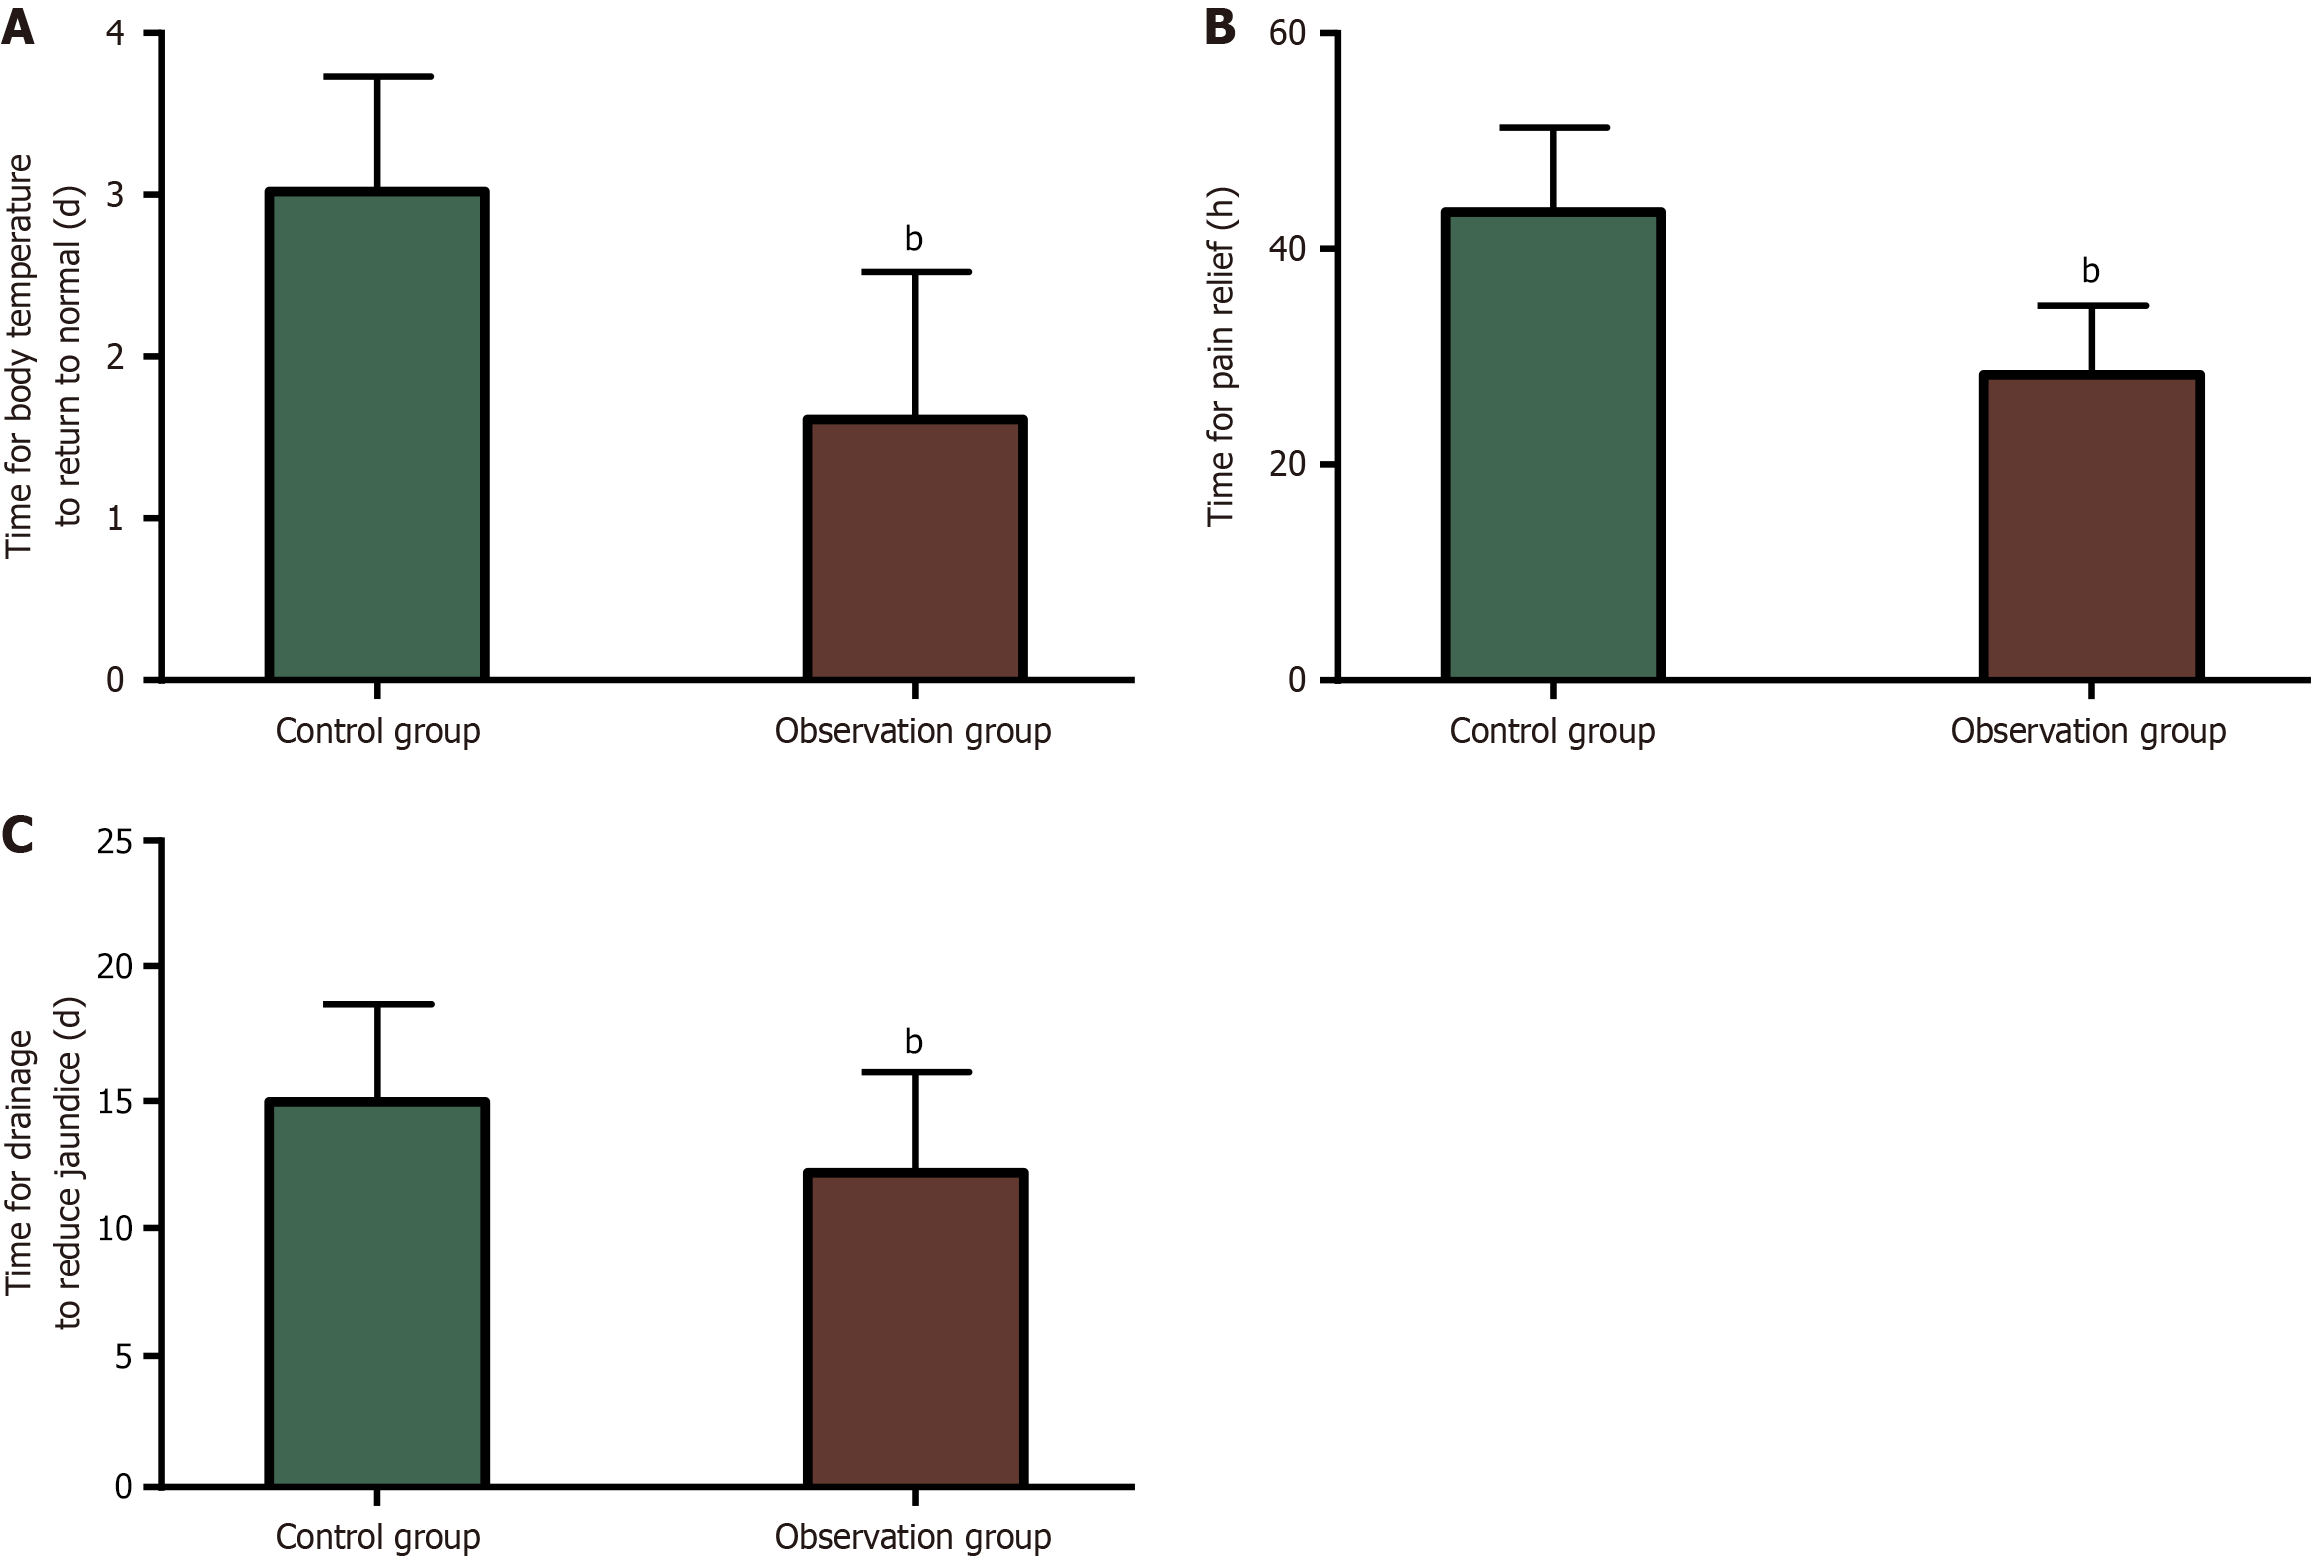
Figure 2 Comparative analysis of postoperative rehabilitation.
A: The time for body temperature to return to normal in the control and observation groups; B: The time for pain relief in the control and observation groups; C: The time for drainage to reduce jaundice in the control and observation groups. aP < 0.01 compared with the control group.
Figure 3 Comparative analysis of hospital stay and medical expenses.
A: Hospital stays of the control and observation groups; B: Medical expenses of the control and observation groups. aP < 0.01 compared with the control group.
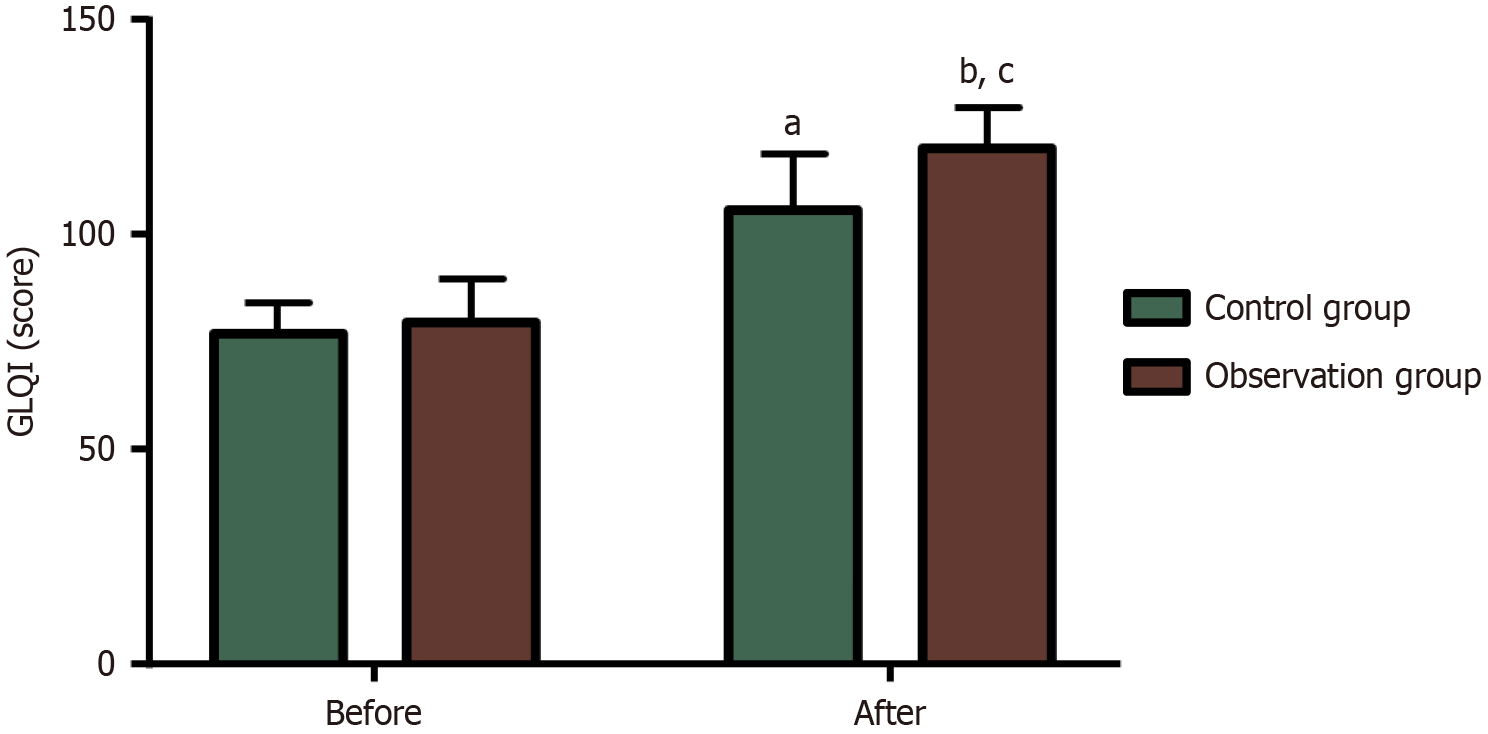
Figure 4 Comparative analysis of quality of life.
aP < 0.05, bP < 0.01 vs before treatment; cP < 0.05 vs the control group. GLQI: Gastrointestinal Quality of Life Index.
- Citation: Chen ZL, Fu H. Endoscopic retrograde cholangiopancreatography, endoscopic papillary balloon dilation, and laparoscopic hepatectomy for intra- and extrahepatic bile duct stones. World J Gastrointest Surg 2025; 17(1): 100544
- URL: https://www.wjgnet.com/1948-9366/full/v17/i1/100544.htm
- DOI: https://dx.doi.org/10.4240/wjgs.v17.i1.100544


