Copyright
©The Author(s) 2024.
World J Gastrointest Surg. Sep 27, 2024; 16(9): 3065-3073
Published online Sep 27, 2024. doi: 10.4240/wjgs.v16.i9.3065
Published online Sep 27, 2024. doi: 10.4240/wjgs.v16.i9.3065
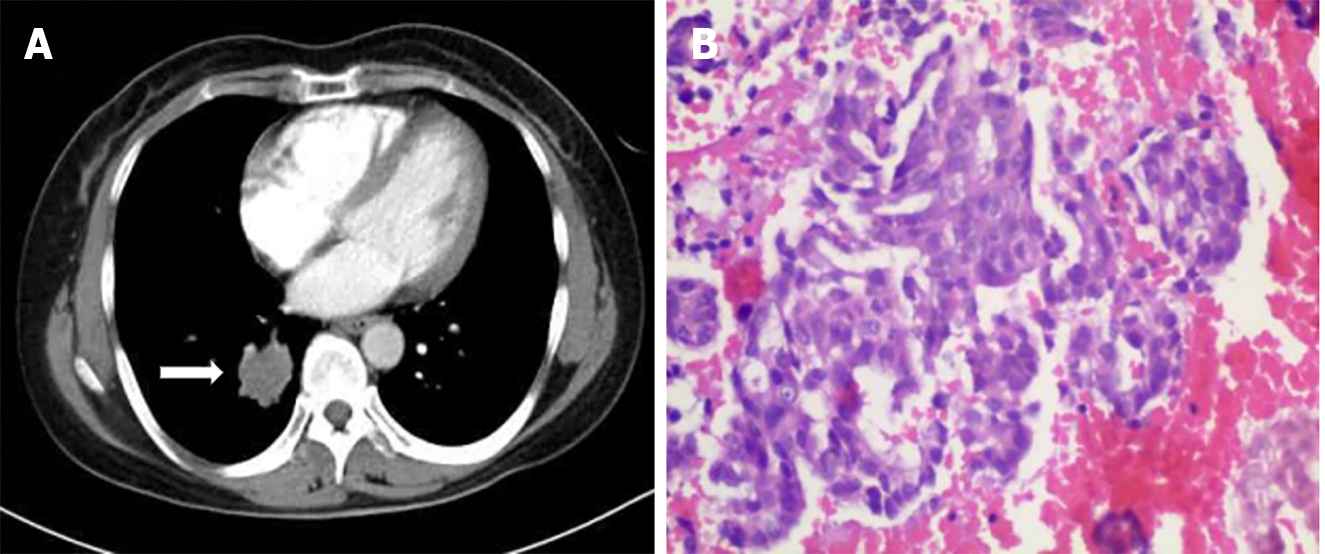
Figure 1 Imaging and pathological examinations of primary lung cancer.
A: Enhanced computed tomography scan of the chest showed a 30 mm × 26 mm tumor in the right lower lobe (white arrow); B: Pathological examination of the lung biopsy showed adenocarcinoma (hematoxylin and eosin staining; magnification 200 ×).
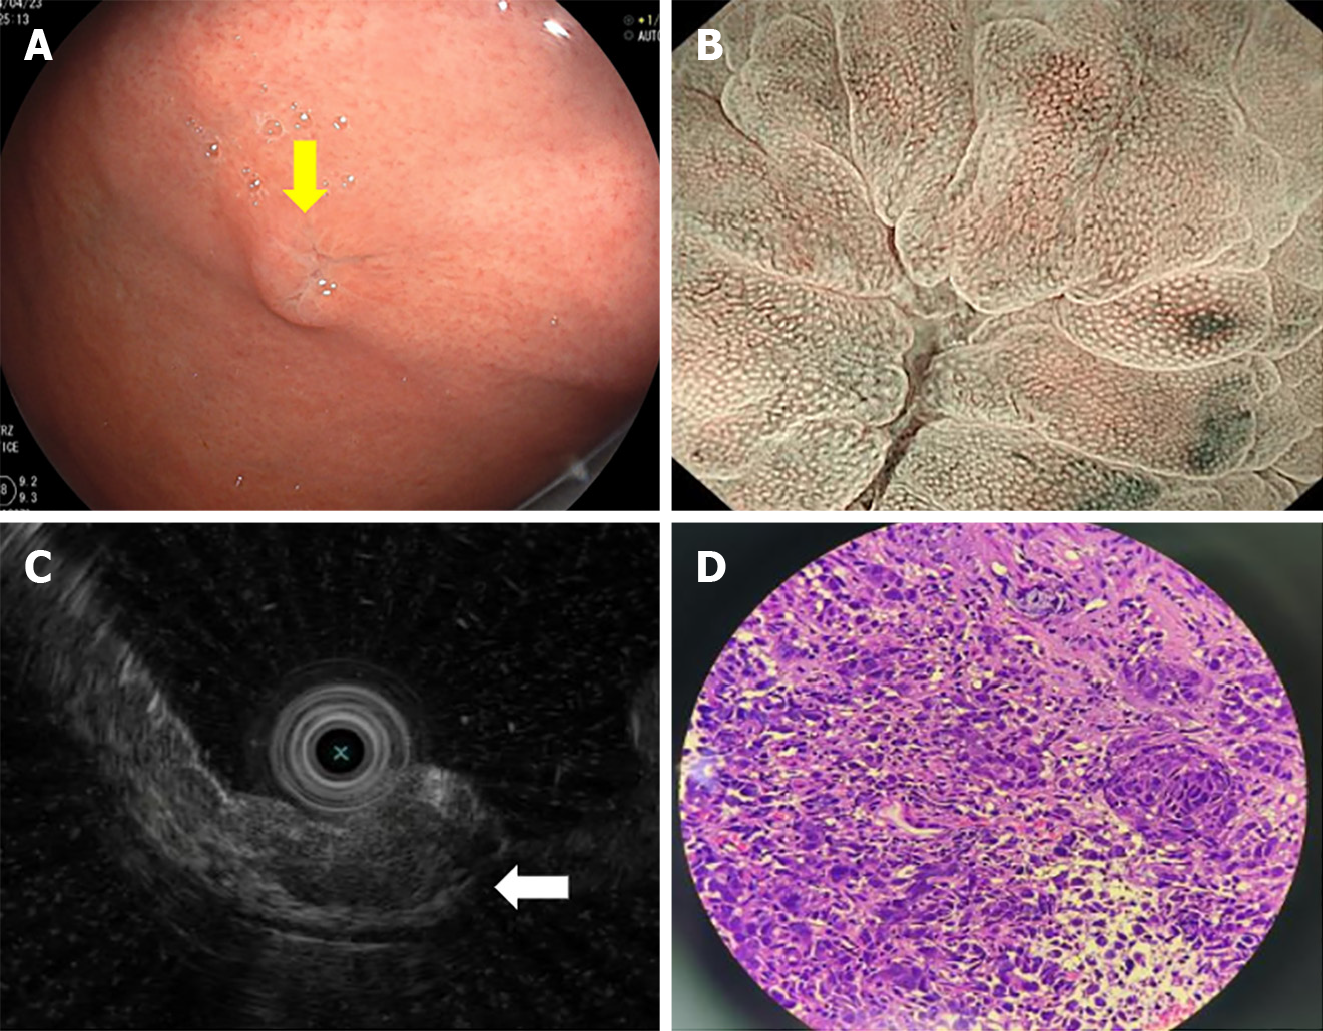
Figure 2 Endoscopy and pathological examinations of the gastric lesion.
A: Gastroscopy showed a 10 mm × 8 mm protruding submucosal tumor with central erosion on the gastric fundus (yellow arrow); B: Magnifying endoscopy showed that the demarcation line of the lesion was not obvious. The microvascular and microsurface patterns were absent on the erosive surface but were still regular on the surrounding mucosa; C: Endoscopic ultrasonography showed a hypoechoic mass with an irregular margin in the submucosal layer, but the submucosal layer had not broken through (white arrow); D: Pathological examination of the gastric biopsy showed poorly differentiated carcinoma (hematoxylin and eosin staining; magnification 100 ×).
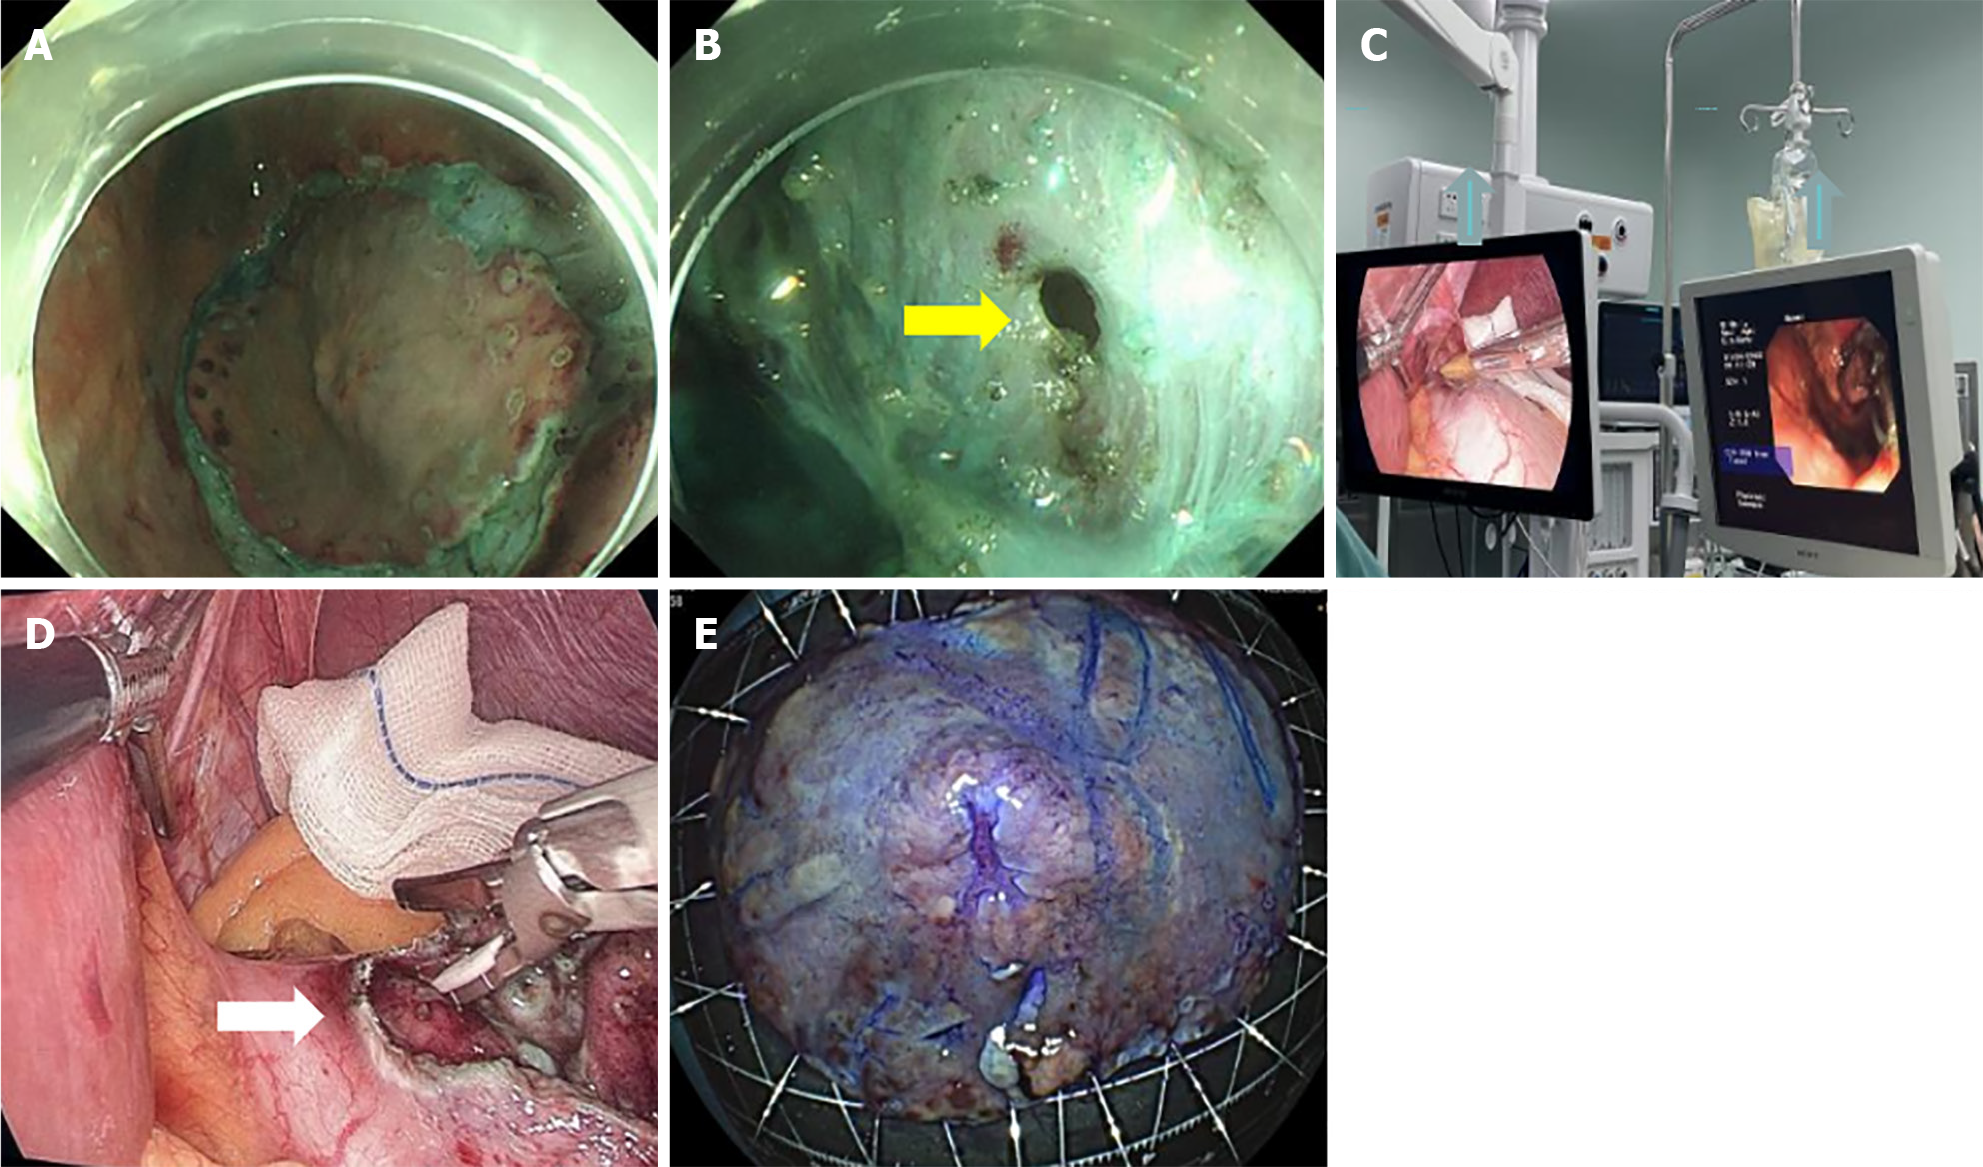
Figure 3 Surgical resection procedure.
A: Endoscopic submucosal dissection (ESD), the resection was made circumferentially along the marked points around the lesion; B: Perforation (yellow arrow) occurred during ESD; C: Combined endoscopic and laparoscopic resection; D: Laparoscopic resection of the lesion (white arrow); E: Gastrectomy specimen.
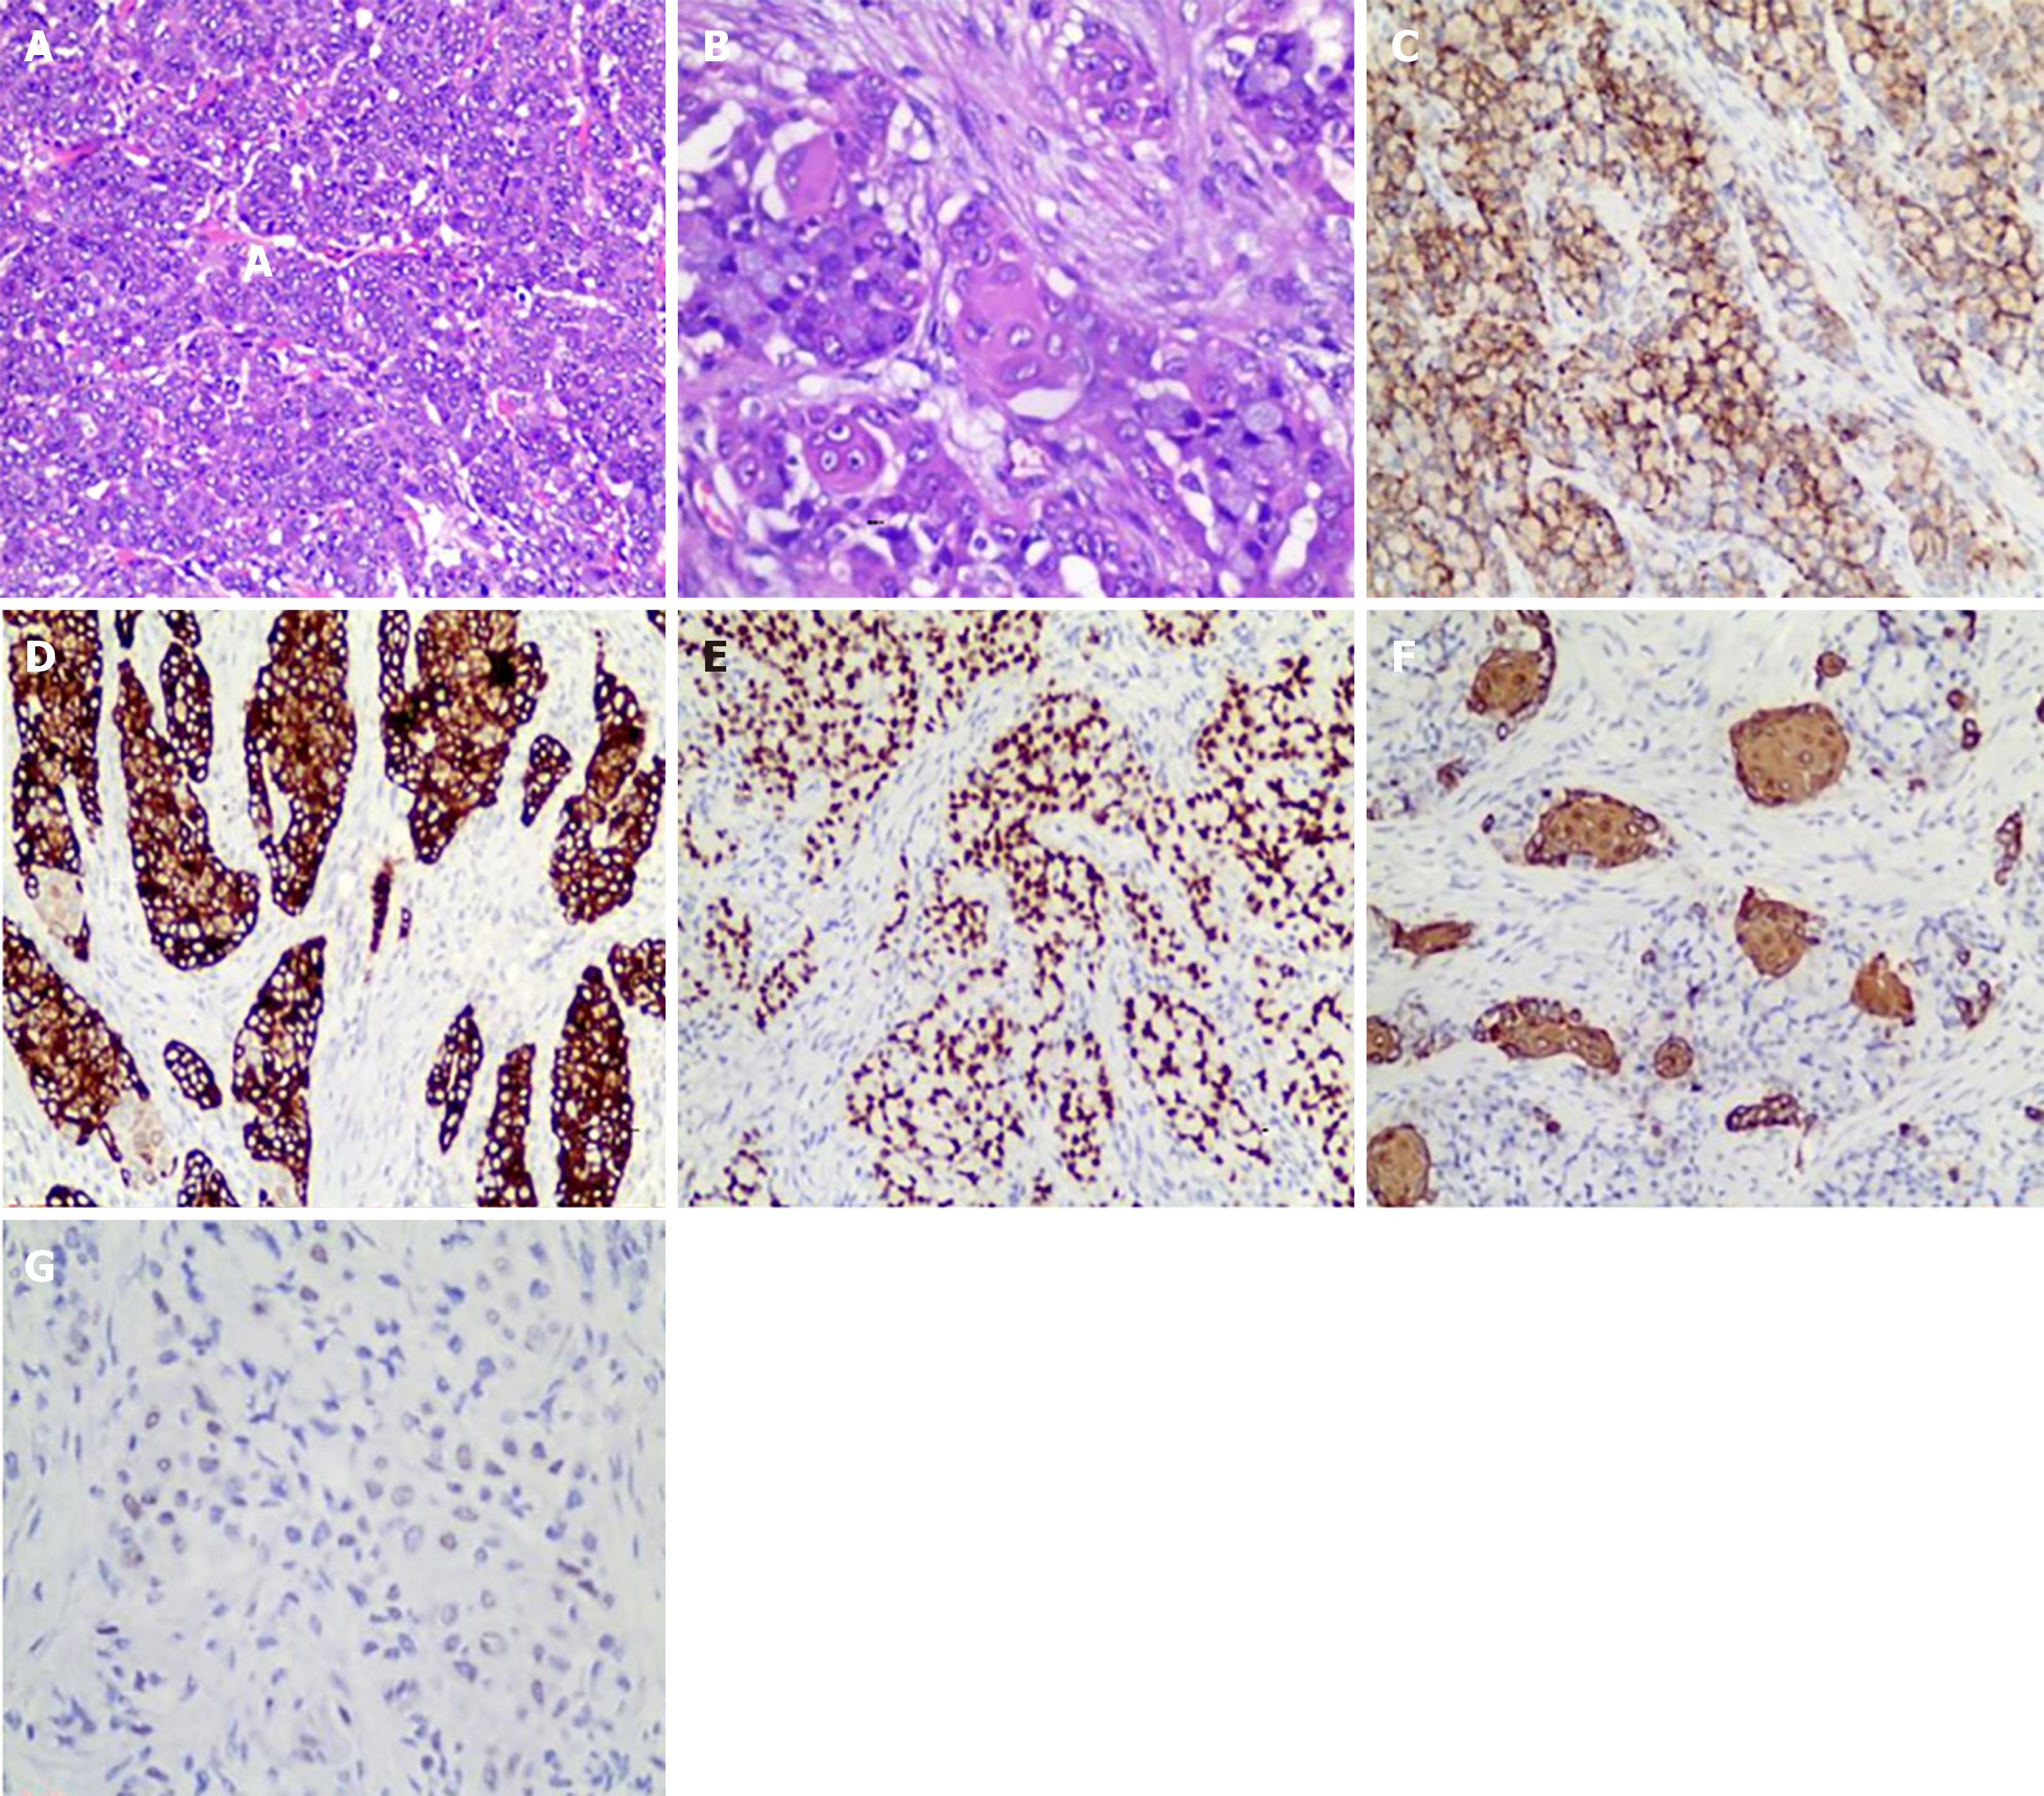
Figure 4 Histological examination and immunohistochemical staining results of the resected gastric specimens.
A: Adenocarcinoma components (magnification 100 ×); B: Squamous cell carcinoma components (magnification 200 ×); C: Novel aspartic proteinase A (magnification 100 ×); D: Cytokeratin 7 (magnification 100 ×); E: Thyroid transcription factor-1 (magnification 100 ×); F: Cytokeratin 5/6 (magnification 200 ×); G: P40 (magnification 200 ×).
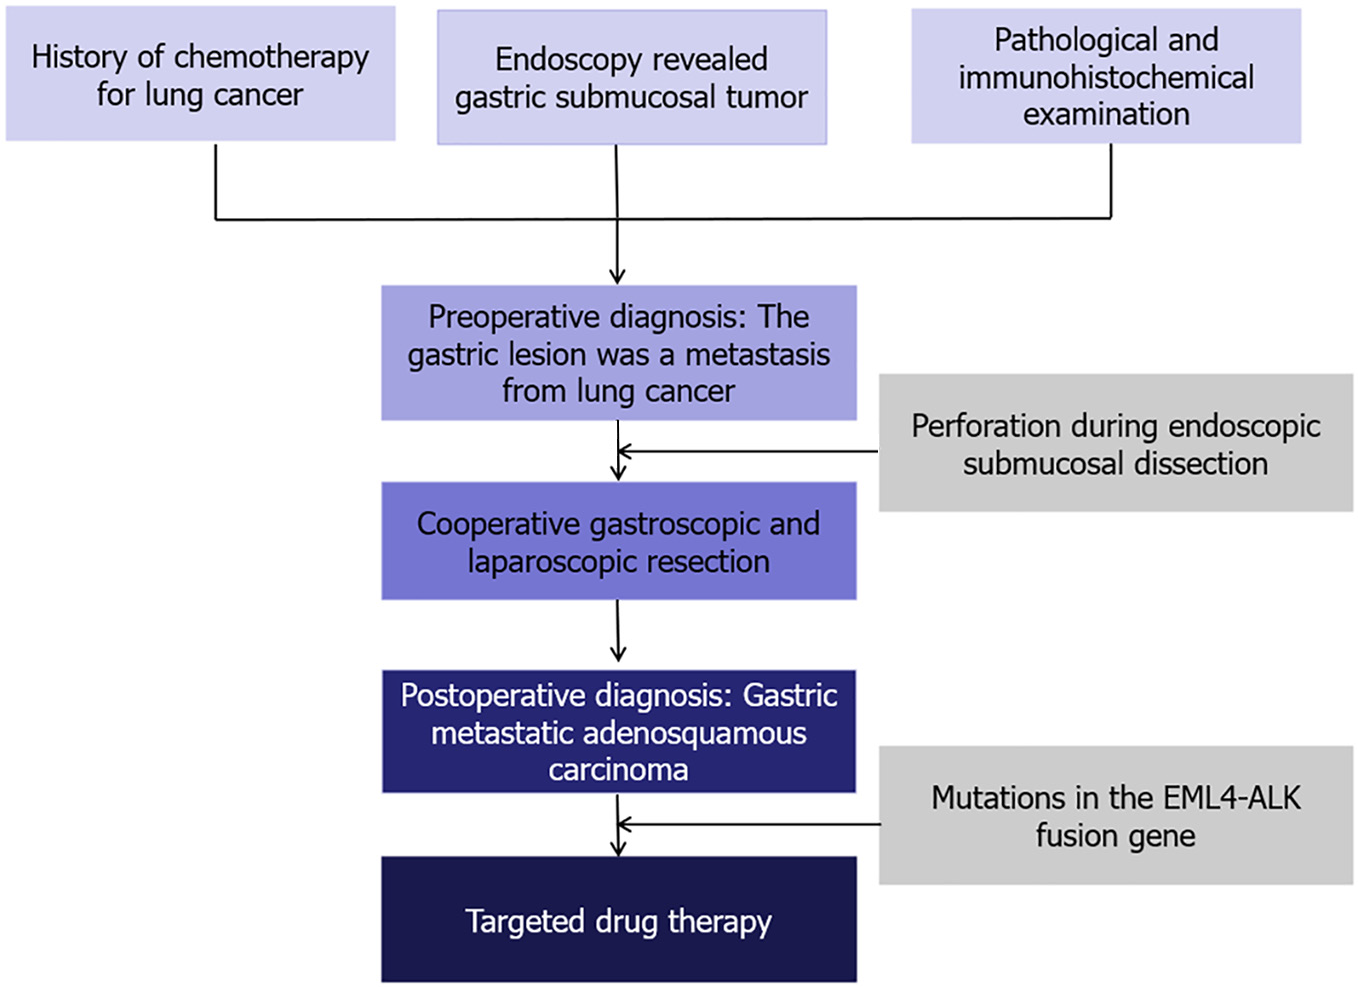
Figure 5 Overview of the assessment, diagnoses, and interventions for this patient.
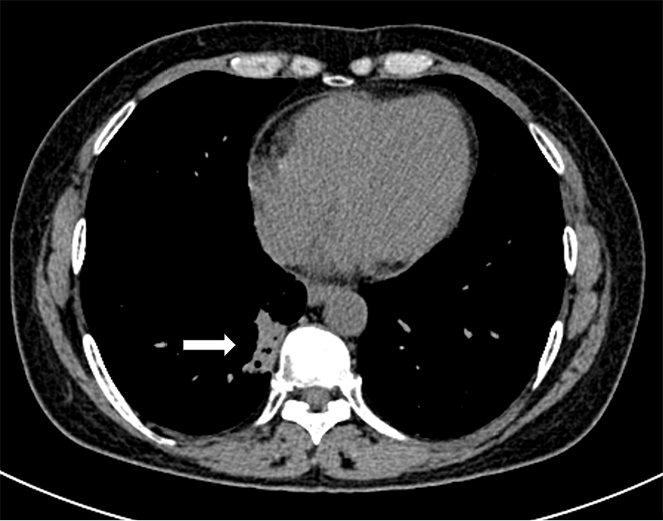
Figure 6 Imaging of the primary lung cancer.
Computed tomography reexamination showed a reduction in size of the primary lung tumor (20 mm × 21 mm, white arrow).
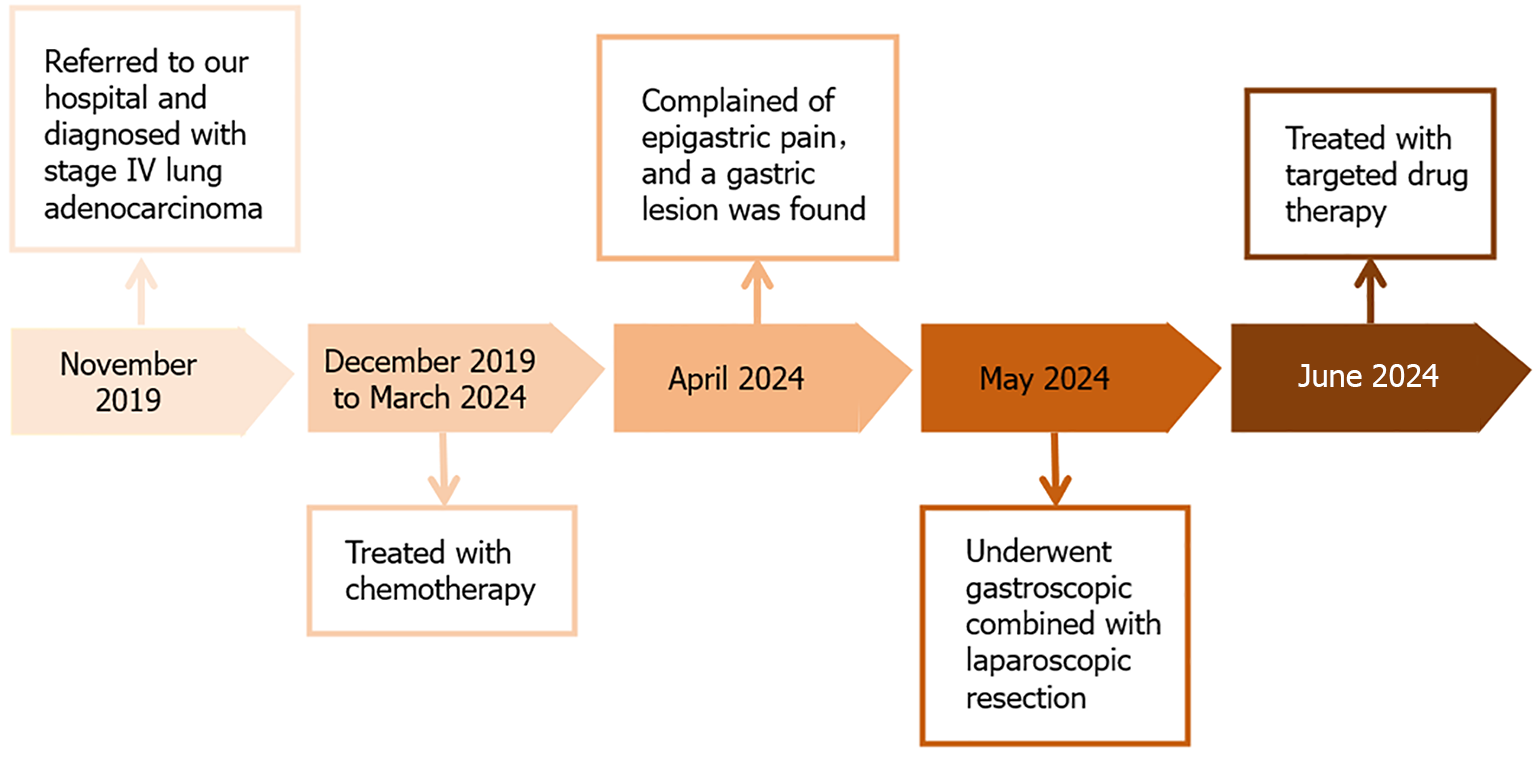
Figure 7 Timeline information of this patient.
- Citation: Lin Y, Wu YL, Zou DD, Luo XL, Zhang SY. Combined gastroscopic and laparoscopic resection of gastric metastatic adenosquamous carcinoma from lung: A case report. World J Gastrointest Surg 2024; 16(9): 3065-3073
- URL: https://www.wjgnet.com/1948-9366/full/v16/i9/3065.htm
- DOI: https://dx.doi.org/10.4240/wjgs.v16.i9.3065


