Copyright
©The Author(s) 2024.
World J Gastrointest Surg. Sep 27, 2024; 16(9): 2996-3007
Published online Sep 27, 2024. doi: 10.4240/wjgs.v16.i9.2996
Published online Sep 27, 2024. doi: 10.4240/wjgs.v16.i9.2996
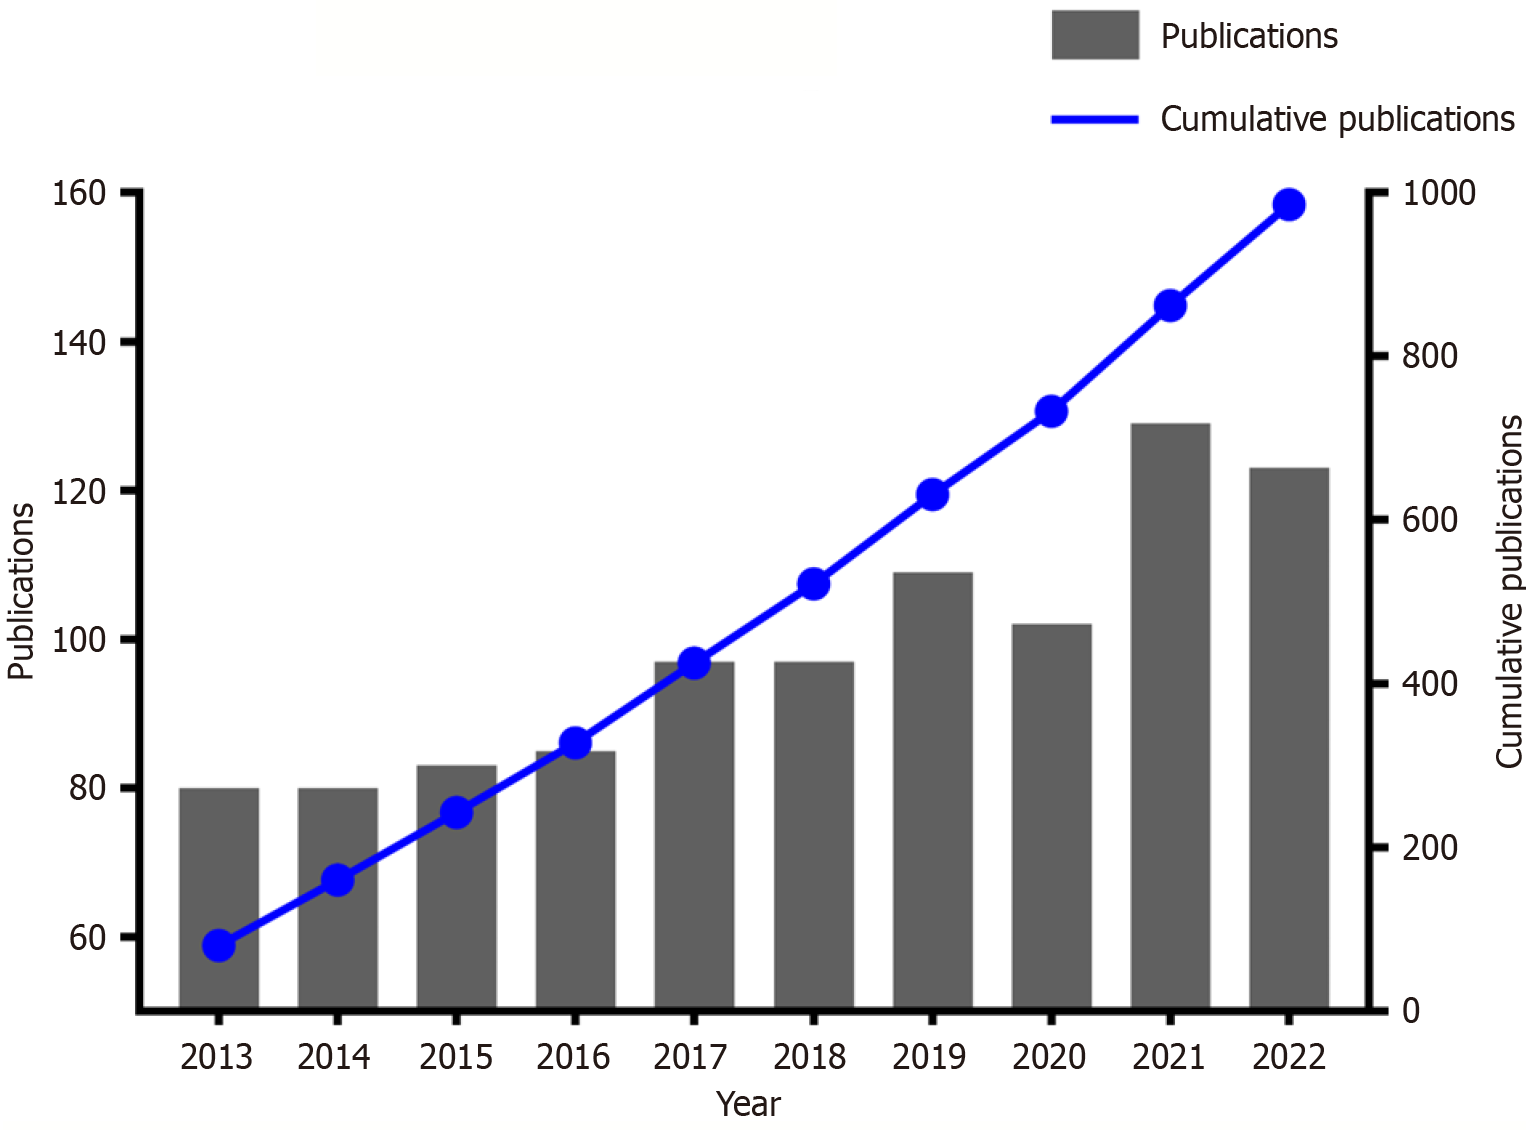
Figure 1
Trends of related annual publications.
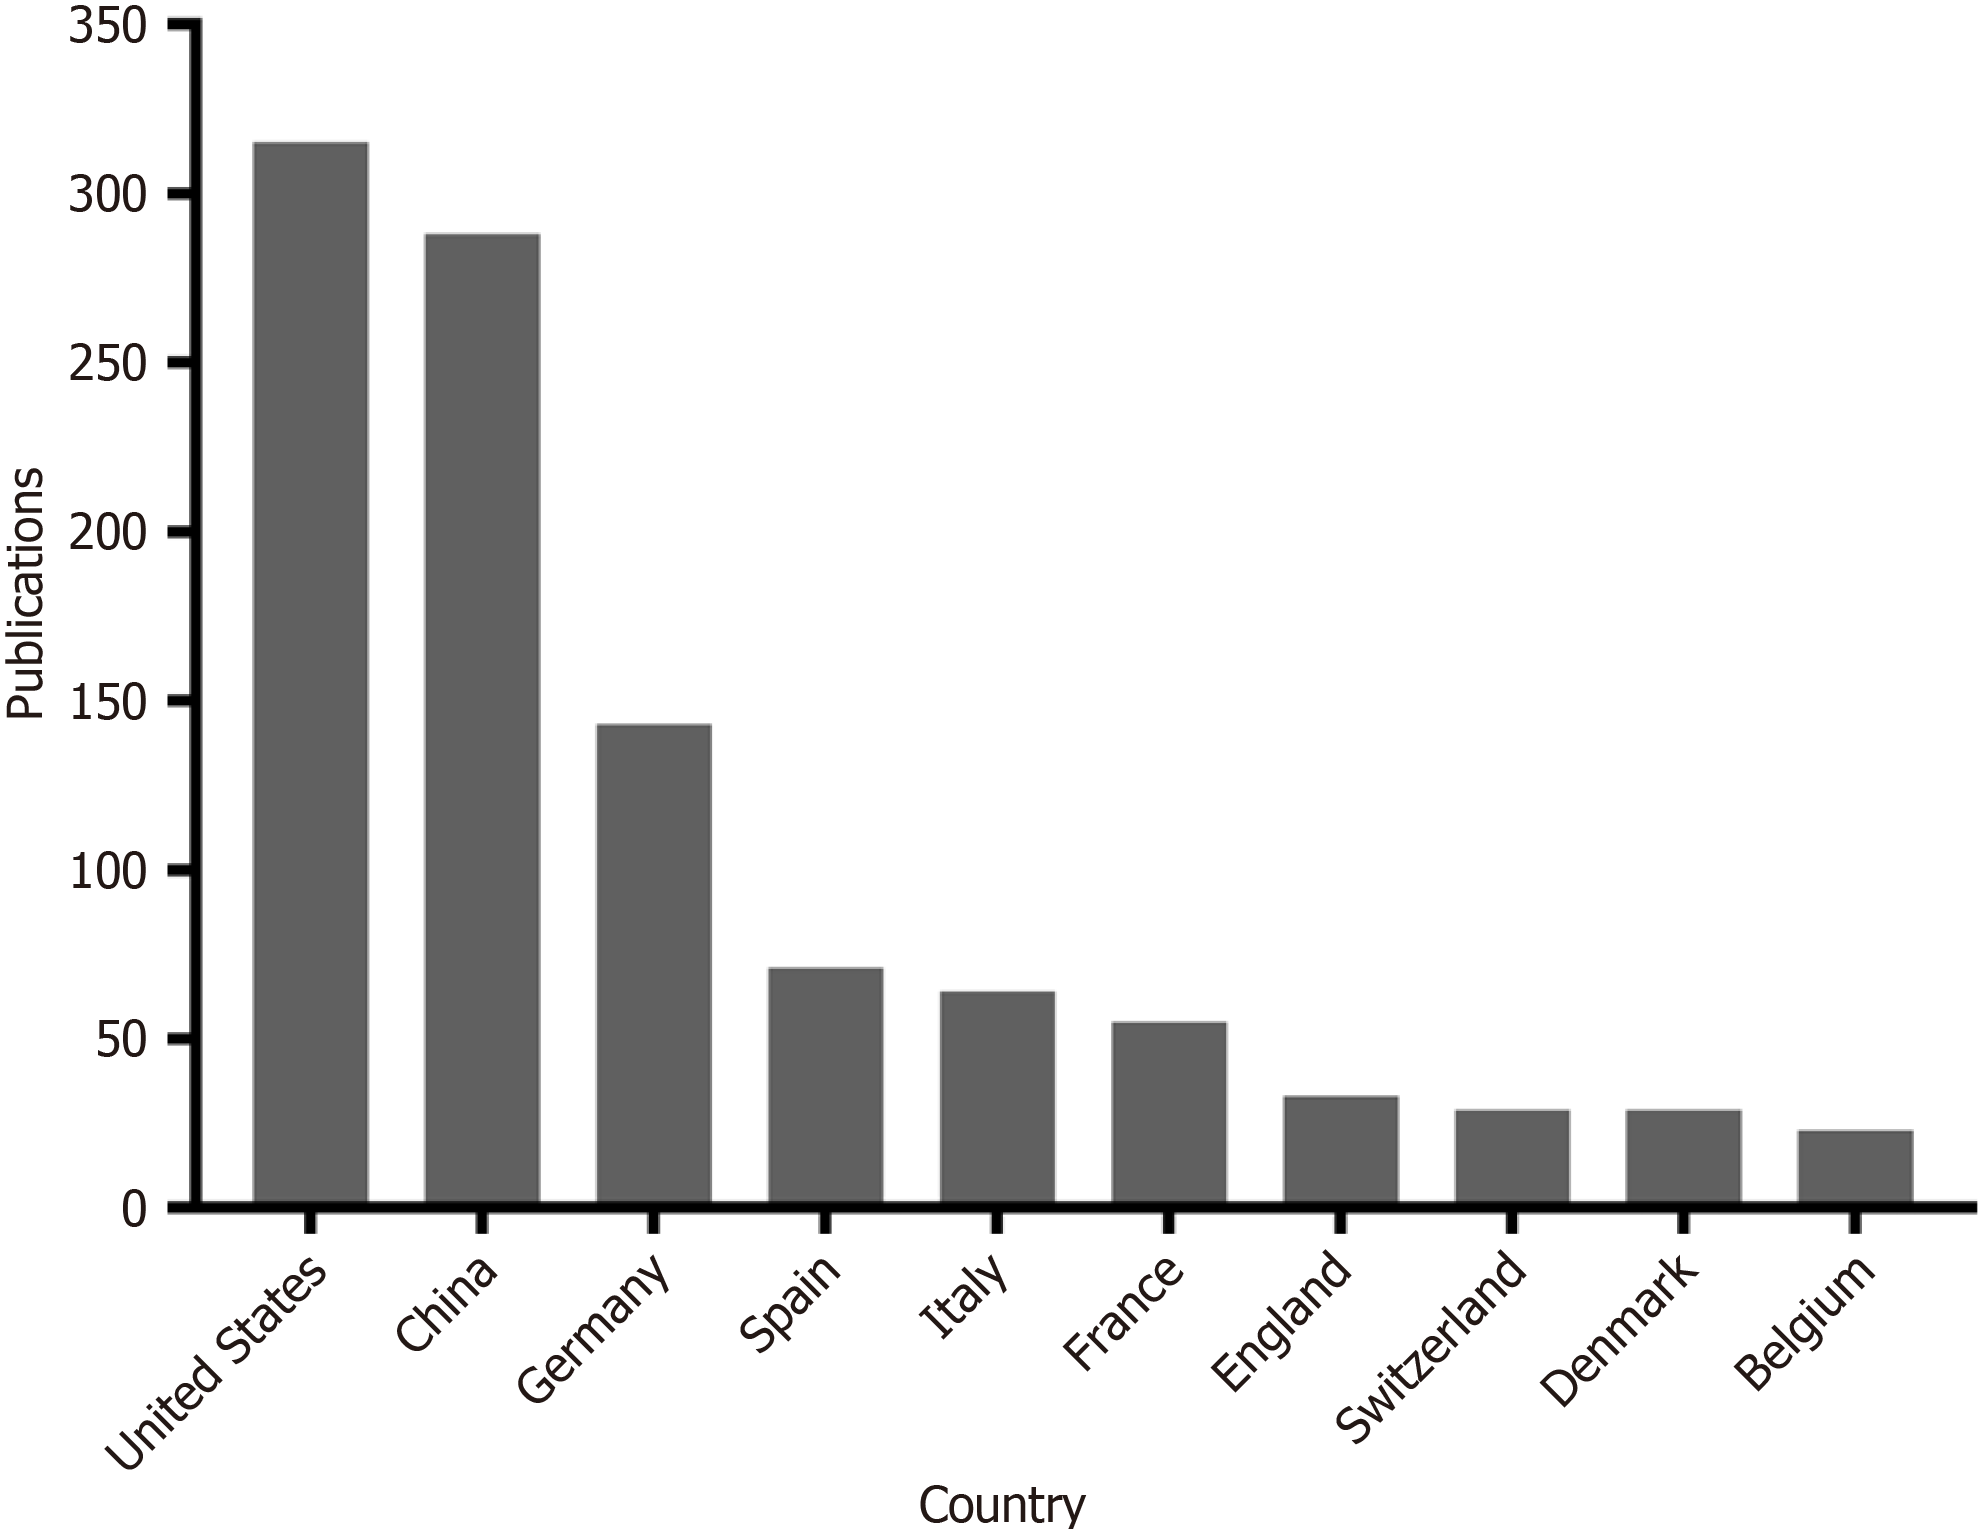
Figure 2
Top 10 countries in international cooperation.
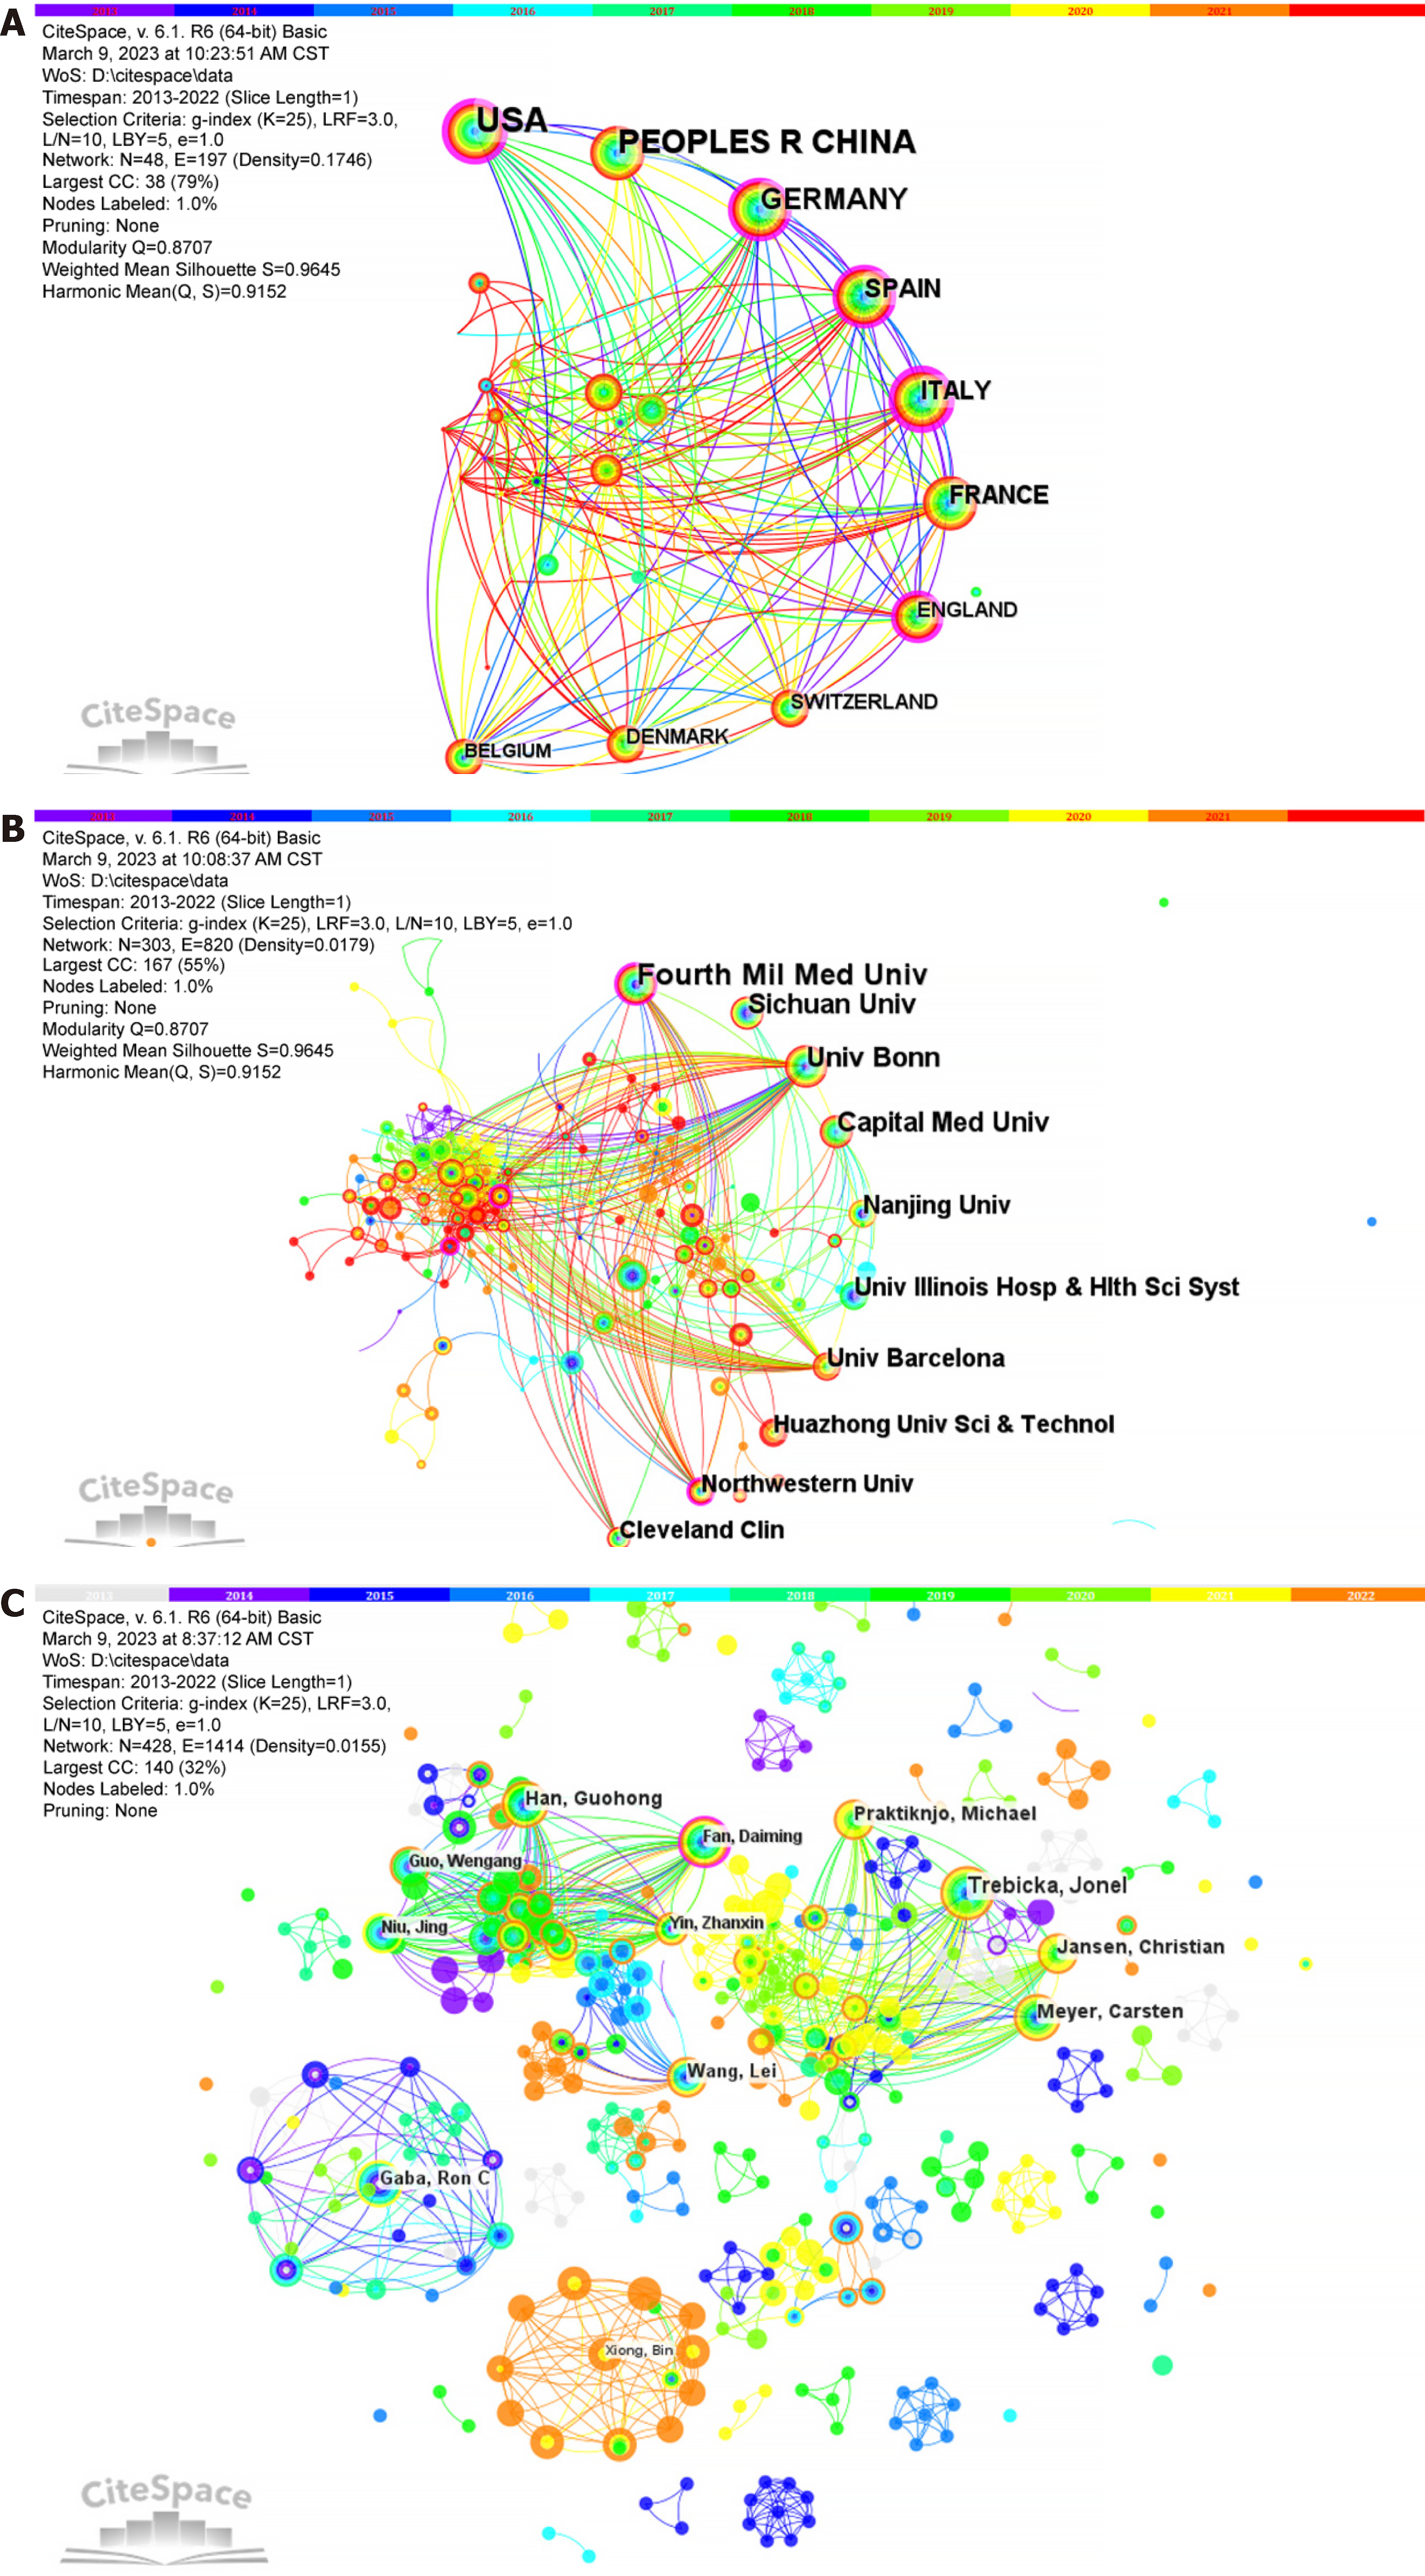
Figure 3 Network map.
A: Network map of national cooperation. Each node represents a country. The purple outer circle of a node indicates a high degree of betweenness centrality. The color and thickness of the inner circle of a node represent the number of publications in different years. The size of the node is proportional to the total number of publications. The lines between countries represent cooperative relationships, and the color of the line represents the first instance of cooperation. The thicker the line is, the closer the cooperation; B: Network map of institutional cooperation. Each node represents an institution. The purple outer circle of a node indicates a high degree of betweenness centrality. The color and thickness of the inner circle of a node represent the number of publications in different years. The size of the node is proportional to the total number of publications. The lines between institutions represent cooperative relationships, and the color of the line represents the first instance of cooperation. The thicker the line is, the closer the cooperation; C: Network map of authors’ cooperation. Each node represents an author. The purple outer circle of a node indicates a high degree of betweenness centrality. The color and thickness of the inner circle of a node represent the number of publications in different years. The size of the node is proportional to the total number of publications. The lines between authors represent cooperative relationships, and the color of the line represents the first instance of cooperation. The thicker the line is, the closer the cooperation.
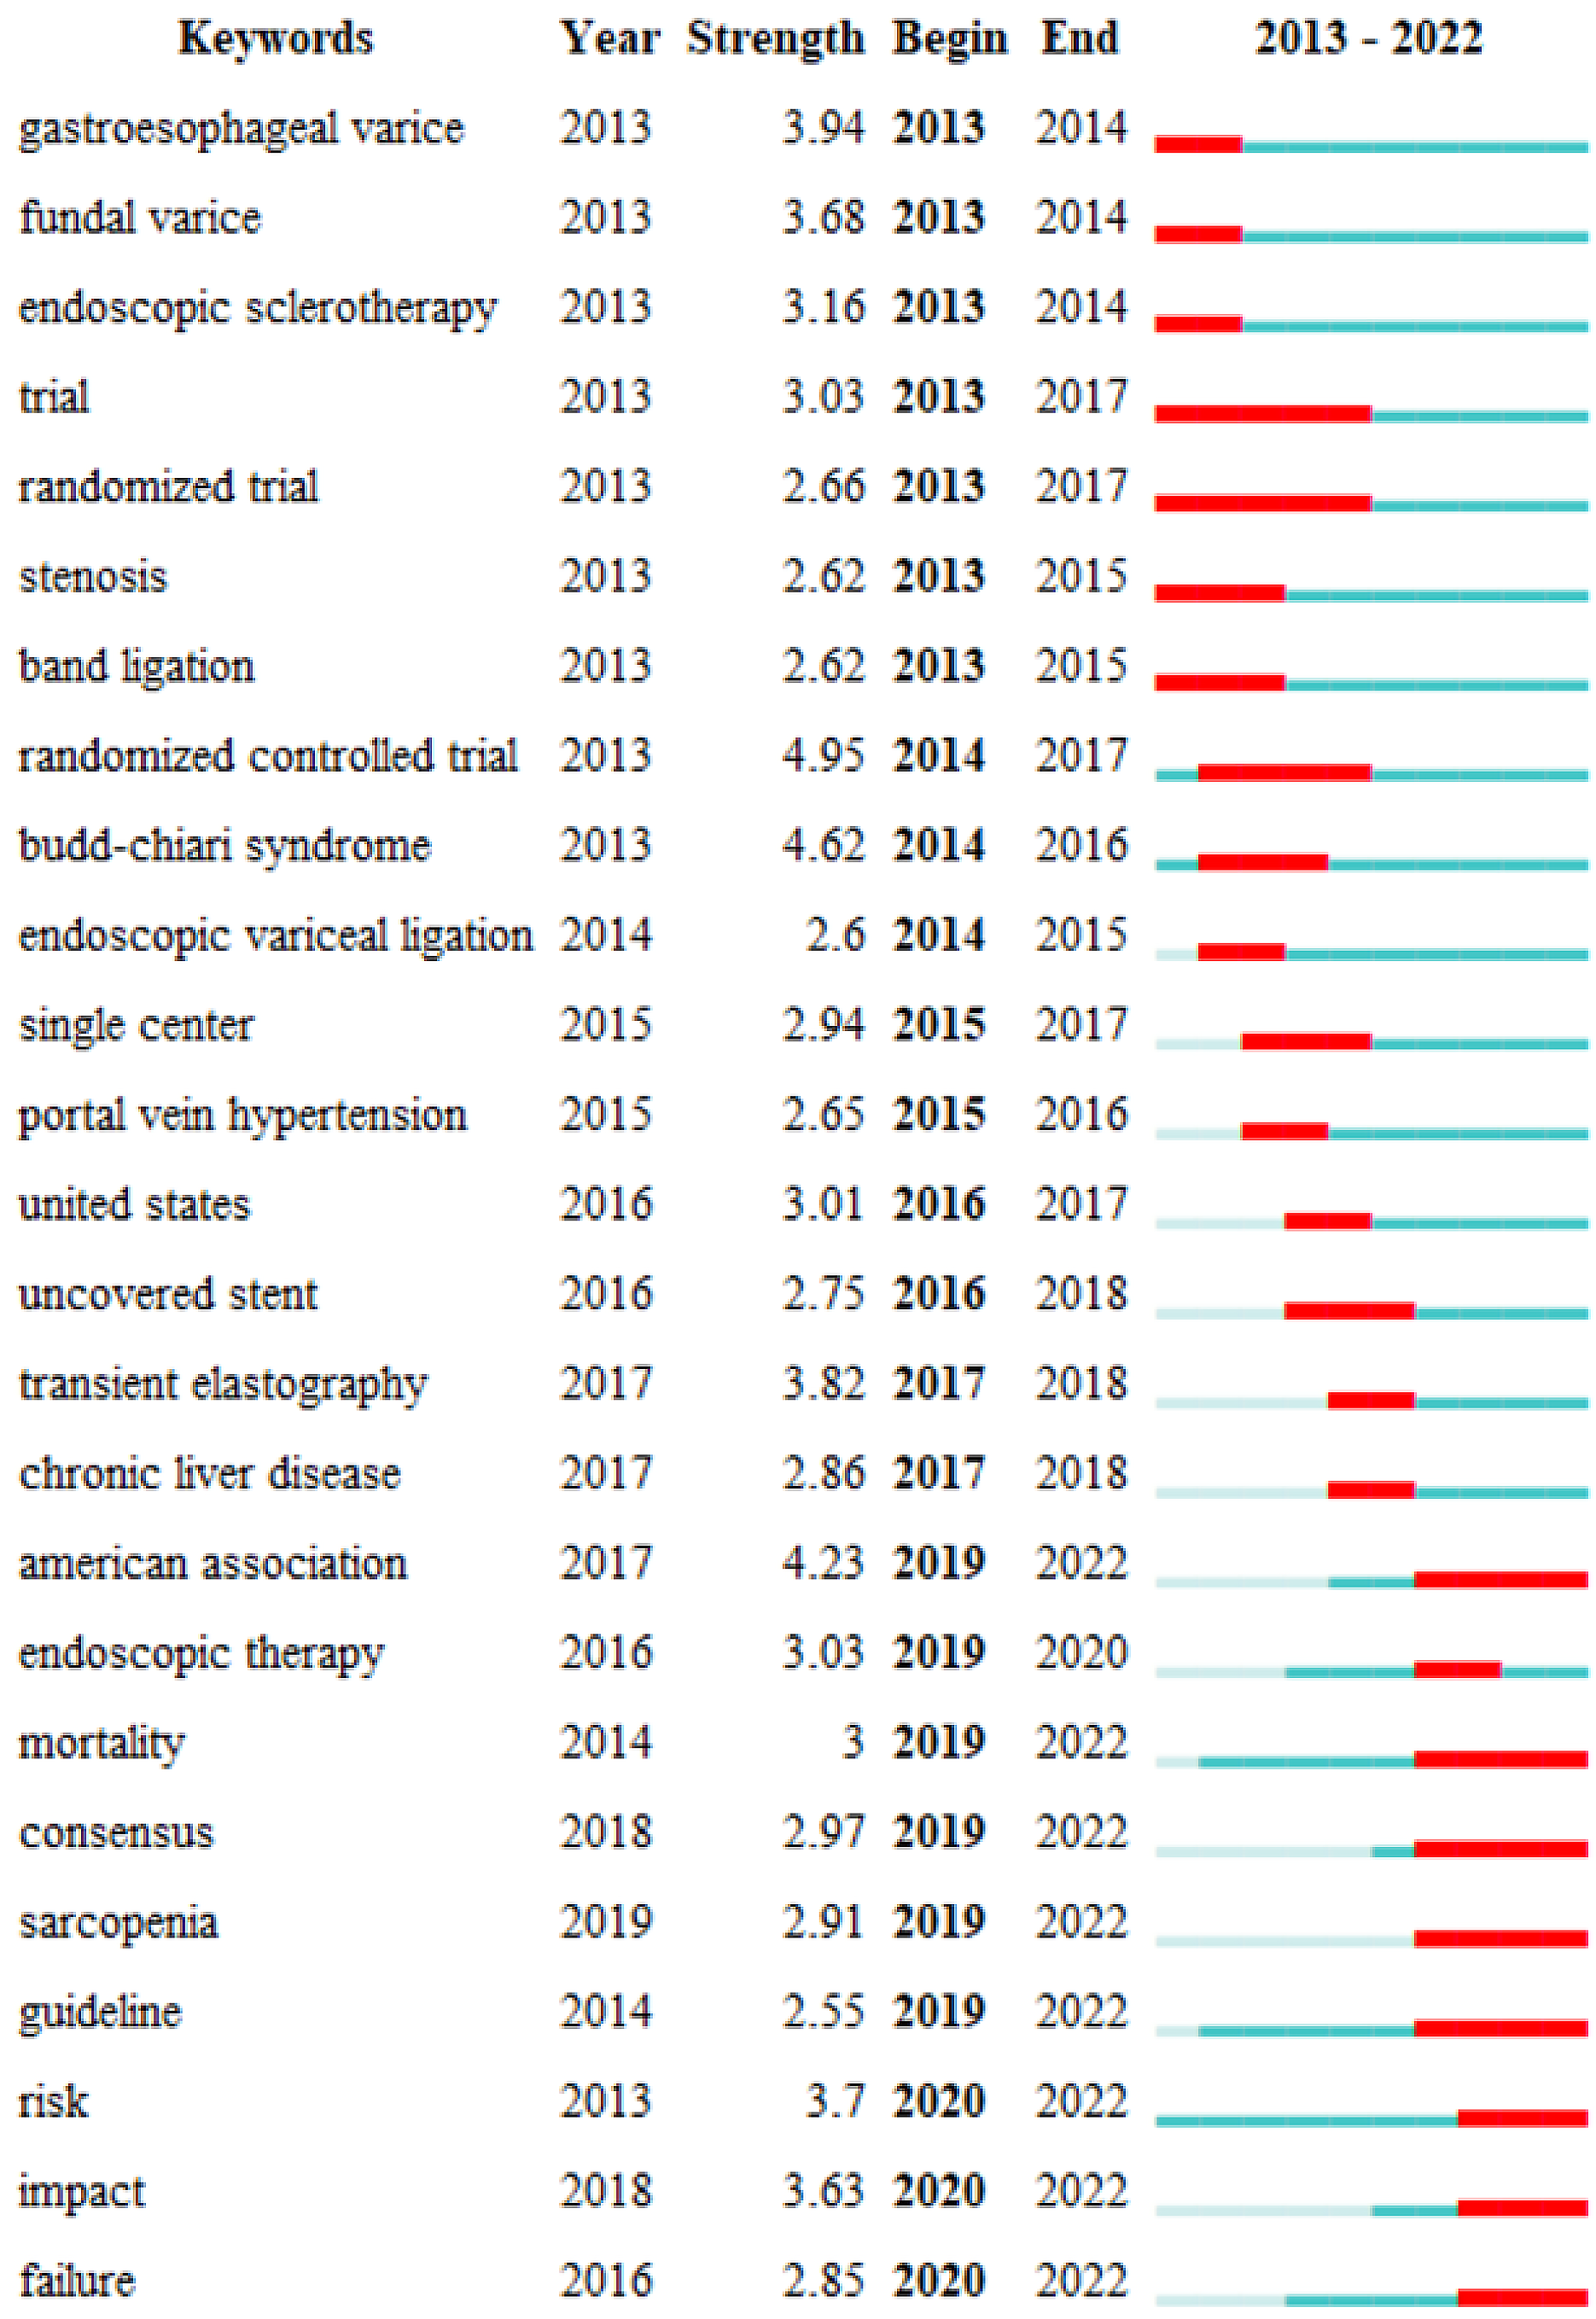
Figure 4 Top 25 keywords with the strongest citation bursts.
The year indicates the first time the keyword appears. The red bars show when citation bursts start and end and how long they last.
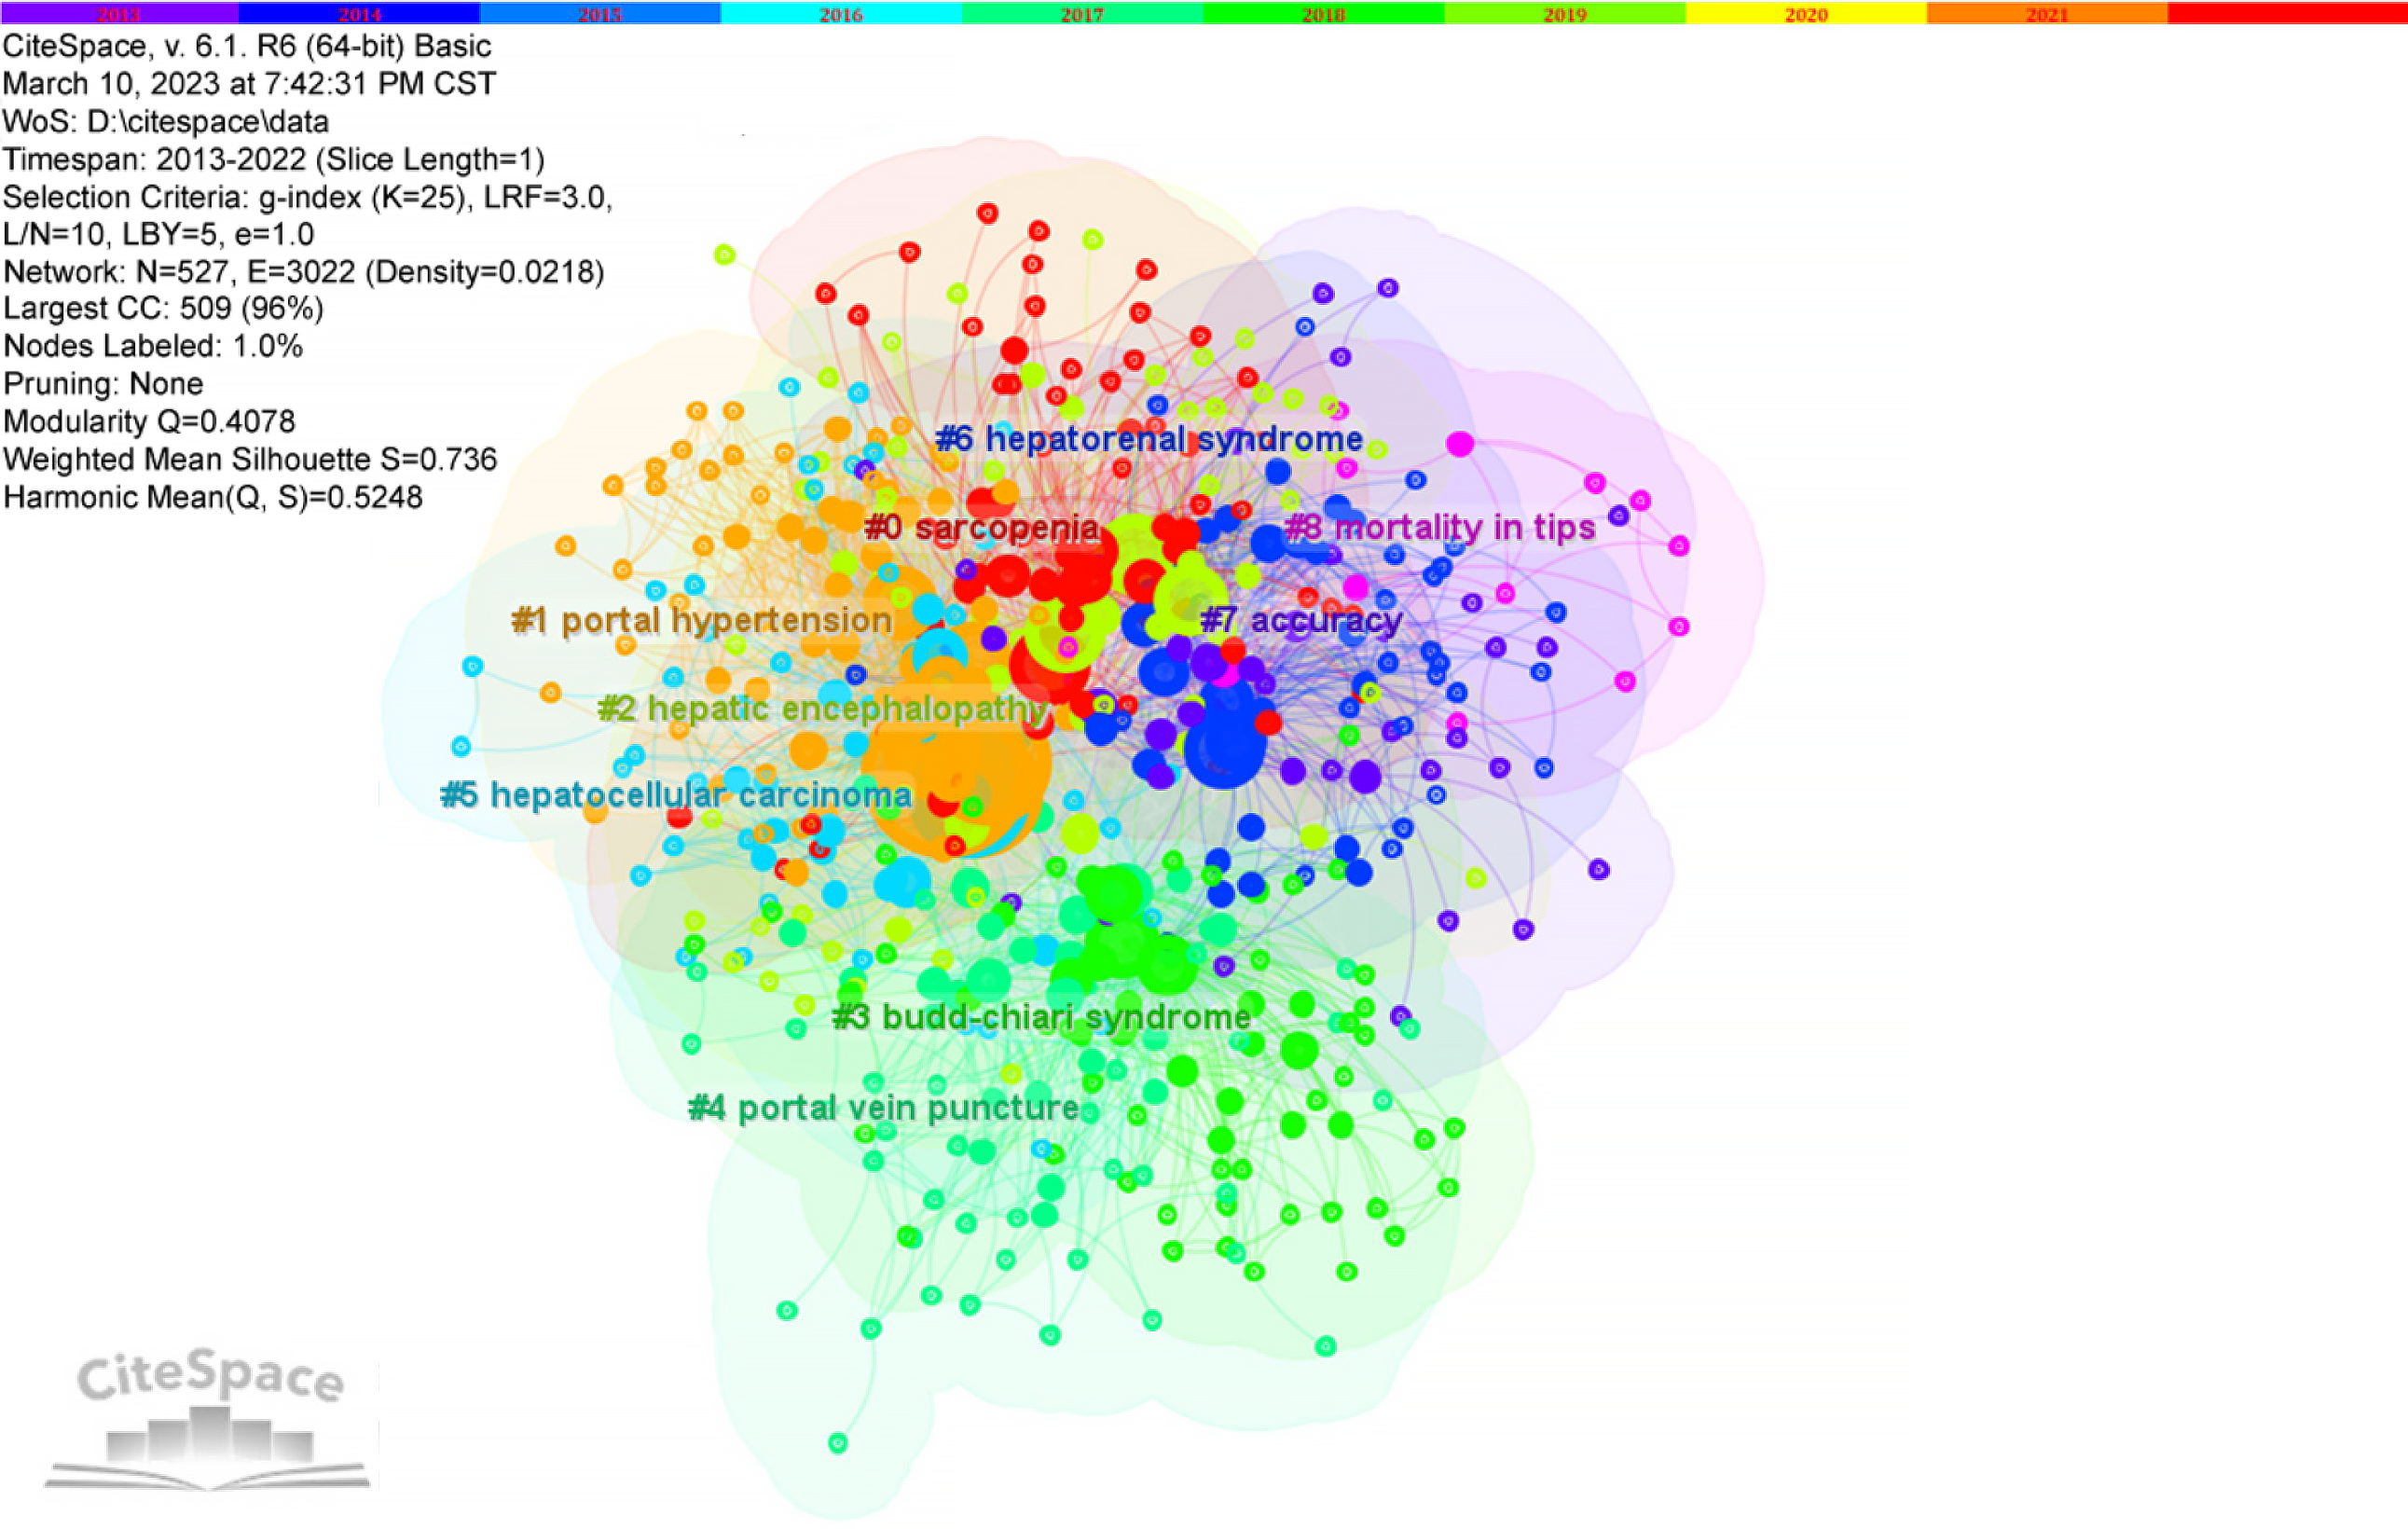
Figure 5 Co-occurrence clustering keyword network.
Each node represents a keyword, and the connection between keywords represents the co-occurrence relationship. The nodes with different colors in the clustering style represent different clusters. To clearly indicate the scope of a cluster, CiteSpace uses polygons to add shading to the clusters, which shows the boundaries of the clusters.
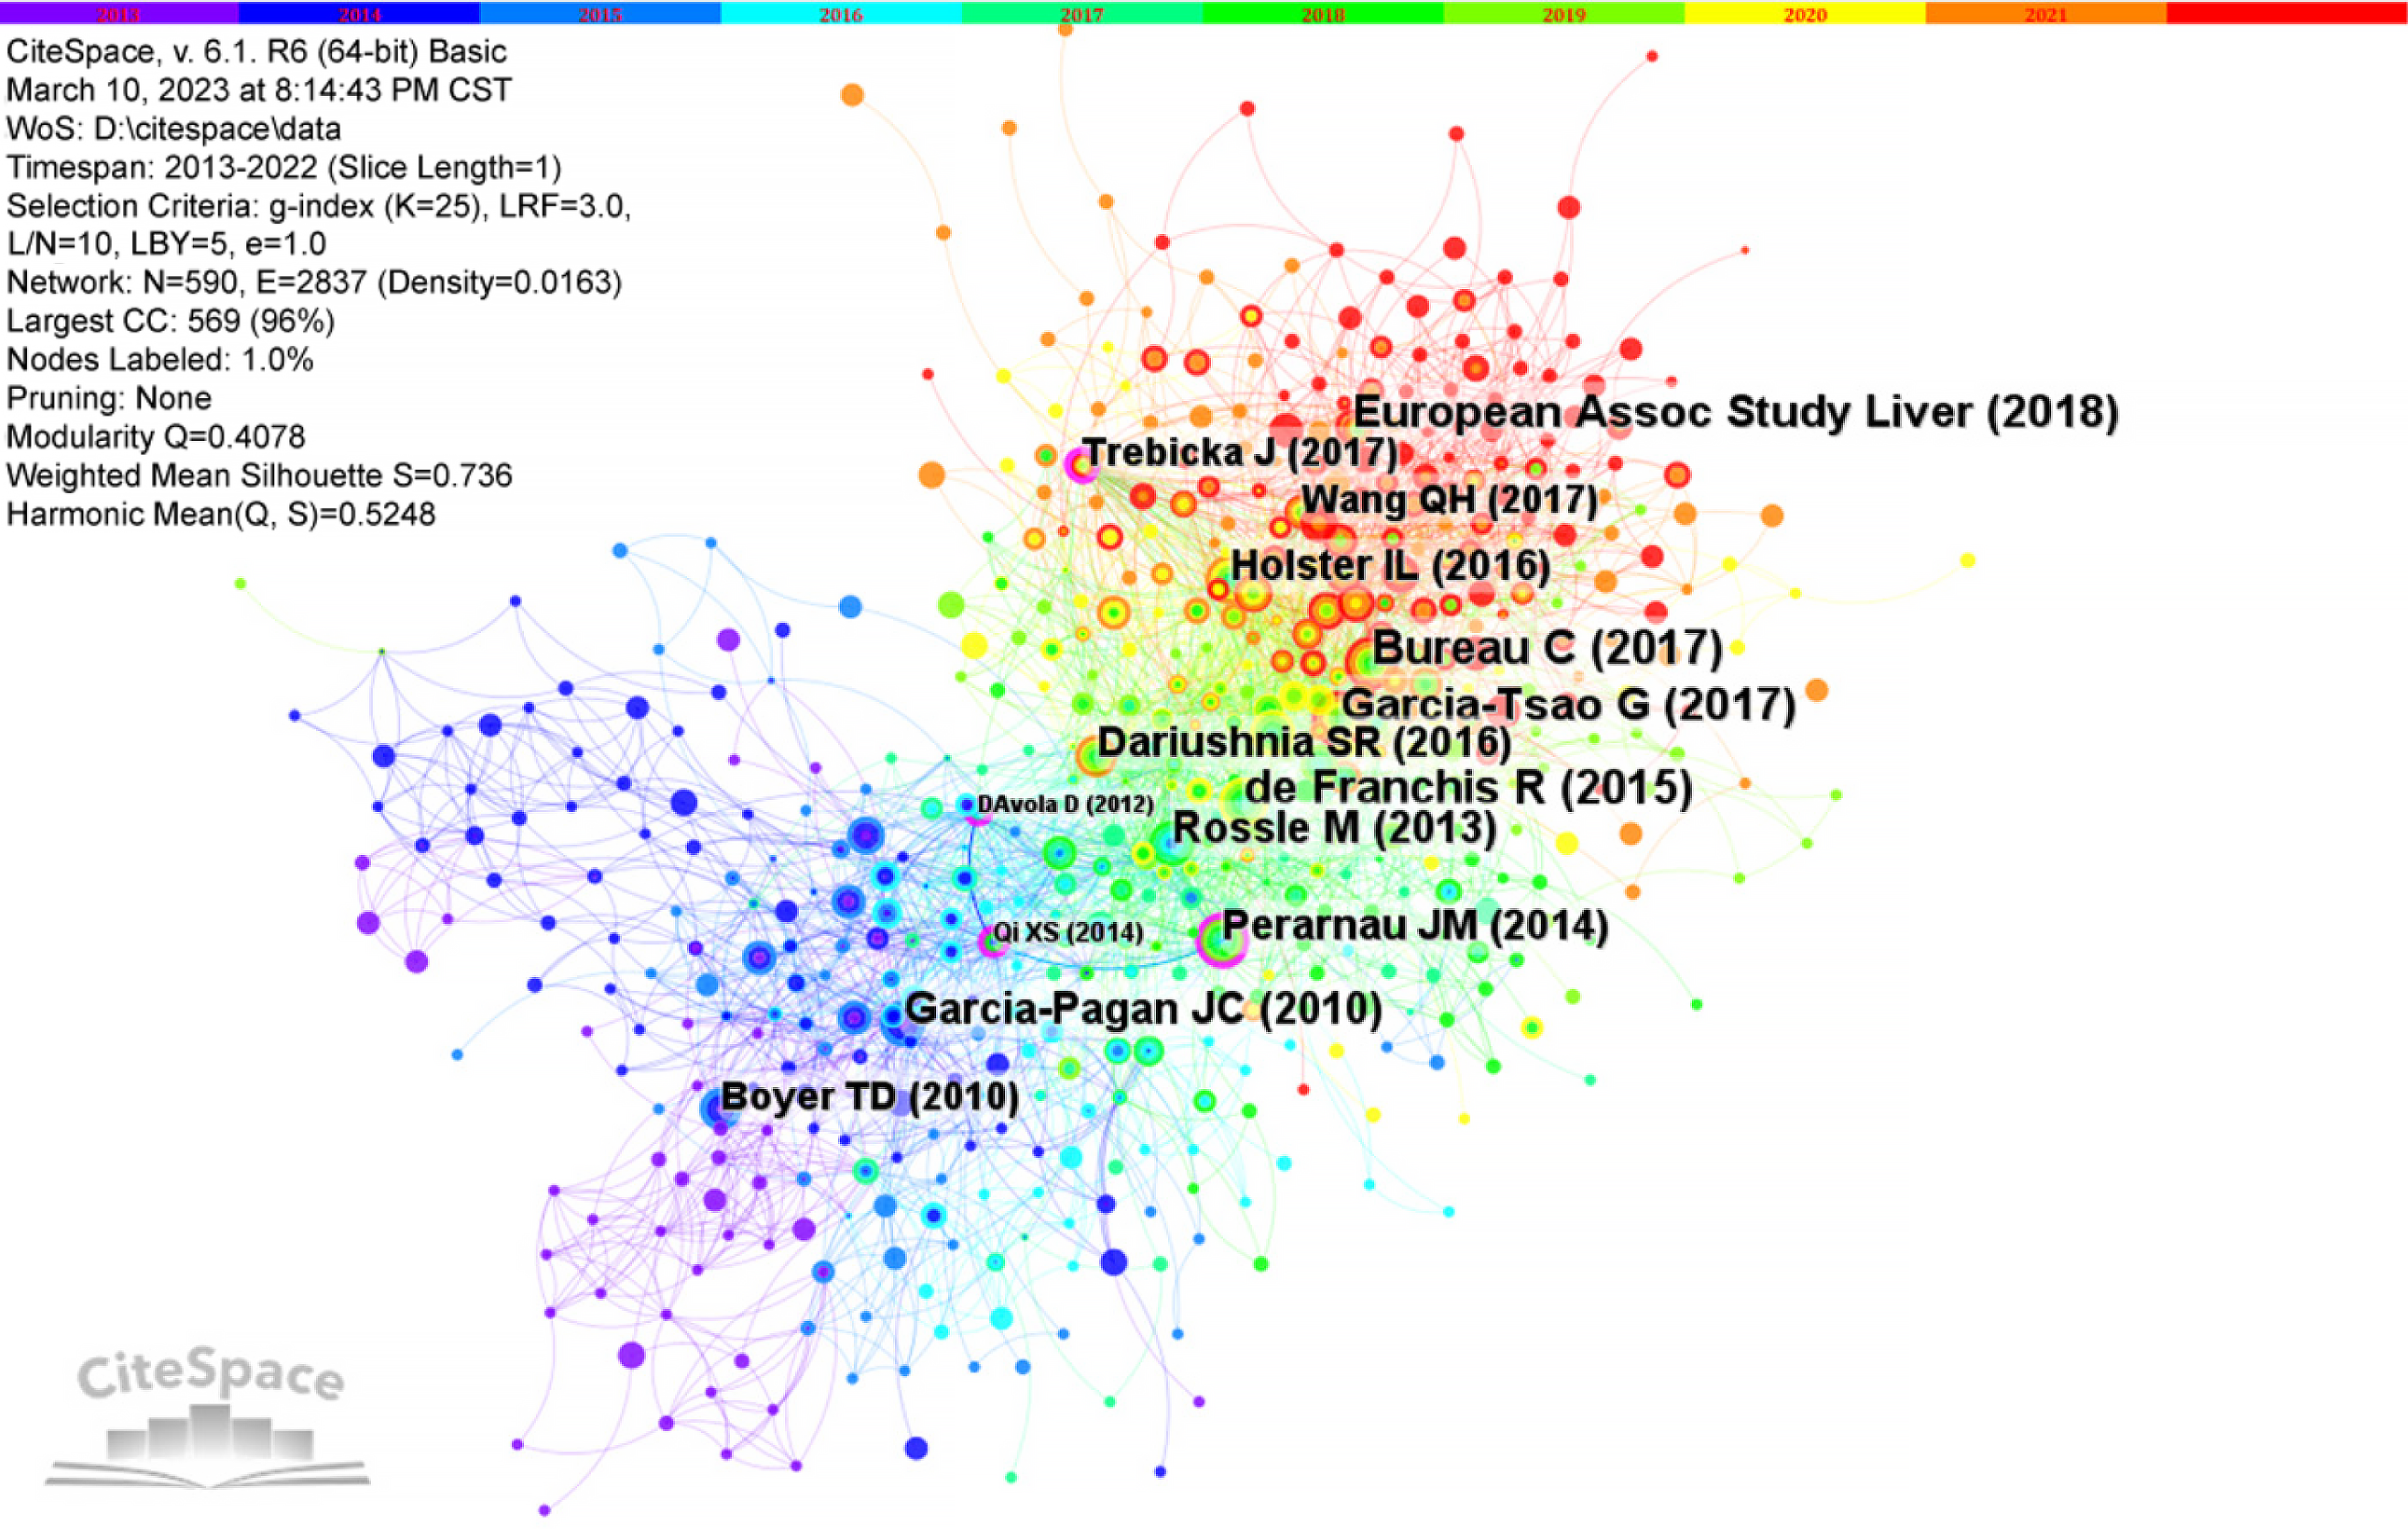
Figure 6 Co-cited reference network.
Each node represents a co-cited reference, and the purple outer circle of the node indicates a high betweenness centrality. The size of the node is proportional to the number of co-citations. The connection between nodes represents the co-citation relationship, and the color of the connection represents the time of the first co-citation. The thicker the connection is, the stronger the link between co-citations.
- Citation: Que ZL, Wu MS, Lai SJ, He YQ, Zhou YB, Gui SP, Wen LZ. Research status and hotspots in transjugular intrahepatic portosystemic shunts based on CiteSpace bibliometric analysis. World J Gastrointest Surg 2024; 16(9): 2996-3007
- URL: https://www.wjgnet.com/1948-9366/full/v16/i9/2996.htm
- DOI: https://dx.doi.org/10.4240/wjgs.v16.i9.2996


