Copyright
©The Author(s) 2024.
World J Gastrointest Surg. Sep 27, 2024; 16(9): 2902-2909
Published online Sep 27, 2024. doi: 10.4240/wjgs.v16.i9.2902
Published online Sep 27, 2024. doi: 10.4240/wjgs.v16.i9.2902
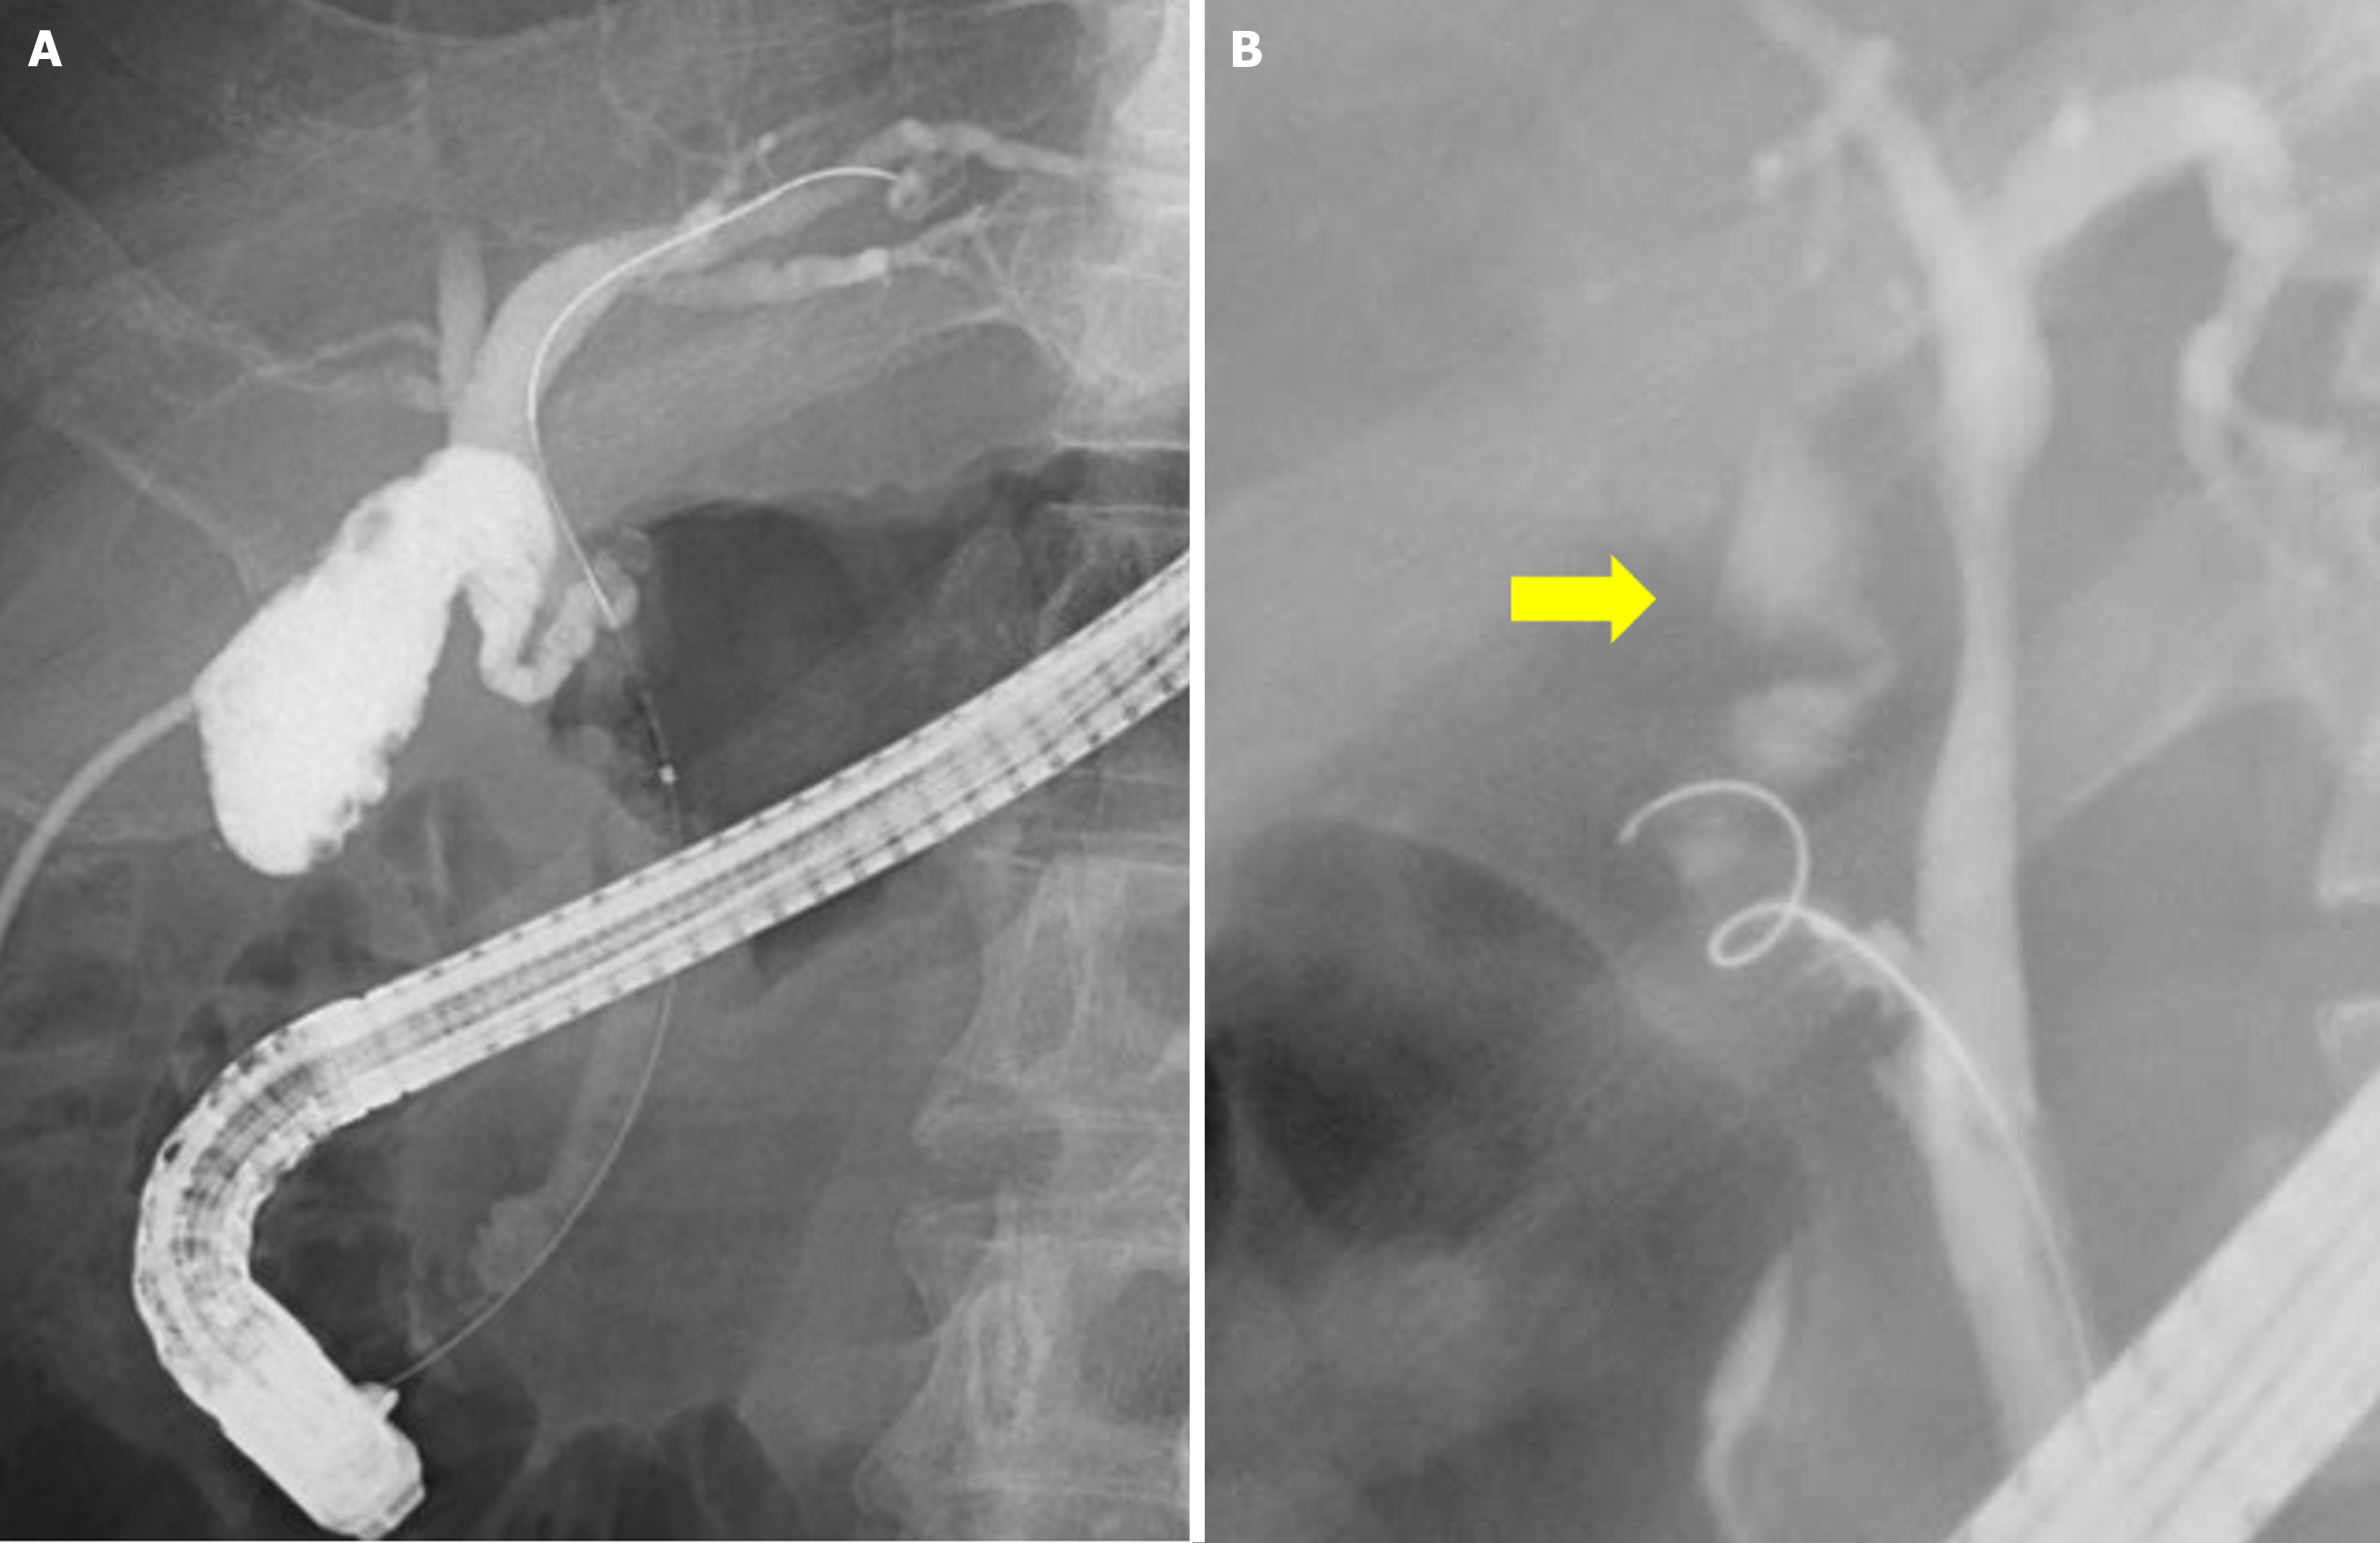
Figure 1 Fluoroscopic images of the cystic duct.
A: Fluoroscopic images of the cystic duct contrast via percutaneous transhepatic gallbladder drainage; B: Fluoroscopic images of cystic duct perforation. The yellow head shows the leakage of the contrast medium into the peritoneal cavity from the cystic duct lumen.
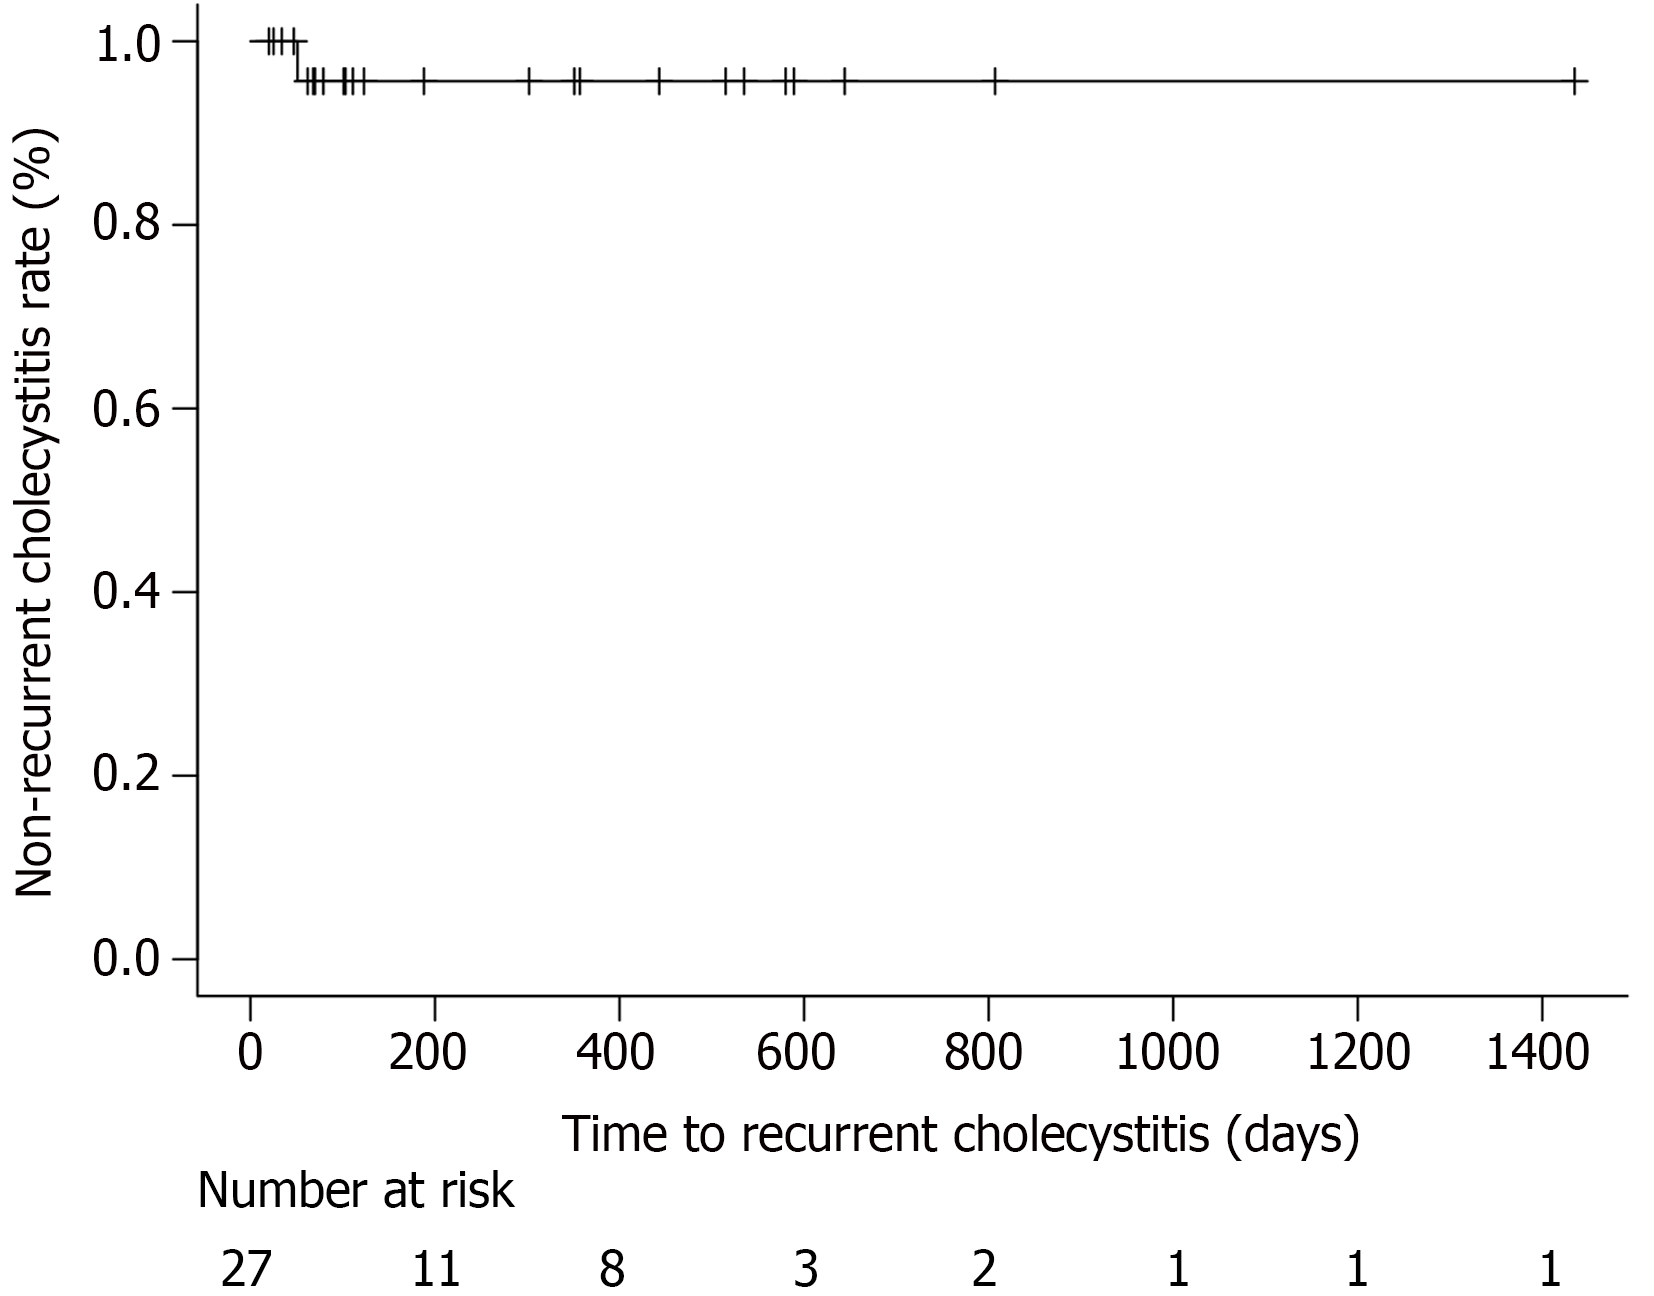
Figure 2 Time to recurrent cholecystitis after endoscopic gallbladder stenting.
The Kaplan-Meier curve for the time to recurrent cholecystitis is shown. Median time to recurrent cholecystitis was not reached.
- Citation: Niiya F, Tamai N, Yamawaki M, Noda J, Azami T, Takano Y, Nishimoto F, Nagahama M. Benefits of endoscopic gallbladder stenting following percutaneous transhepatic gallbladder drainage. World J Gastrointest Surg 2024; 16(9): 2902-2909
- URL: https://www.wjgnet.com/1948-9366/full/v16/i9/2902.htm
- DOI: https://dx.doi.org/10.4240/wjgs.v16.i9.2902


