Copyright
©The Author(s) 2024.
World J Gastrointest Surg. Sep 27, 2024; 16(9): 2842-2852
Published online Sep 27, 2024. doi: 10.4240/wjgs.v16.i9.2842
Published online Sep 27, 2024. doi: 10.4240/wjgs.v16.i9.2842
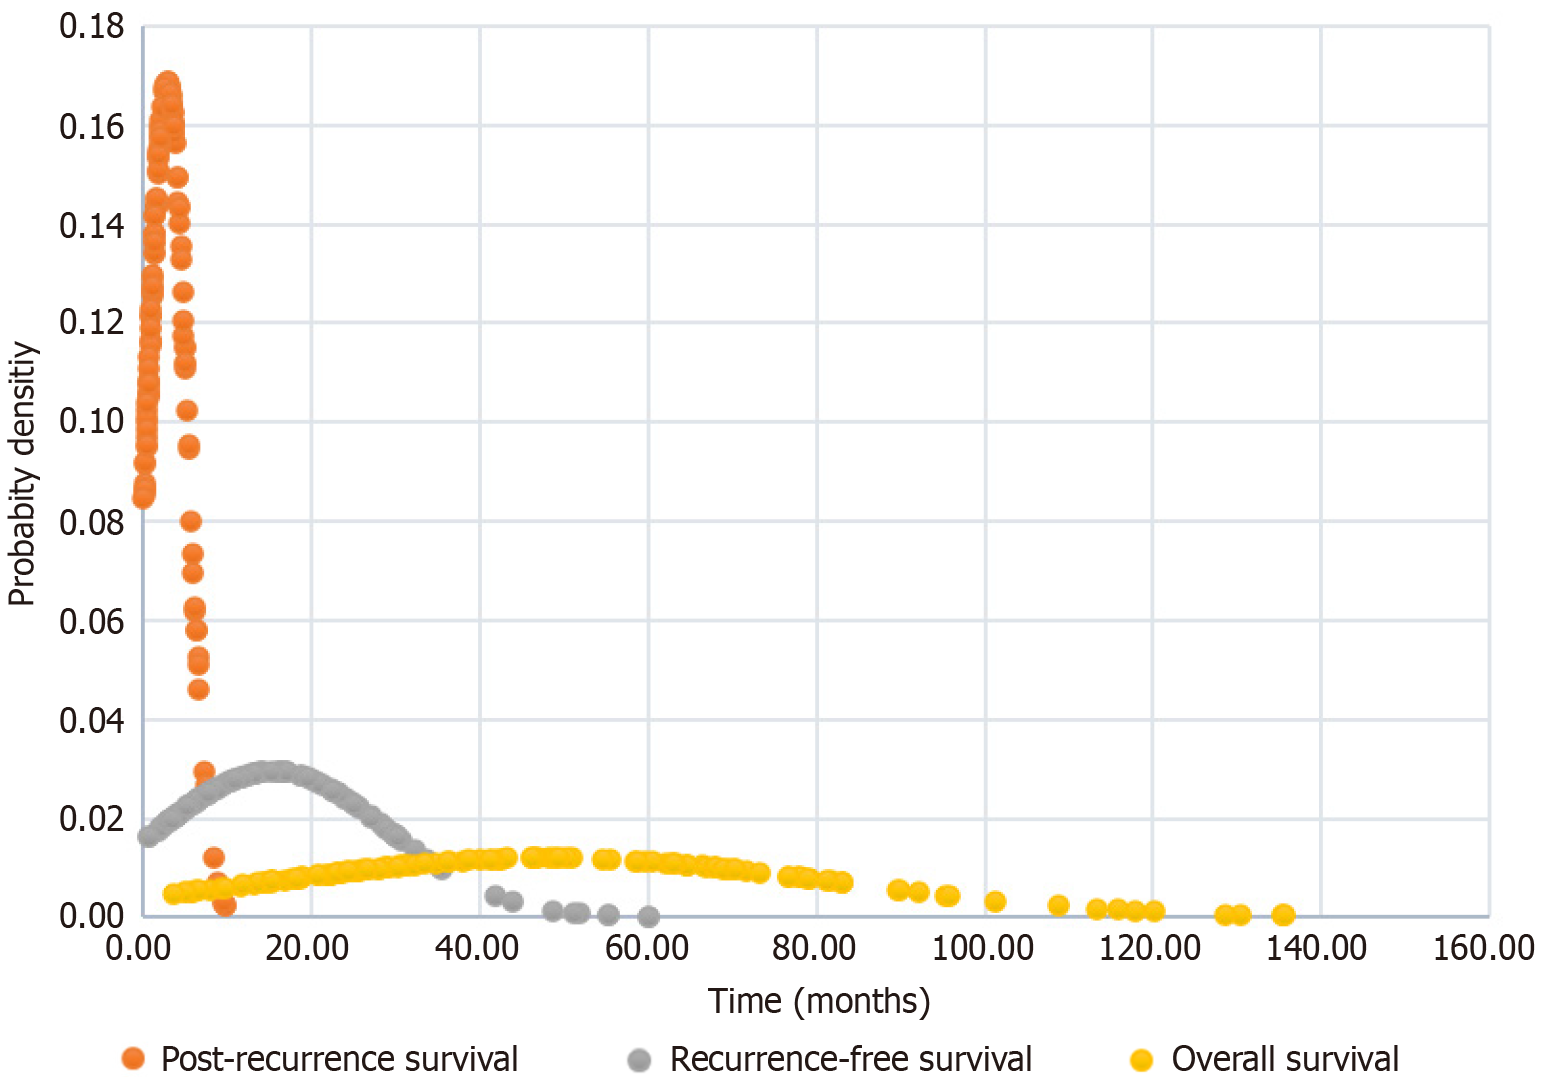
Figure 1
Probability density plot of overall survival, recurrence-free survival, and post-recurrence survival distribution in all patients.
Figure 2 Correlation between all patients.
A: Recurrence-free survival (RFS) and overall survival; B: RFS and post-recurrence survival.
Figure 3 Kaplan–Meier curves.
A: Overall survival between early and late recurrence (LR); B: Post-recurrence survival between early and LR.
- Citation: Tsai TJ, Syu KJ, Huang XY, Liu YS, Chen CW, Wu YH, Lin CM, Chang YY. Identifying timing and risk factors for early recurrence of resectable rectal cancer: A single center retrospective study. World J Gastrointest Surg 2024; 16(9): 2842-2852
- URL: https://www.wjgnet.com/1948-9366/full/v16/i9/2842.htm
- DOI: https://dx.doi.org/10.4240/wjgs.v16.i9.2842


