Copyright
©The Author(s) 2024.
World J Gastrointest Surg. Jul 27, 2024; 16(7): 2255-2269
Published online Jul 27, 2024. doi: 10.4240/wjgs.v16.i7.2255
Published online Jul 27, 2024. doi: 10.4240/wjgs.v16.i7.2255
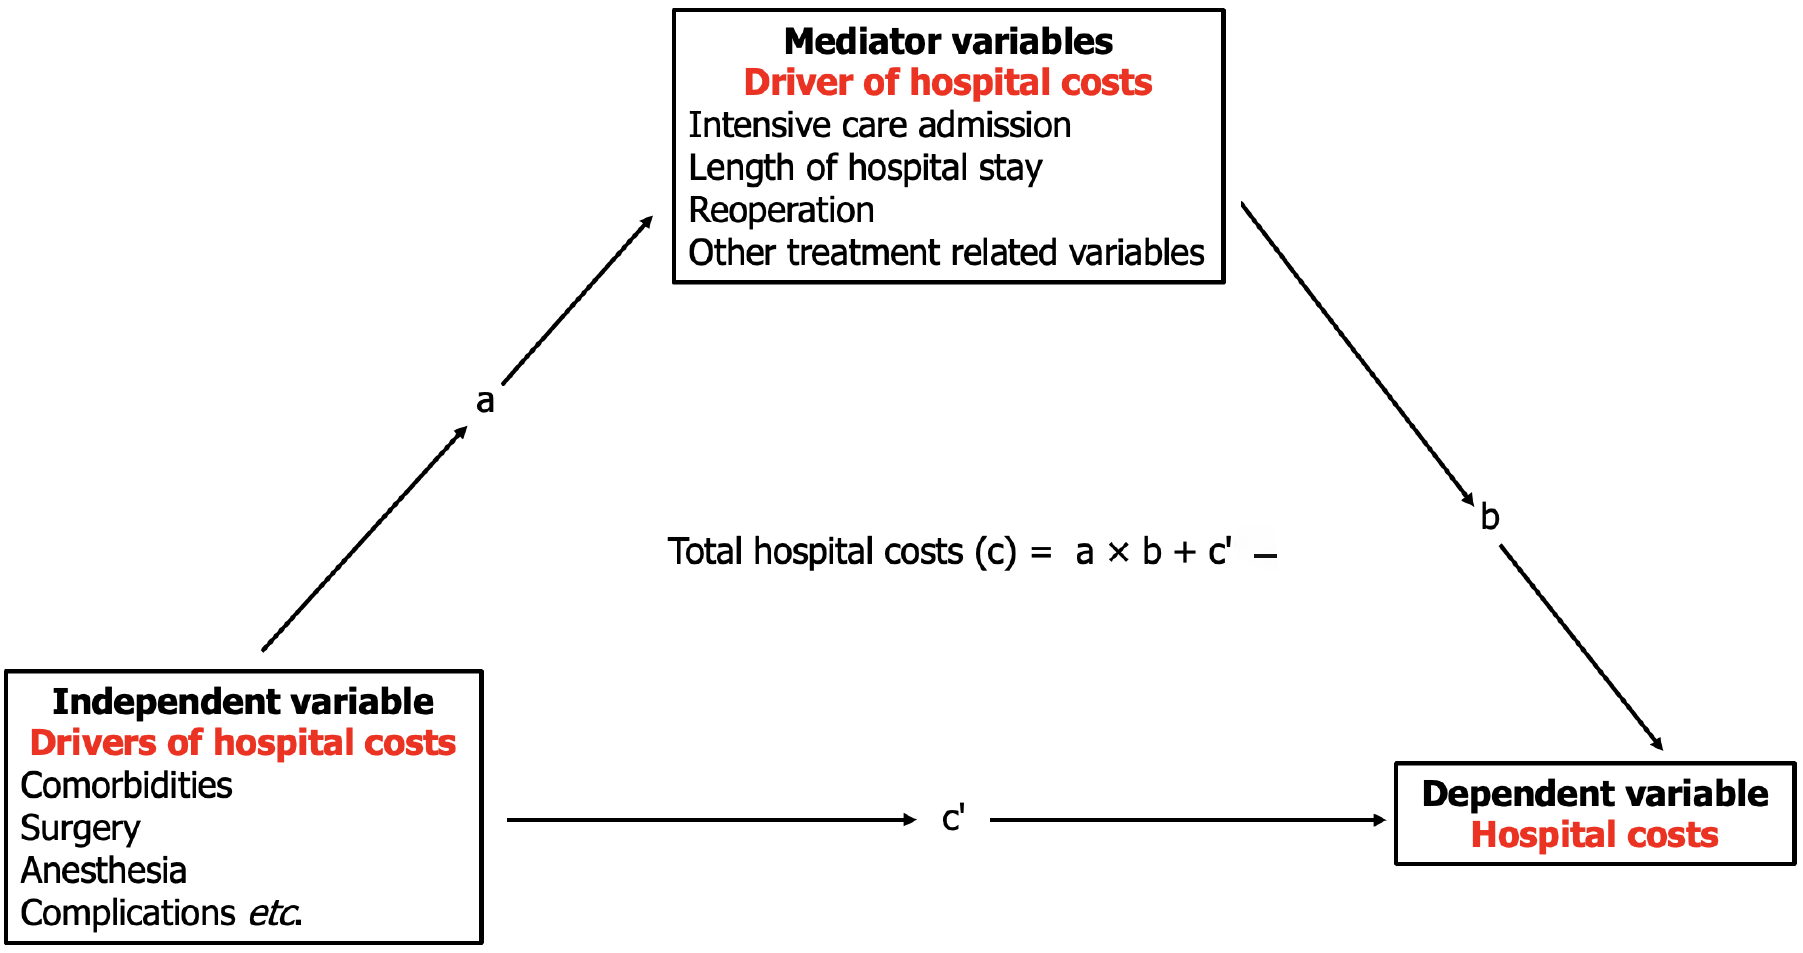
Figure 1 Mediation effects analysis model.
a: The effect of drivers of hospital costs on other drivers of hospital costs; b: The effect on hospital costs; c’: The direct effect of drivers of hospital costs on hospital costs adjusted to the mediator (c - ab); c: The total hospital costs, including the mediator variables. The indirect effect is the product of coefficients a and b (ab) and the difference between the c coefficient and c’ coefficient (c-c’).
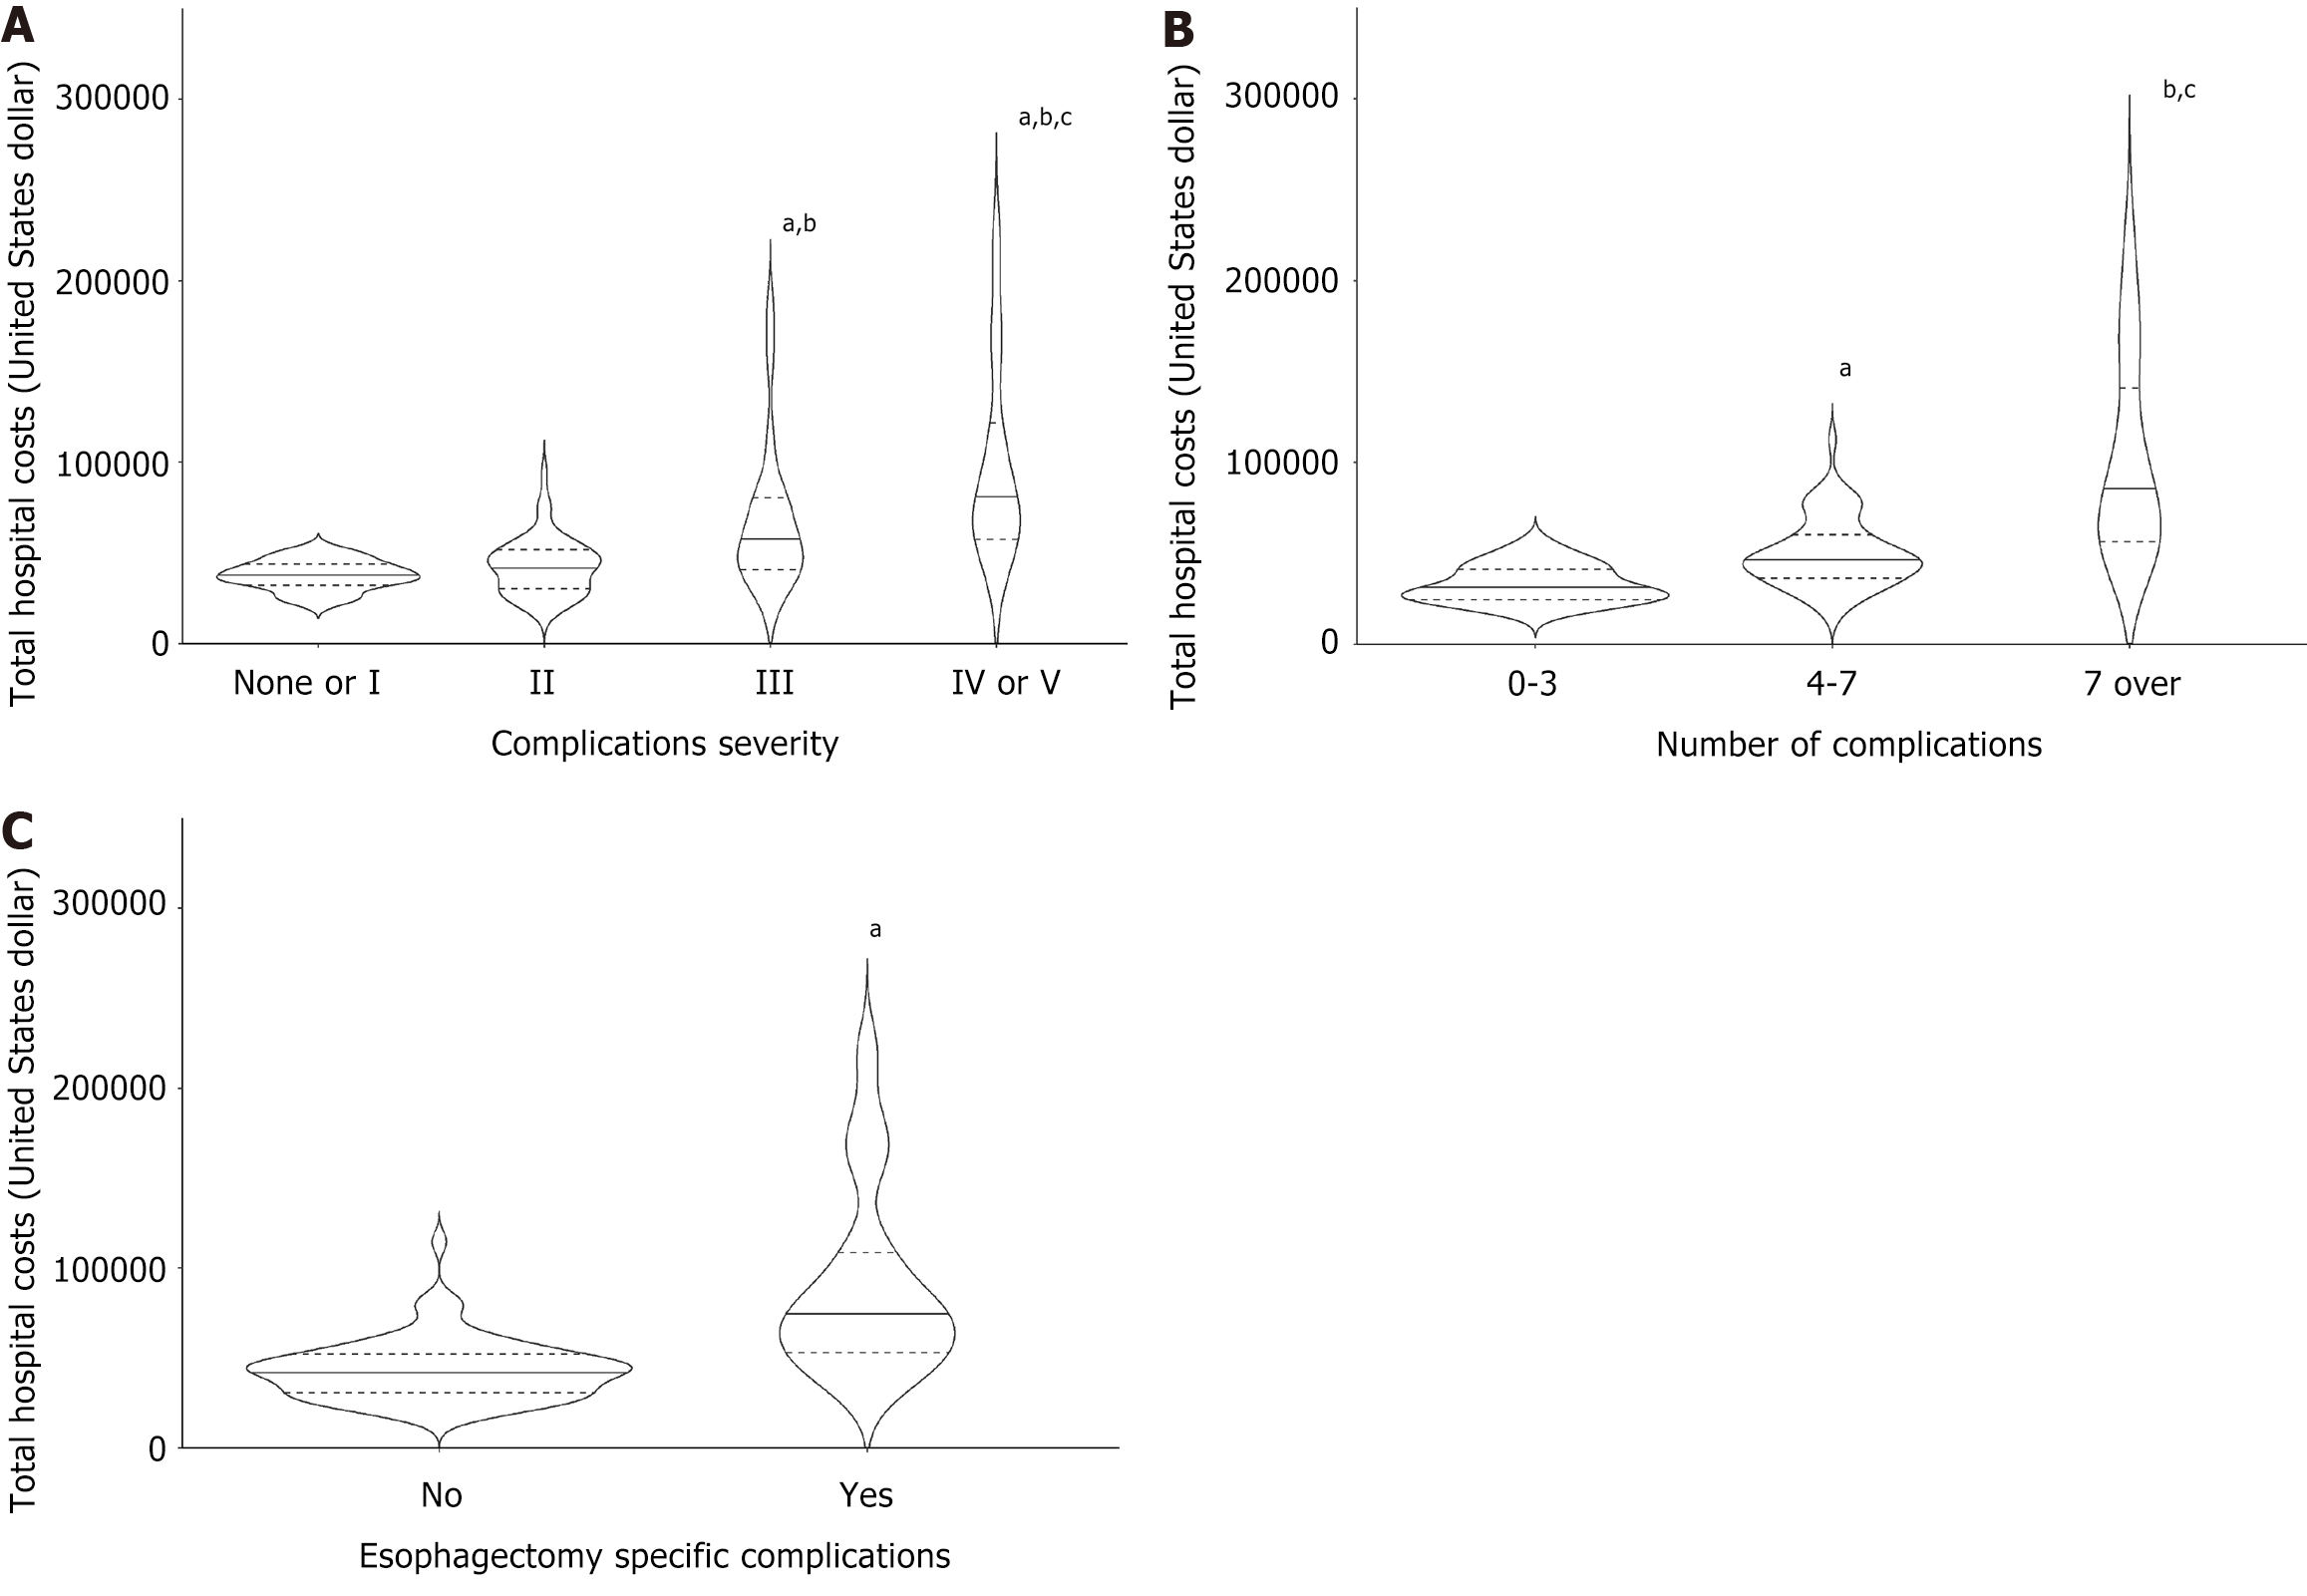
Figure 2 Unadjusted cost.
A: Unadjusted cost comparison by the severity of complications. A line indicates the median, and a dashed line indicates the 1st and 3rd quartiles. The height of each graph indicates the maximum cost range, and the width of each graph plots the kernel density estimate. Kruskal-Wallis rank sum test: Χ2 = 37.843, df = 3, P < 0.001. Pairwise comparisons using the Wilcoxon rank sum test with continuity correction. aP < 0.05 vs no complication or CD I, bP < 0.05 vs CD II, cP < 0.05 vs CD III; B: Unadjusted cost comparison by the number of complications. A line indicates the median, and a dashed line indicates the 1st and 3rd quartiles. The height of each graph indicates the maximum cost range, and the width of each graph plots the kernel density estimate. Kruskal-Wallis rank sum test: Χ2 = 47.606, df = 2, P < 0.001. Pairwise comparisons using the Wilcoxon rank sum test with continuity correction. aP < 0.05 vs 0-3 complications, bP < 0.05 vs 4-7 complications, cP < 0.05 vs higher number of complications more than 7; C: Unadjusted hospital costs between the patients with and without esophagectomy specific complications. A line indicates the median and dashed line indicates the 1st and 3rd quartiles. The height of each graph indicates maximum cost range, and the width of each graph plots the kernel density estimate. Wilcoxon rank sum test with continuity correction. W = 400, P < 0.001. aP < 0.05.
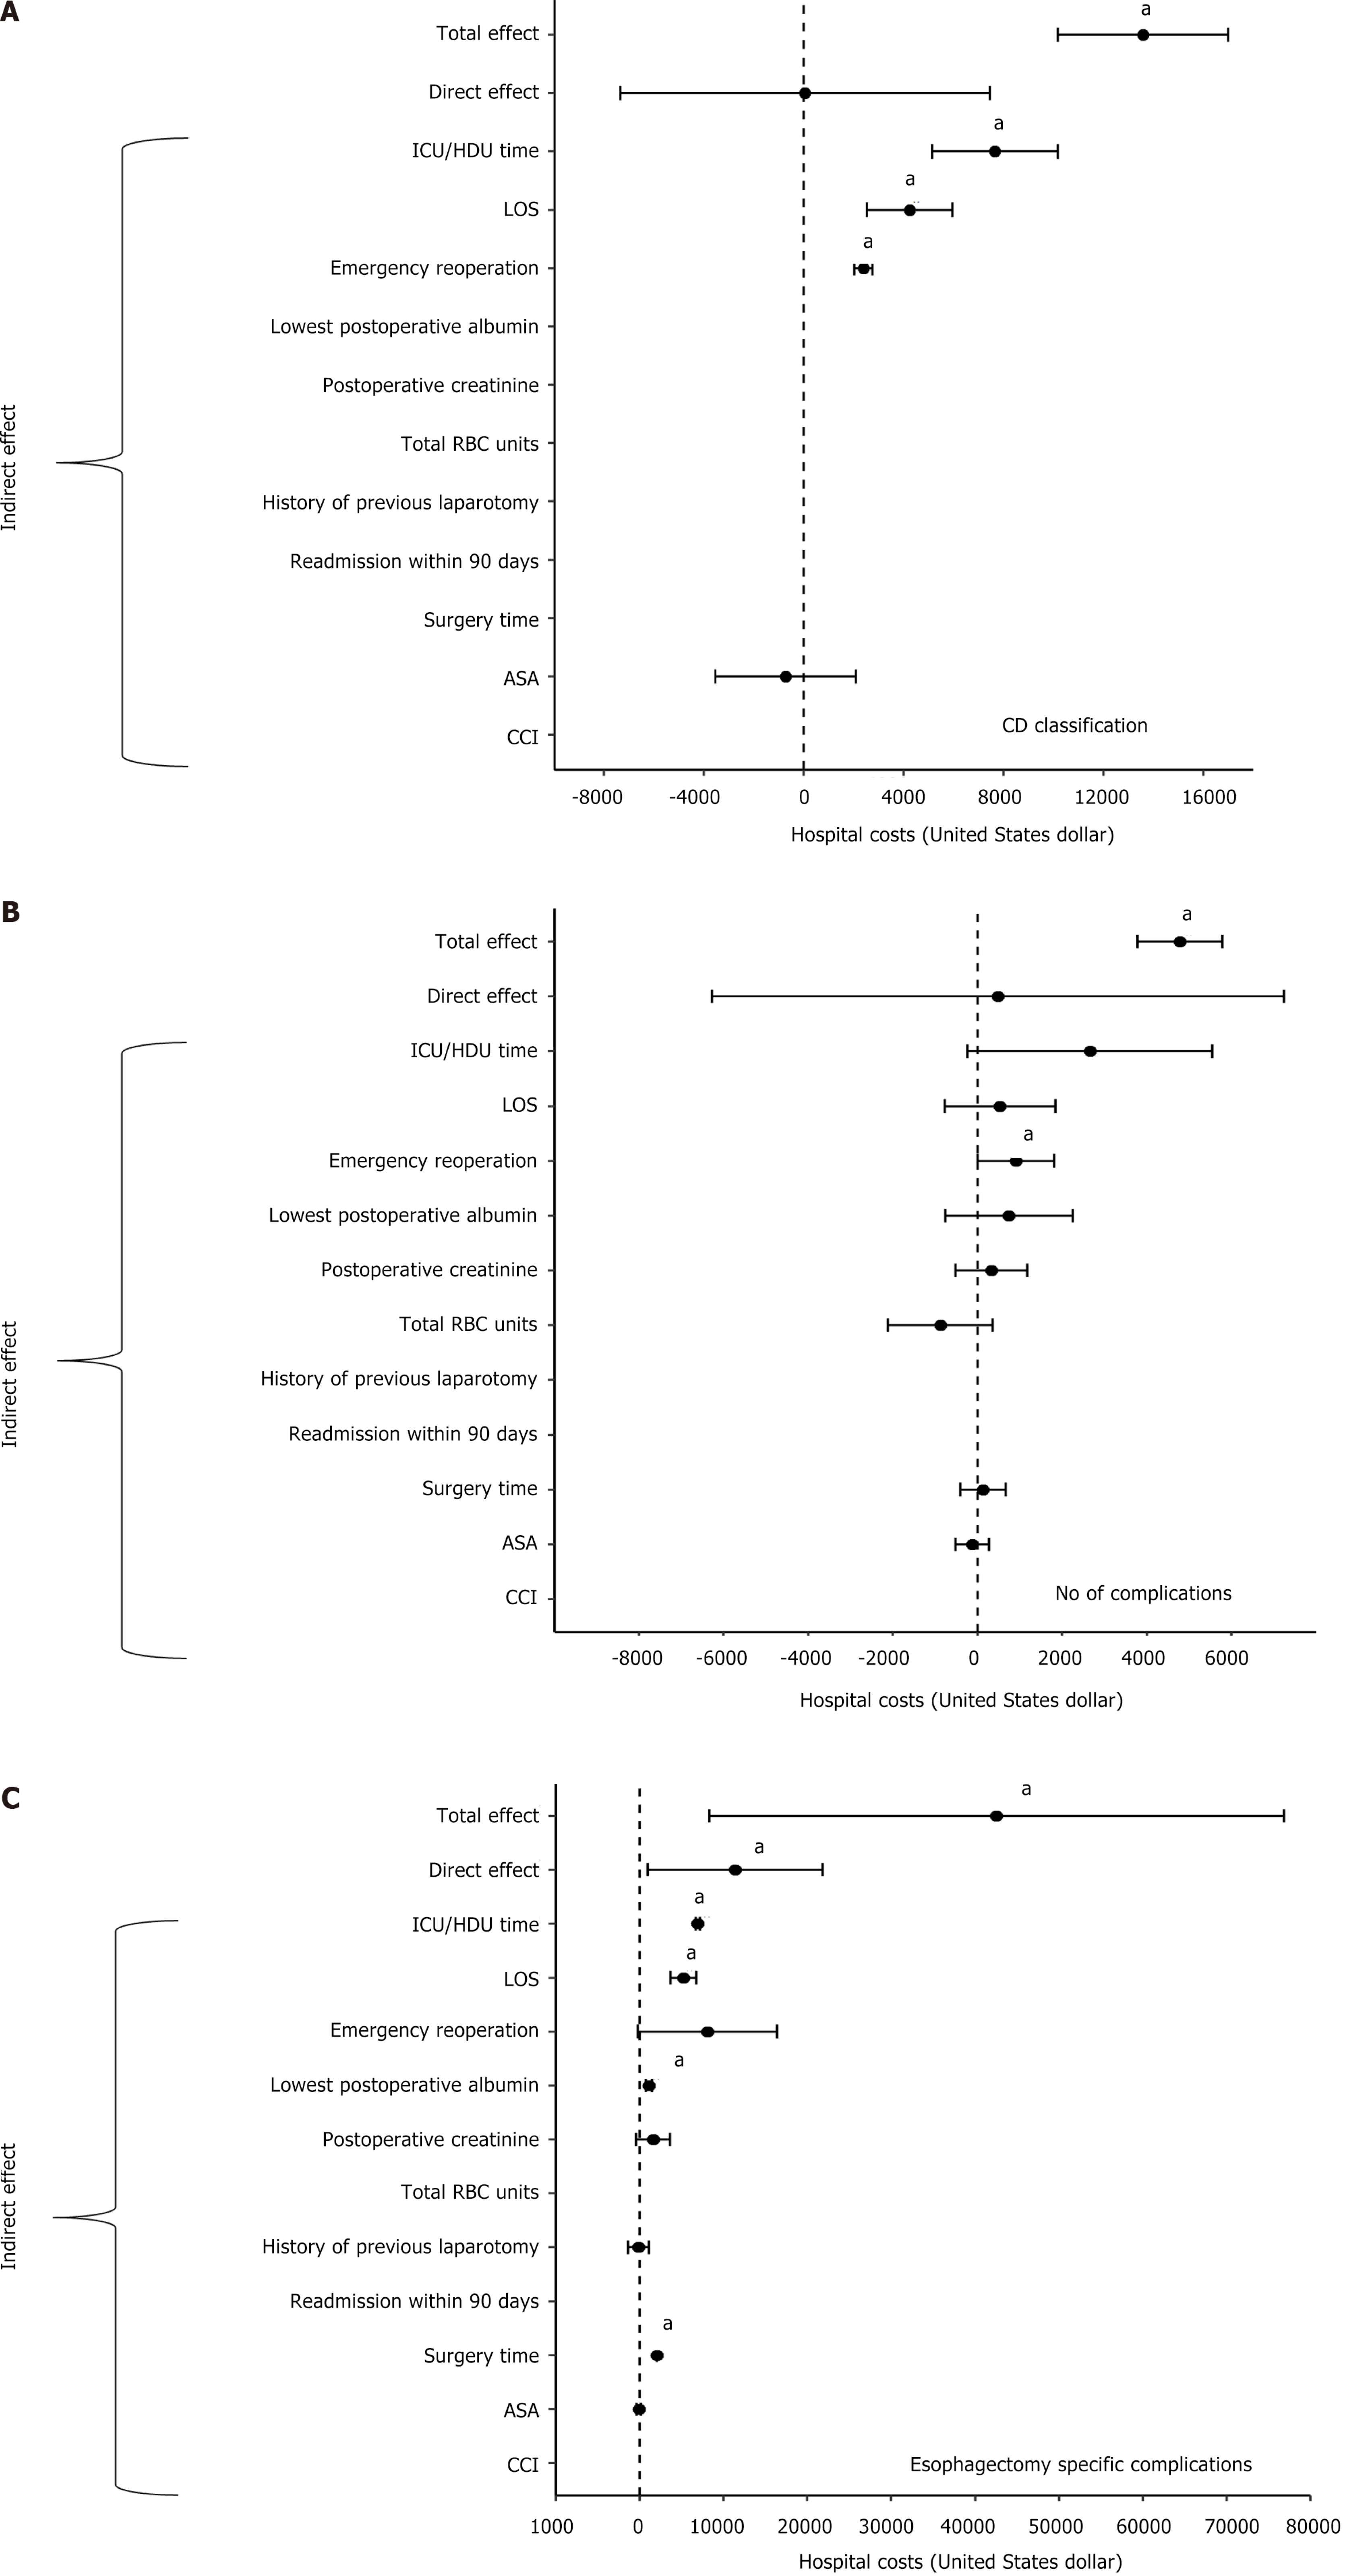
Figure 3 Mediation analyses for complications.
A: Mediation analyses for severity of complications. The indirect, mediator adjusted direct, and the total effects are presented; B: Mediation analyses for the number of complications. The indirect, mediator adjusted direct, and the total effects are presented; C: Mediation analyses for esophagectomy key complications. The indirect, mediator adjusted direct, and the total effects are presented. aP < 0.05; ICU: Intensive care unit; HDU: High dependency unit; LOS: RBC: ASA: American Society of Anesthesiology; CCI: Charlson comorbidity index; CD: Clavien-Dindo.
- Citation: Buchholz V, Lee DK, Liu DS, Aly A, Barnett SA, Hazard R, Le P, Kioussis B, Muralidharan V, Weinberg L. Cost burden following esophagectomy: A single centre observational study. World J Gastrointest Surg 2024; 16(7): 2255-2269
- URL: https://www.wjgnet.com/1948-9366/full/v16/i7/2255.htm
- DOI: https://dx.doi.org/10.4240/wjgs.v16.i7.2255


