Copyright
©The Author(s) 2024.
World J Gastrointest Surg. Jul 27, 2024; 16(7): 2232-2241
Published online Jul 27, 2024. doi: 10.4240/wjgs.v16.i7.2232
Published online Jul 27, 2024. doi: 10.4240/wjgs.v16.i7.2232
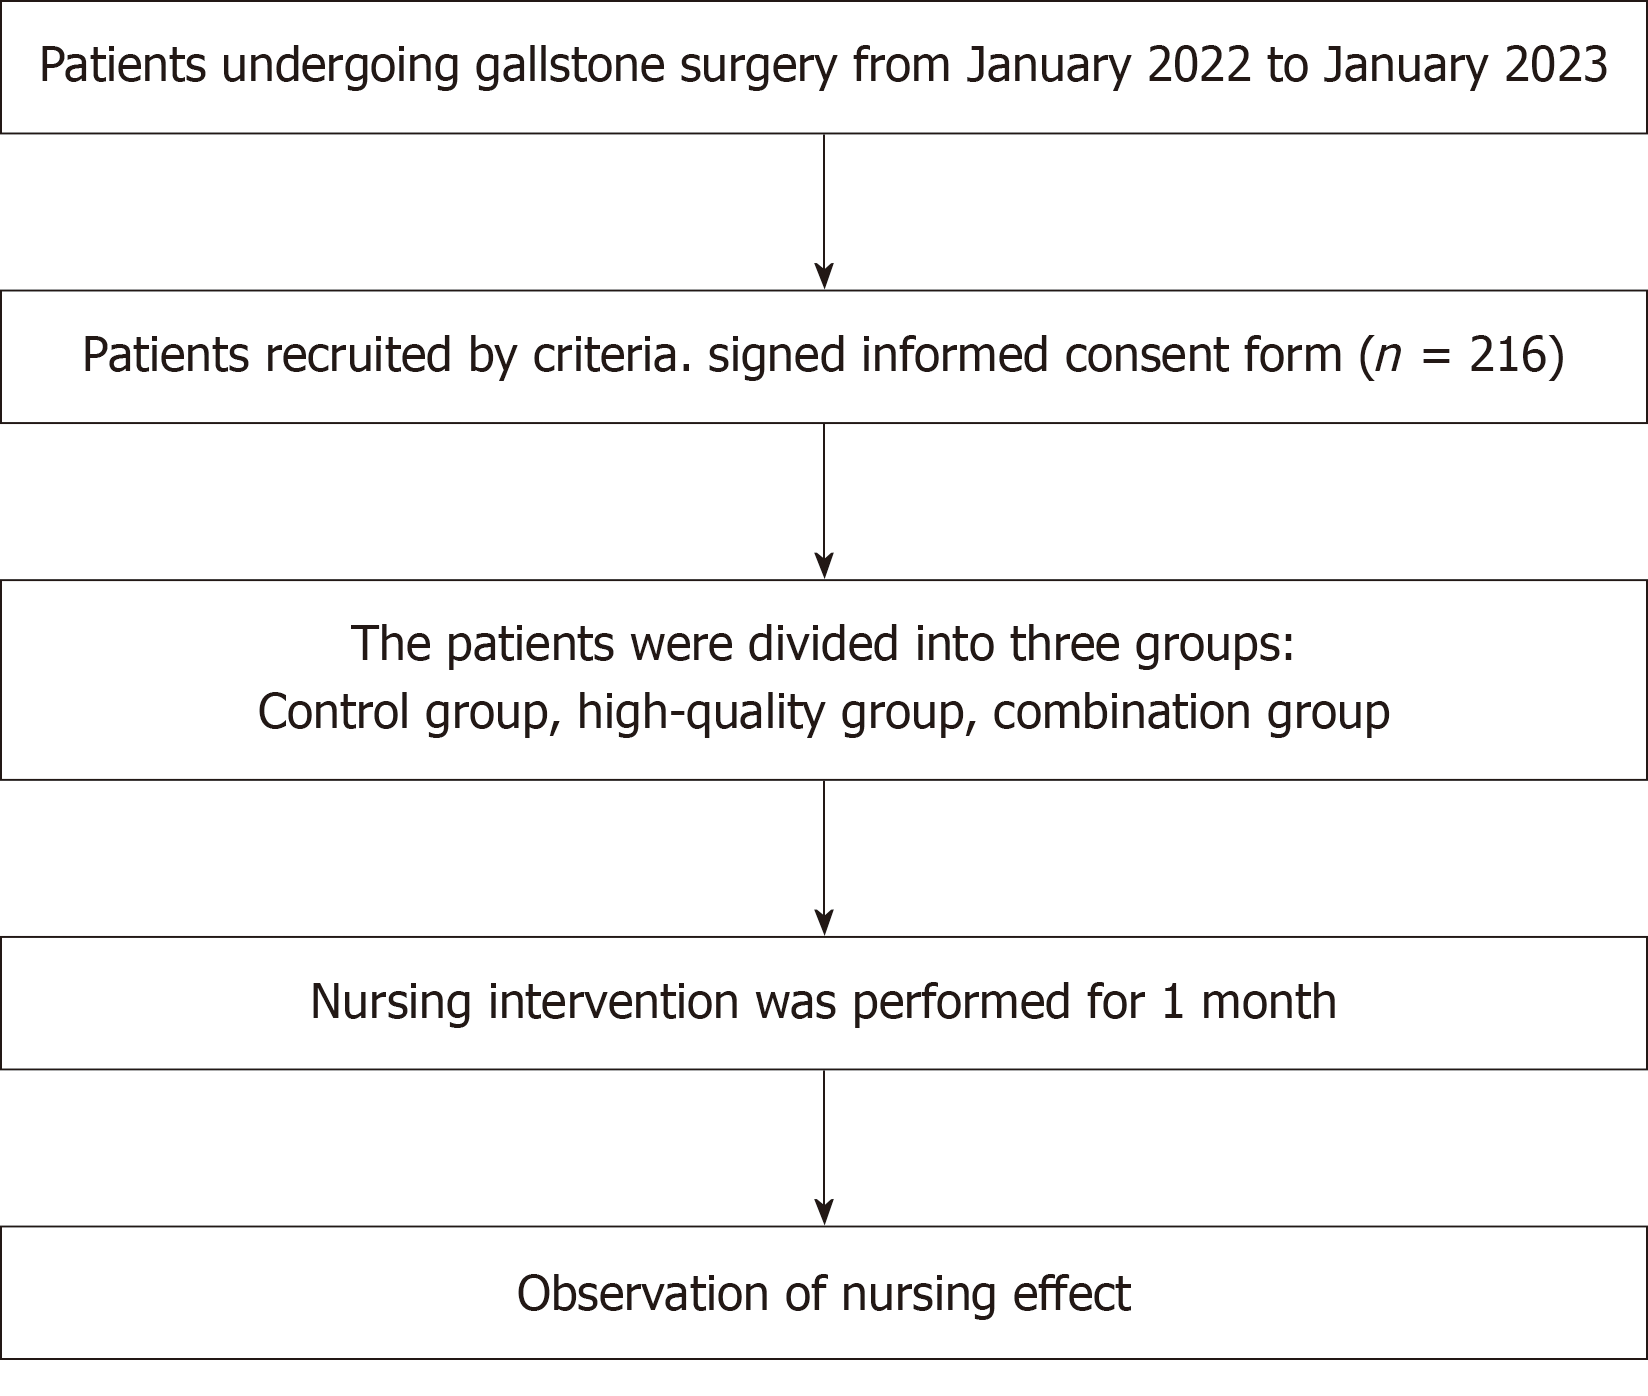
Figure 1 Flow diagram of the study.
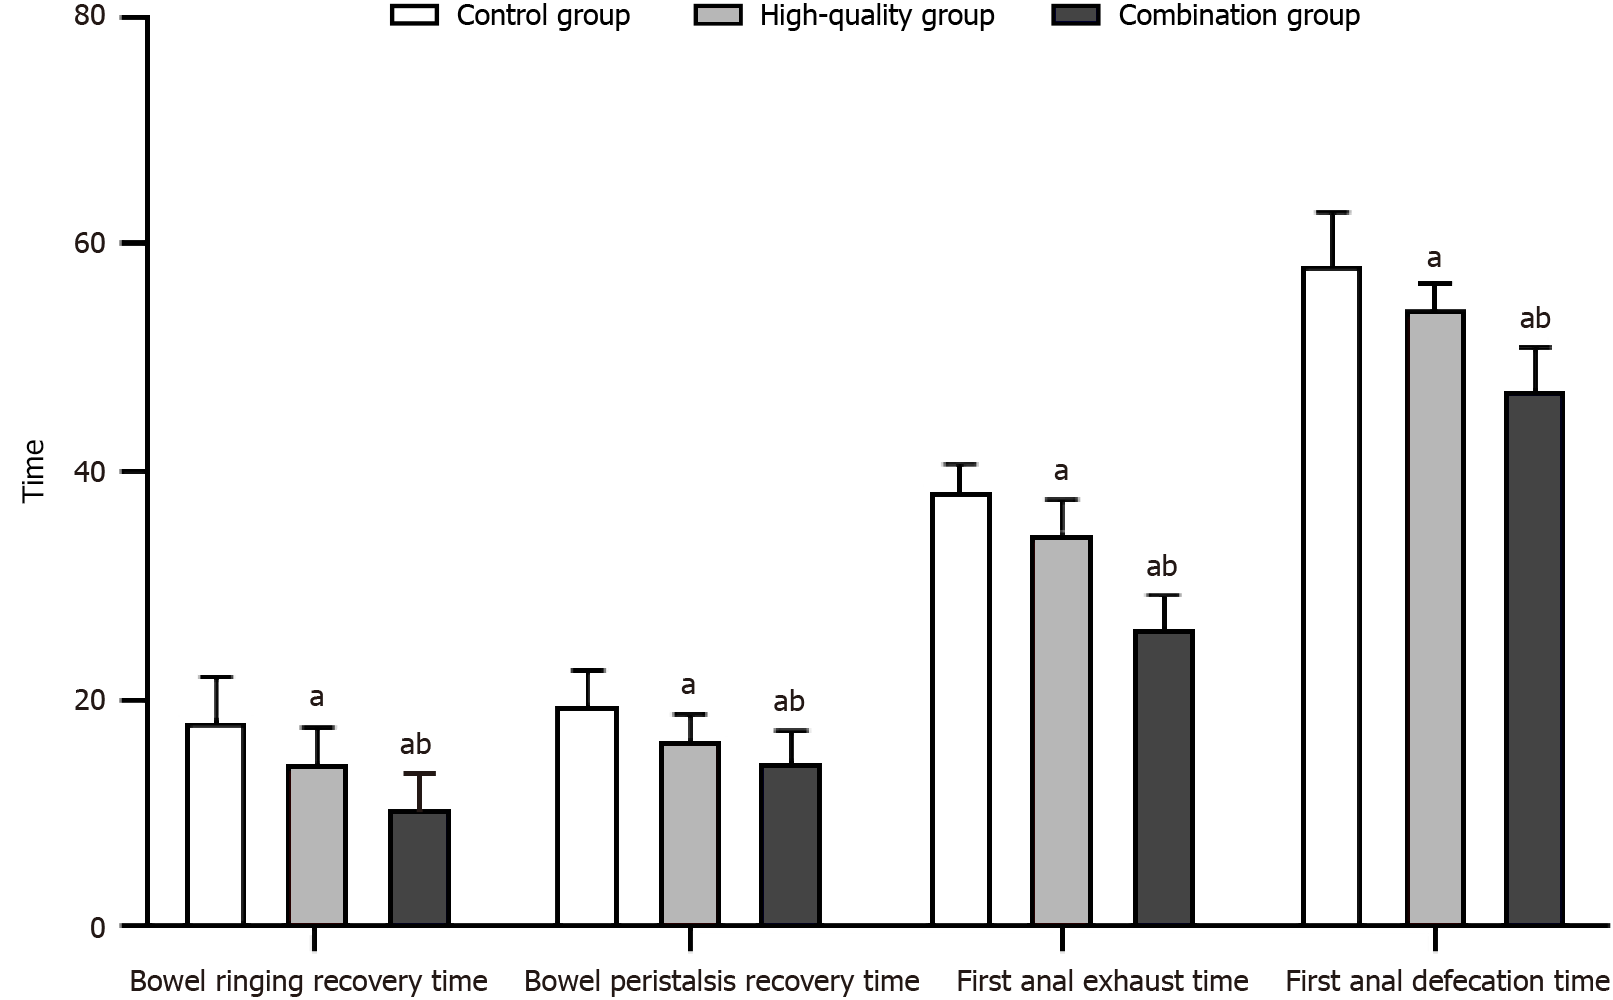
Figure 2 Comparison of time to gastrointestinal function recovery in patients (n = 72).
aP < 0.05, compared with control group; bP < 0.05, compared with high-quality nursing group.
Figure 3 Comparison of stress levels in patients (n = 72).
A: Cortisol levels; B: Norepinephrine levels. aP < 0.05, compared with control group; bP < 0.05, compared with high-quality nursing group. Cor: Cortisol; NE: Norepinephrine.
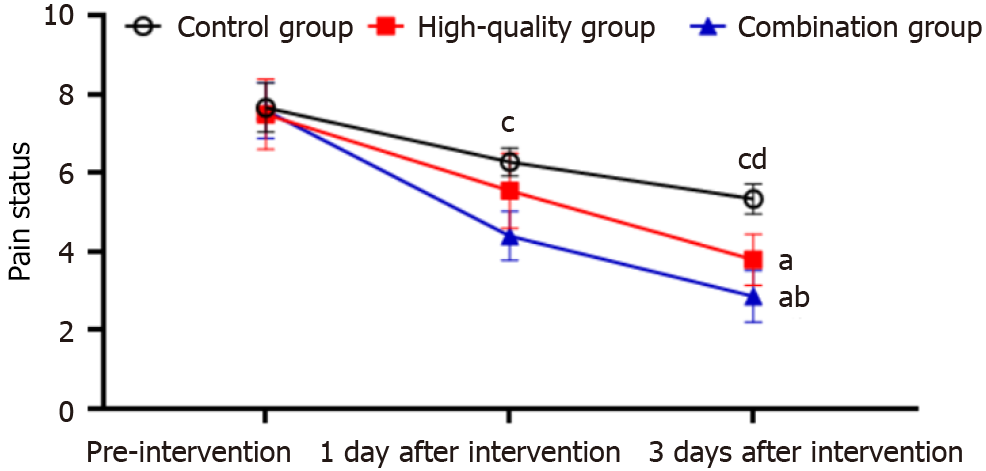
Figure 4 Comparison of patients’ pain status (n = 72).
aP < 0.05, compared with control group; bP < 0.05, compared with high-quality nursing group; cP < 0.05, compared with preintervention; dP < 0.05, compared with 1 d after intervention.
Figure 5 Comparison of patients’ emotional state (n = 72).
A: Hamilton Anxiety Scale score; B: Hamilton Depression Scale score. aP < 0.05, compared with control group; bP < 0.05, compared with high-quality nursing group; cP < 0.05, compared with preintervention. HAMA: Hamilton Anxiety Scale; HAMD: Hamilton Depression Scale.
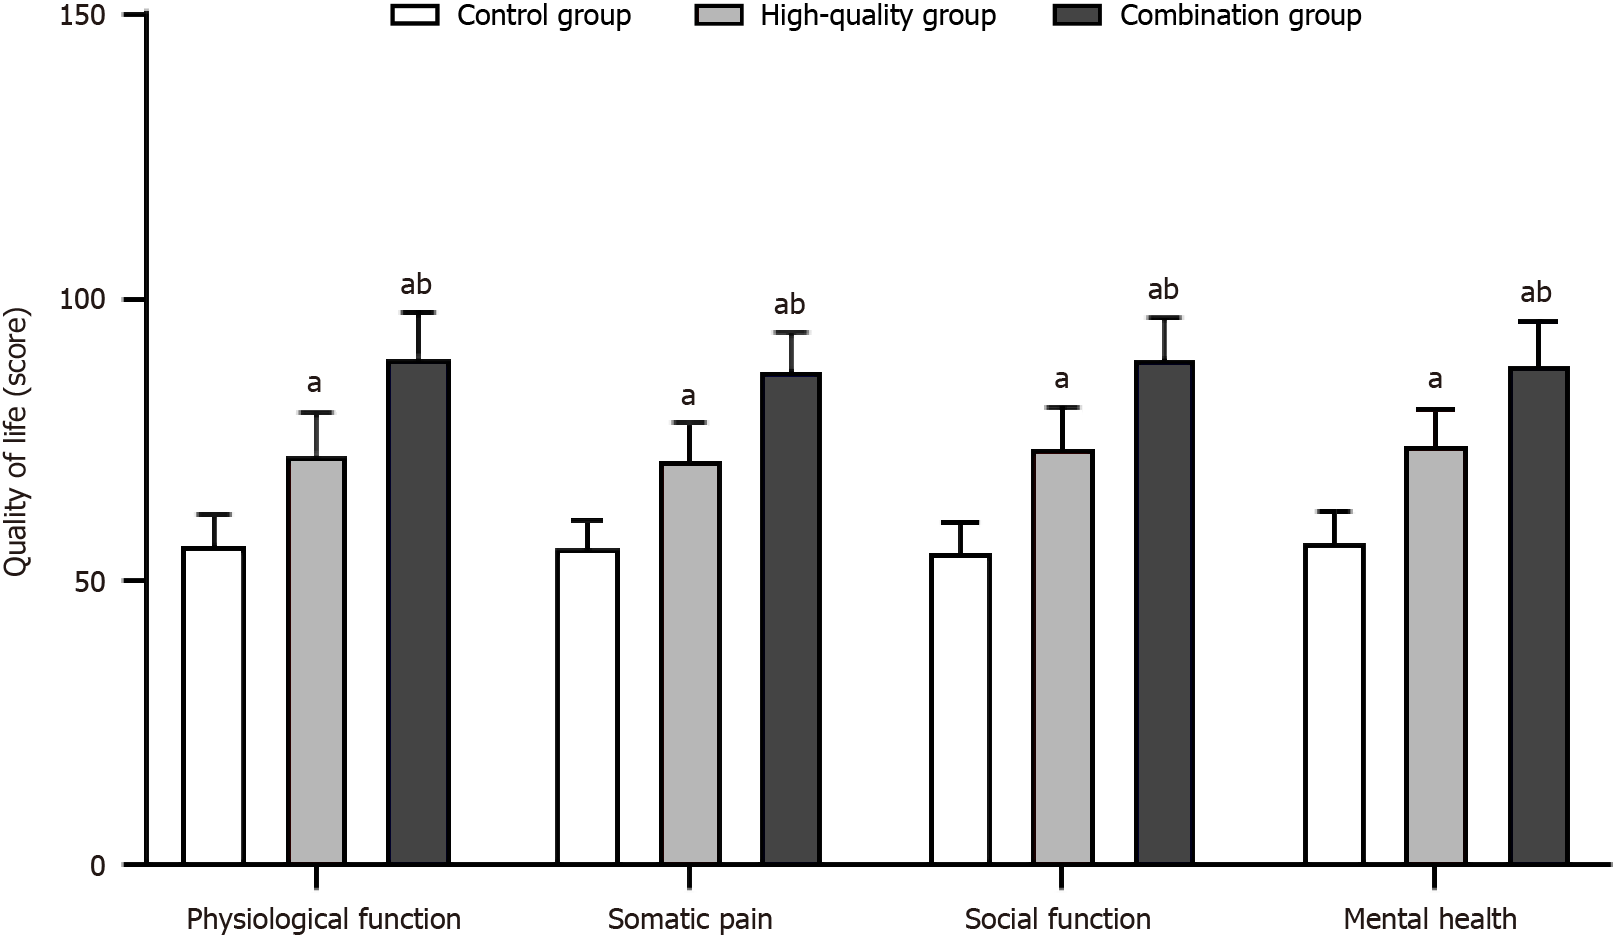
Figure 6 Comparison of patients’ quality of life (n = 72).
aP < 0.05, compared with control group; bP < 0.05, compared with high-quality nursing group.
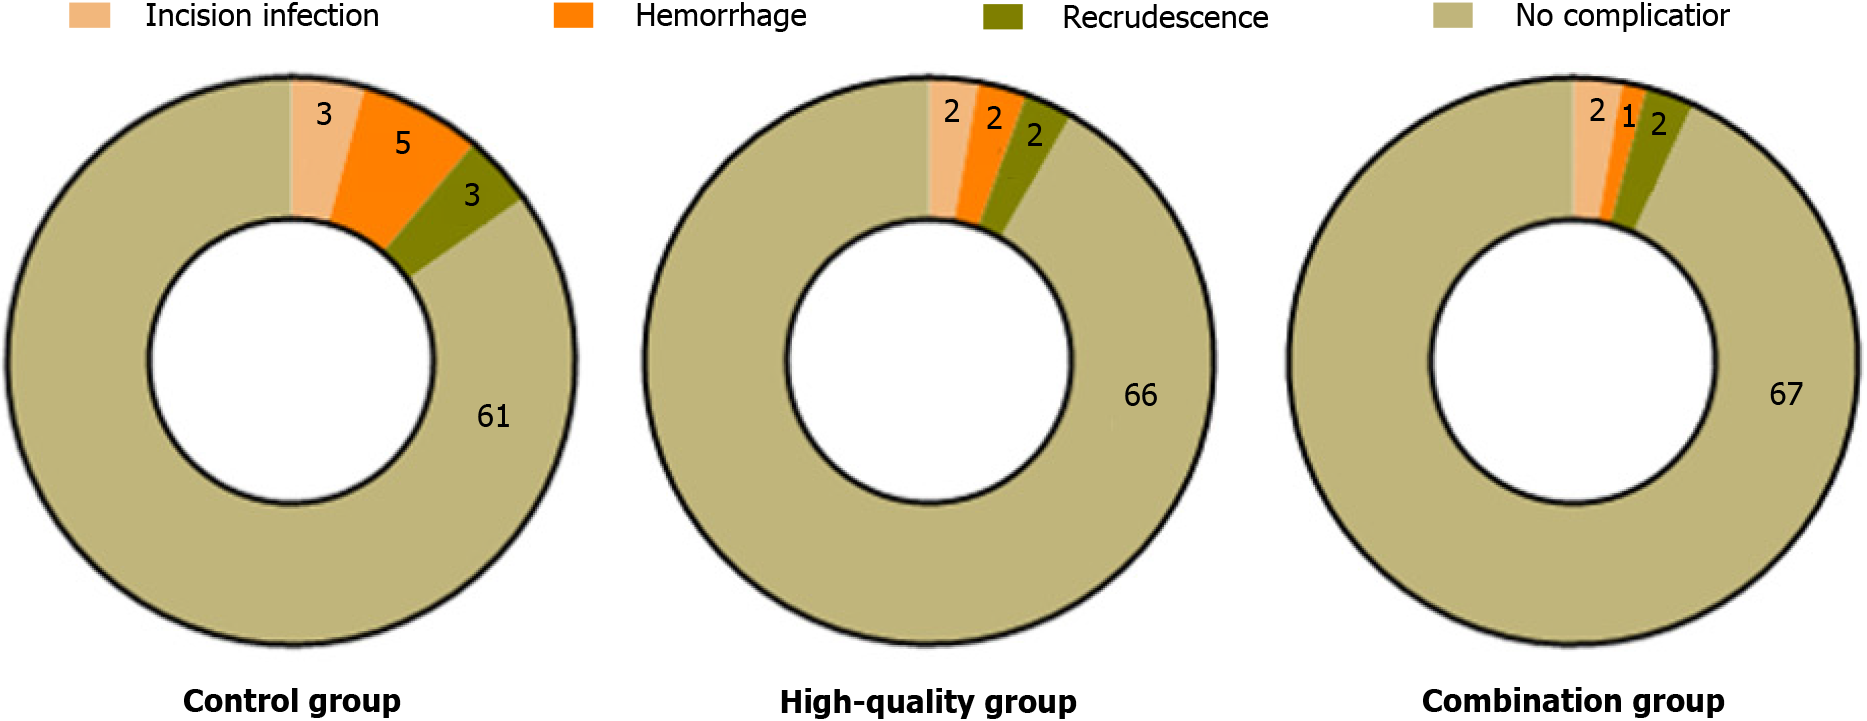
Figure 7 Comparison of complications among patients (n = 72).
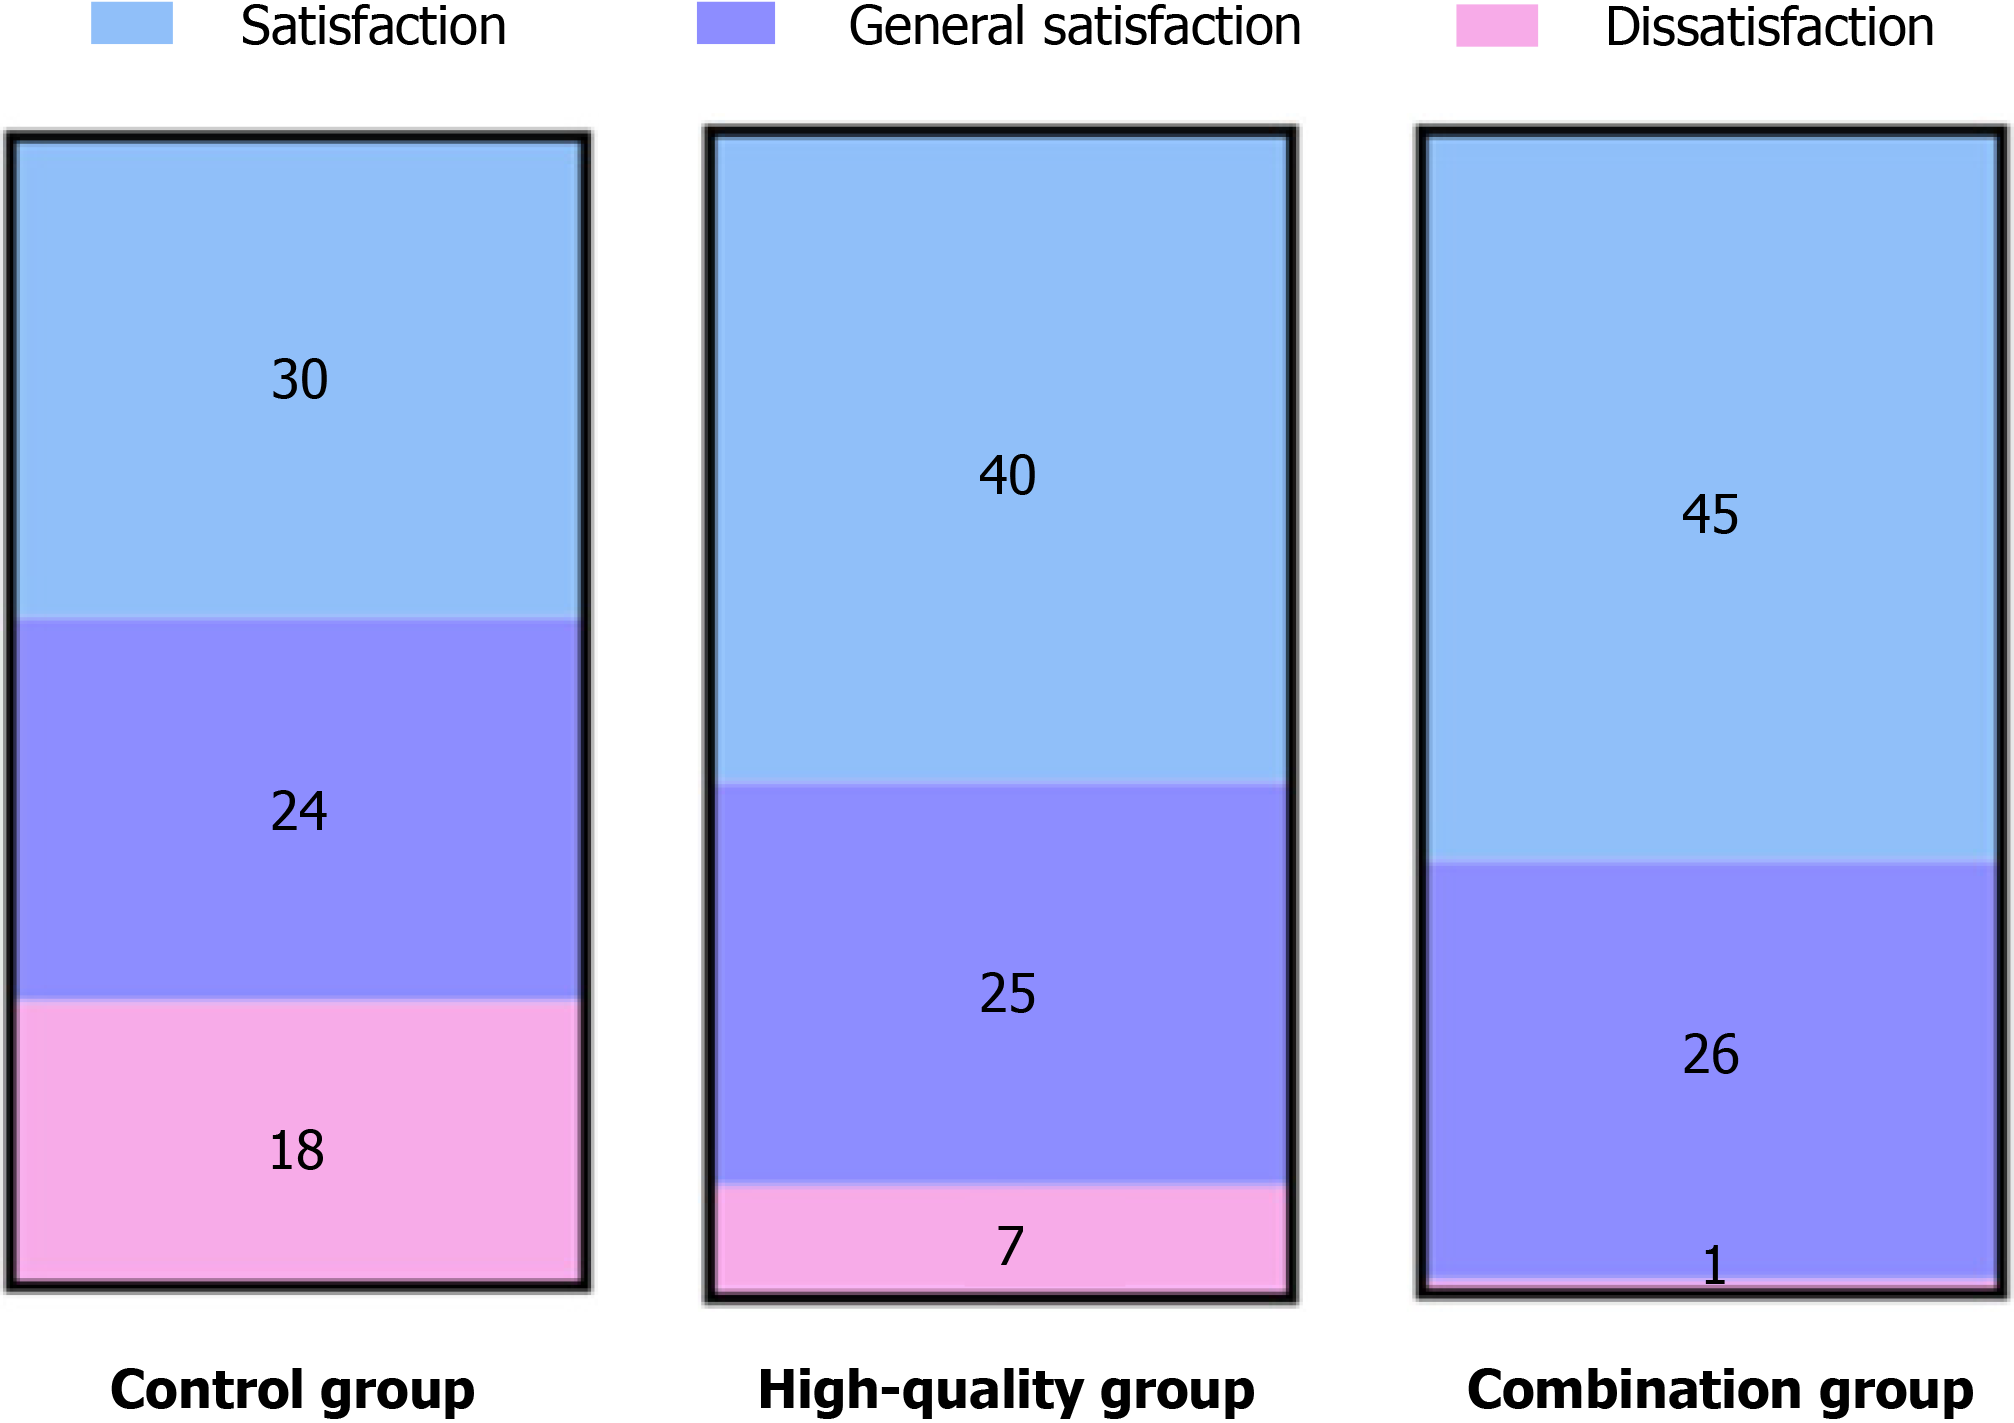
Figure 8 Comparison of patients’ nursing satisfaction (n = 72).
- Citation: Ma L, Yu Y, Zhao BJ, Yu YN, Li Y. Effect of information-motivation-behavioral skills model based perioperative nursing on pain in patients with gallstones. World J Gastrointest Surg 2024; 16(7): 2232-2241
- URL: https://www.wjgnet.com/1948-9366/full/v16/i7/2232.htm
- DOI: https://dx.doi.org/10.4240/wjgs.v16.i7.2232


