Copyright
©The Author(s) 2024.
World J Gastrointest Surg. Jun 27, 2024; 16(6): 1894-1909
Published online Jun 27, 2024. doi: 10.4240/wjgs.v16.i6.1894
Published online Jun 27, 2024. doi: 10.4240/wjgs.v16.i6.1894
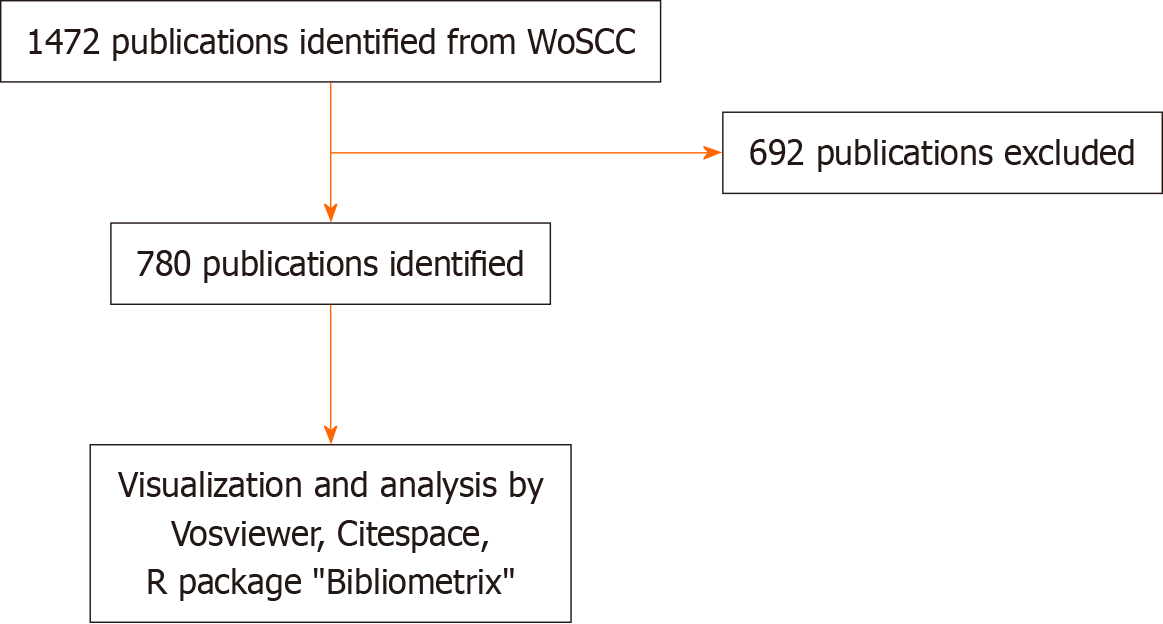
Figure 1 Publications screening flowchart.
A total of 1472 publications were included according to the filtering strategy and inclusion criteria. Then, 692 publications were excluded according to exclusion criteria of letters, editorial materials, corrections, books, data sets, proceedings papers, retractions, and retracted publications. In total, 780 publications were retrieved. WoSCC: Web of Science Core Collection.
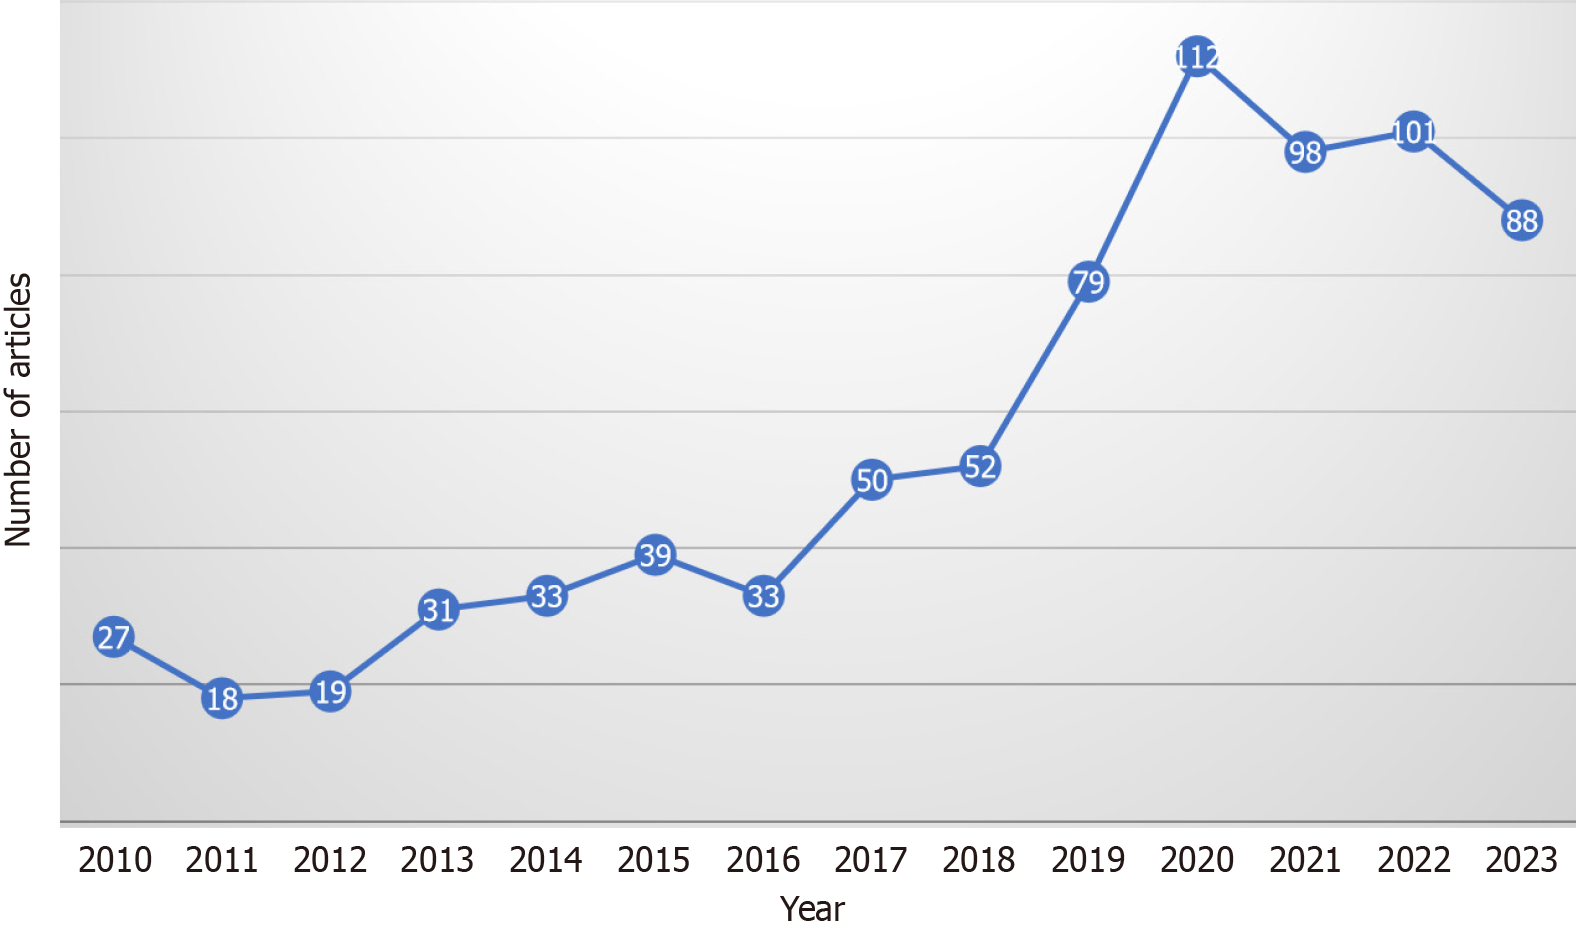
Figure 2 Annual output of appendiceal tumor research.
Each point represents the number of papers published in the respective year.
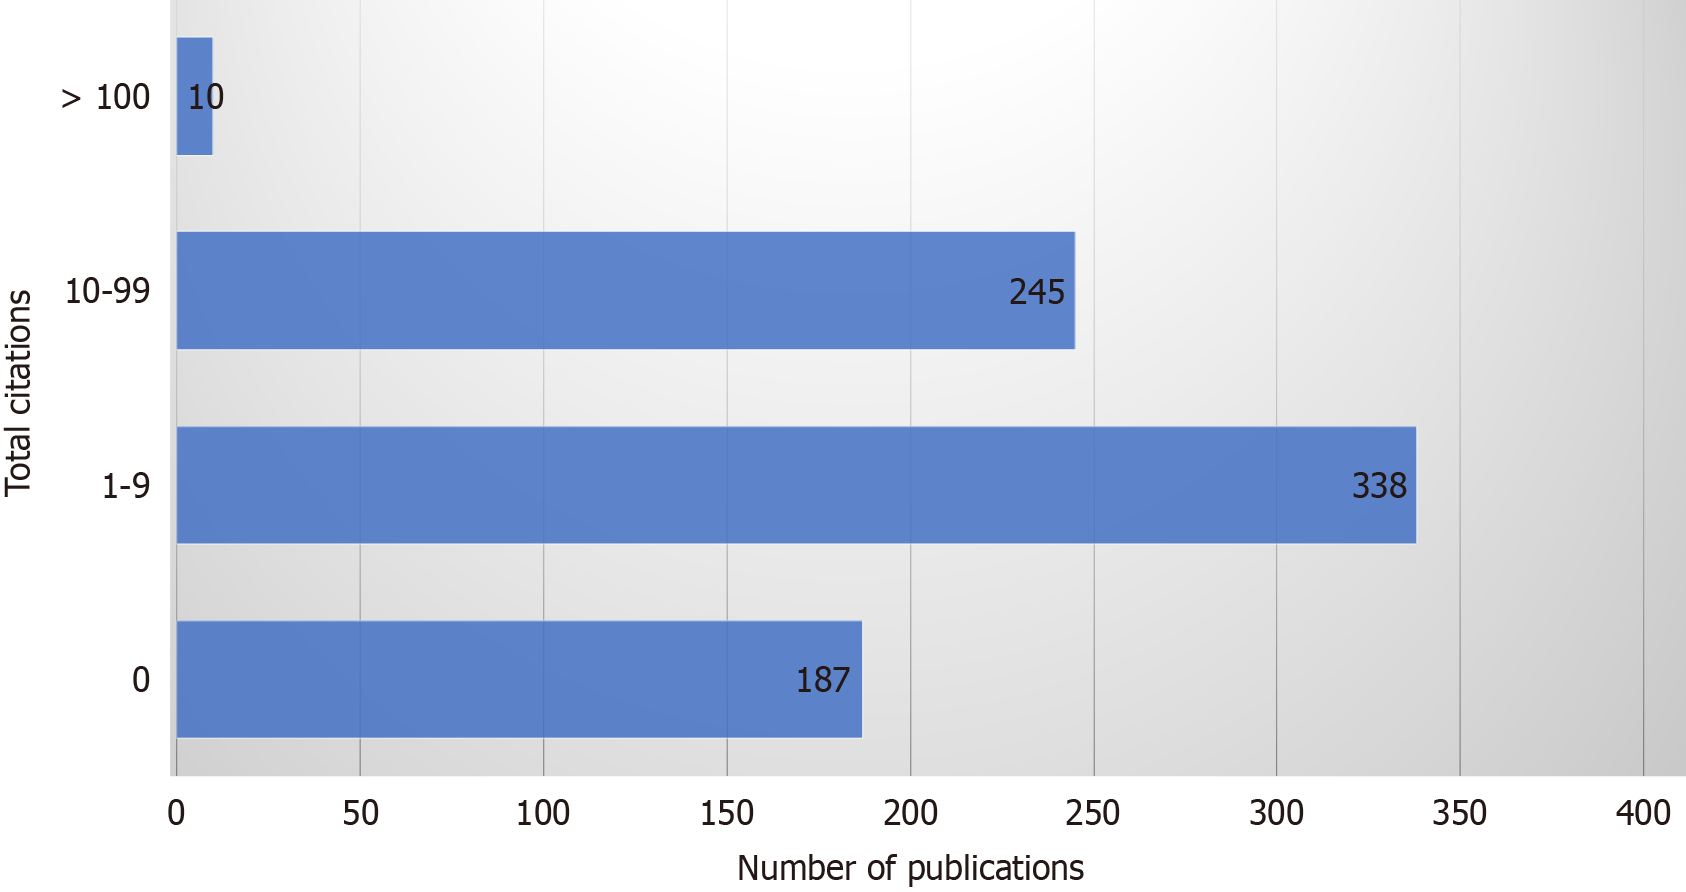
Figure 3 Number of publications by different total citations.
The bars of different length correspond to the number of papers in different total citation ranges.
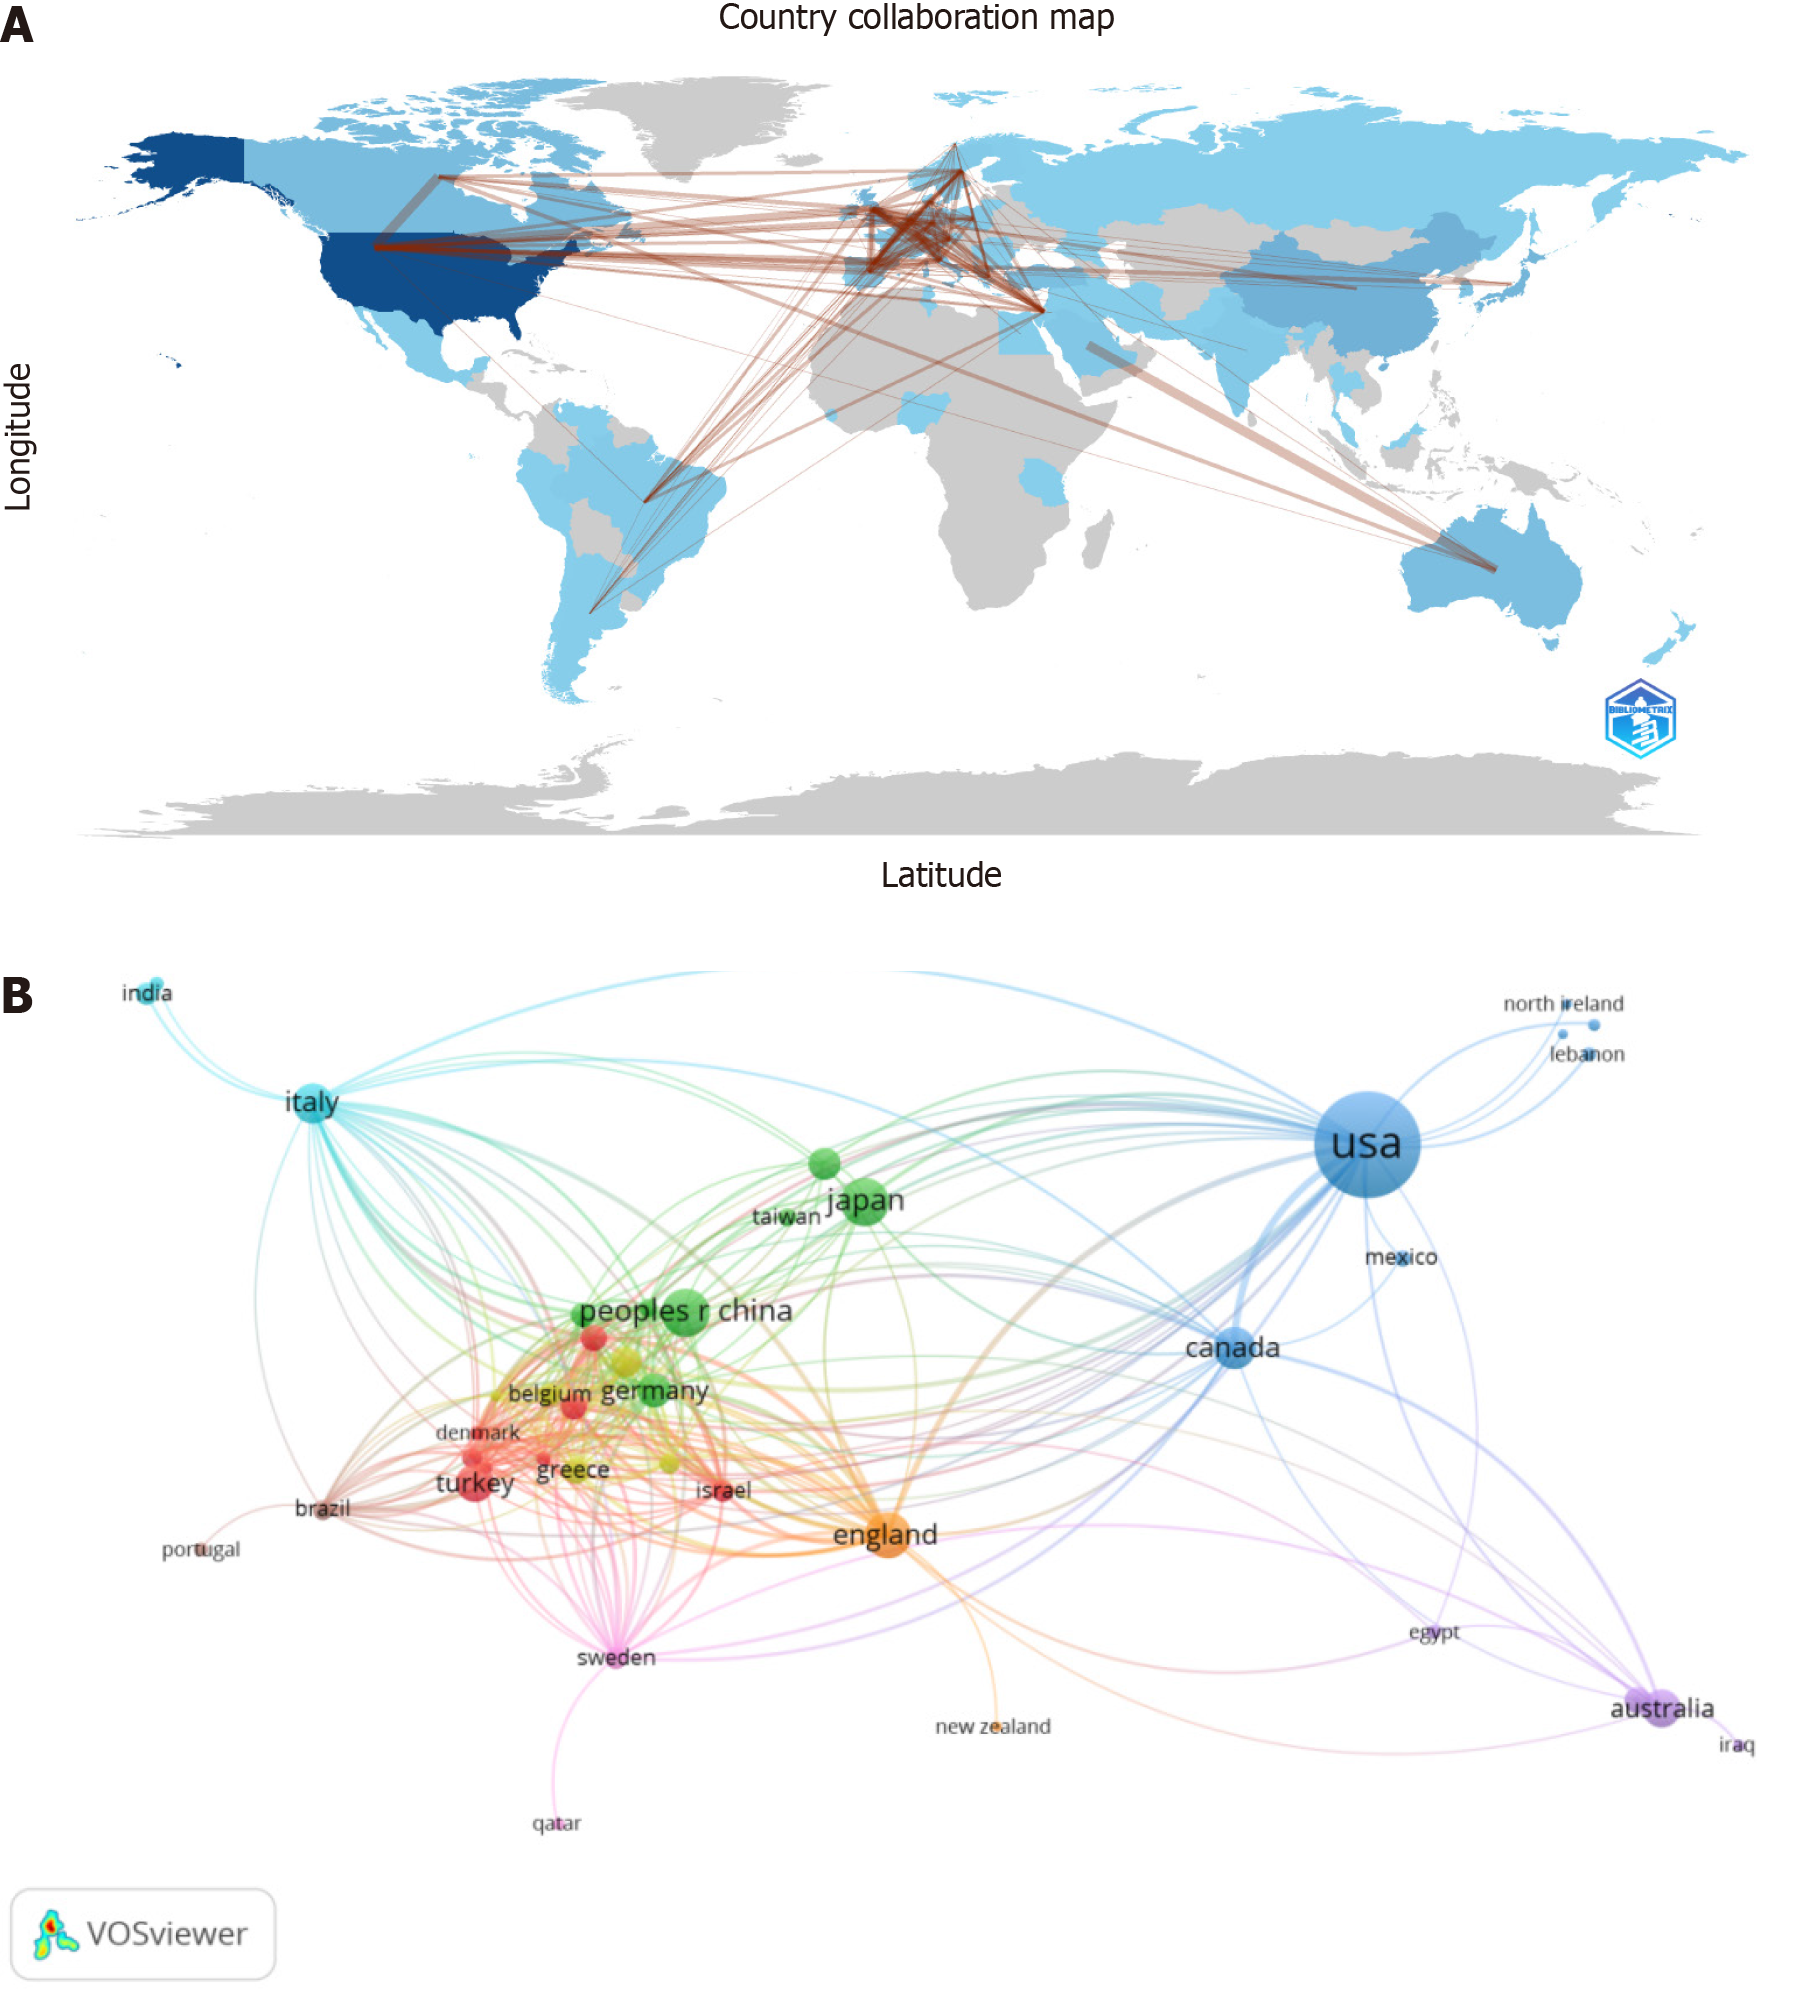
Figure 4 Geographical distribution and visualization of countries/regions.
A: Intensity of the blue color represents publication count and thickness of the line represents cooperation intensity; B: Node size represents publication count, and link size indicates cooperation intensity.
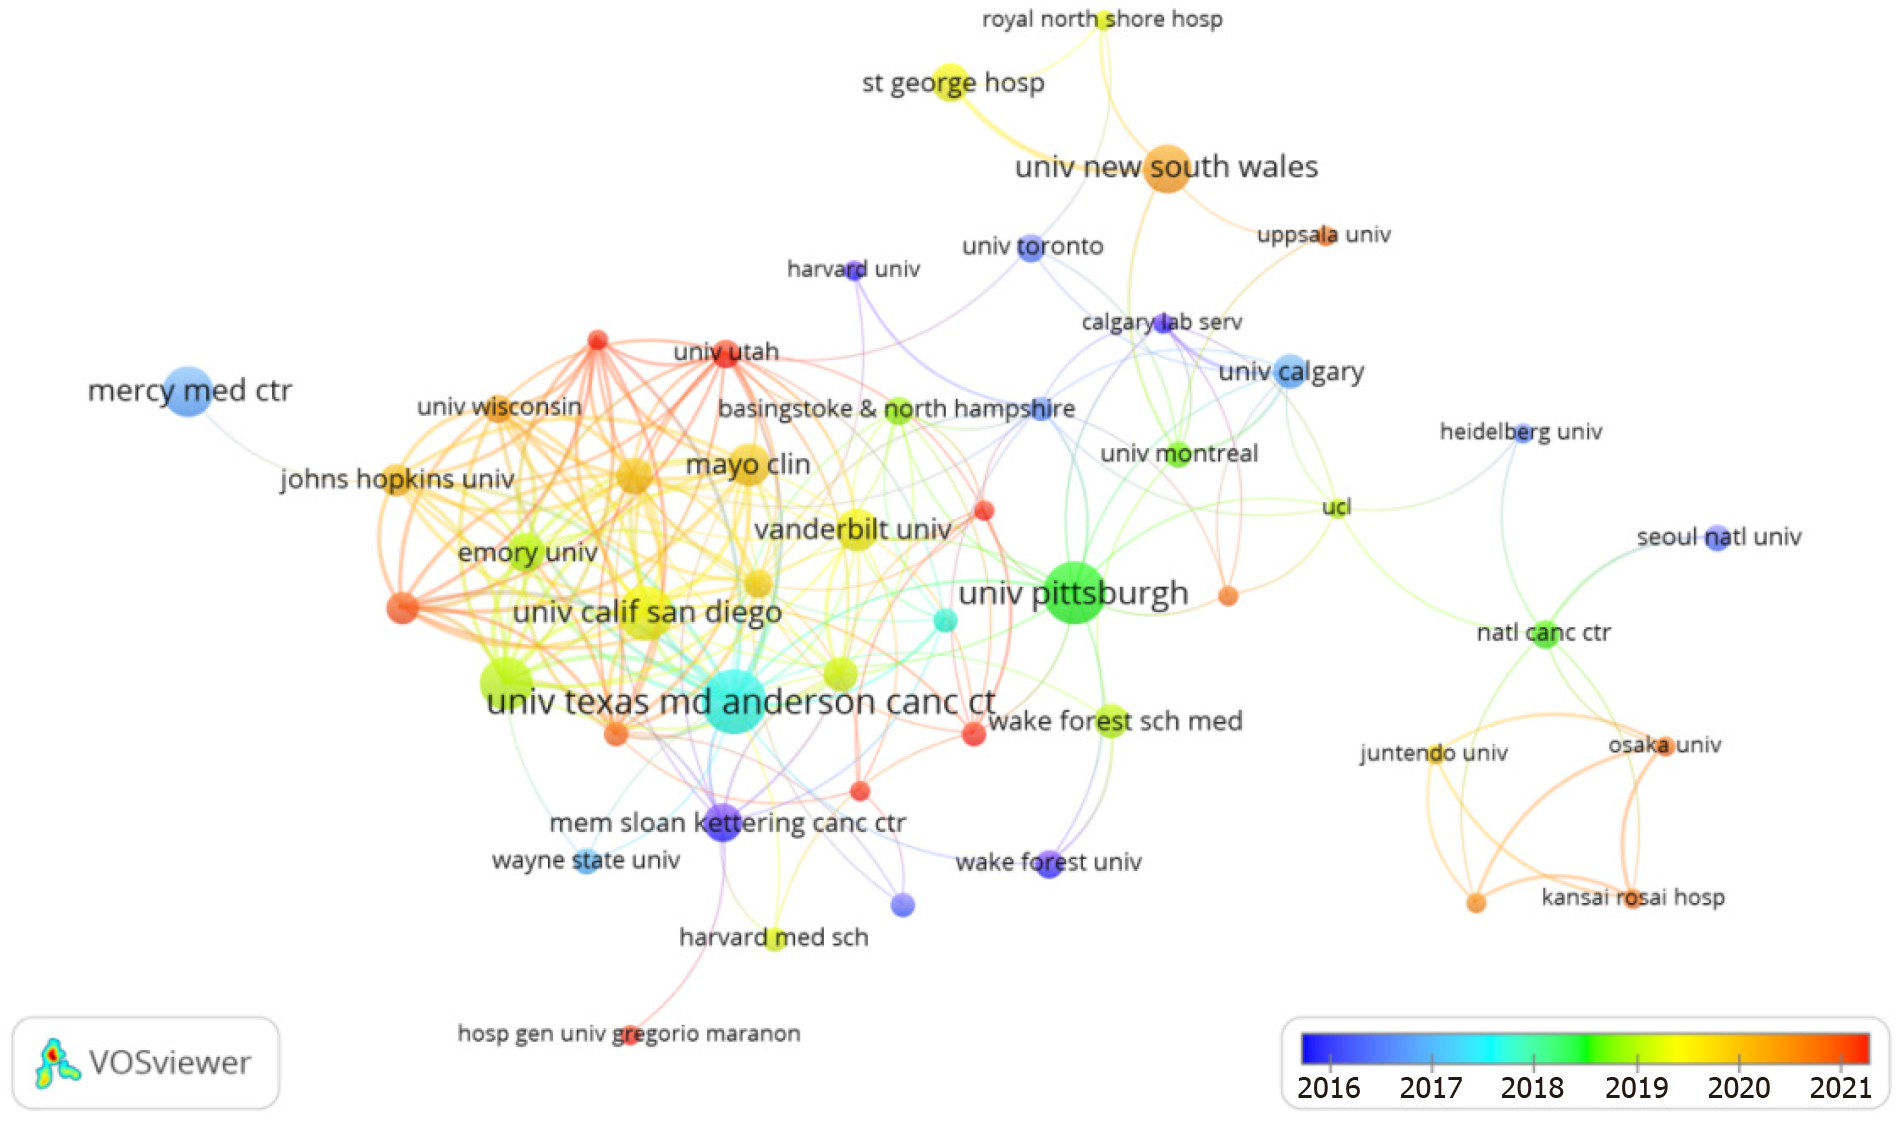
Figure 5 Collaboration network of institutions.
Node size represents publication count, and link size indicates cooperation intensity. The time of contributions is presented by the brightness of the color.
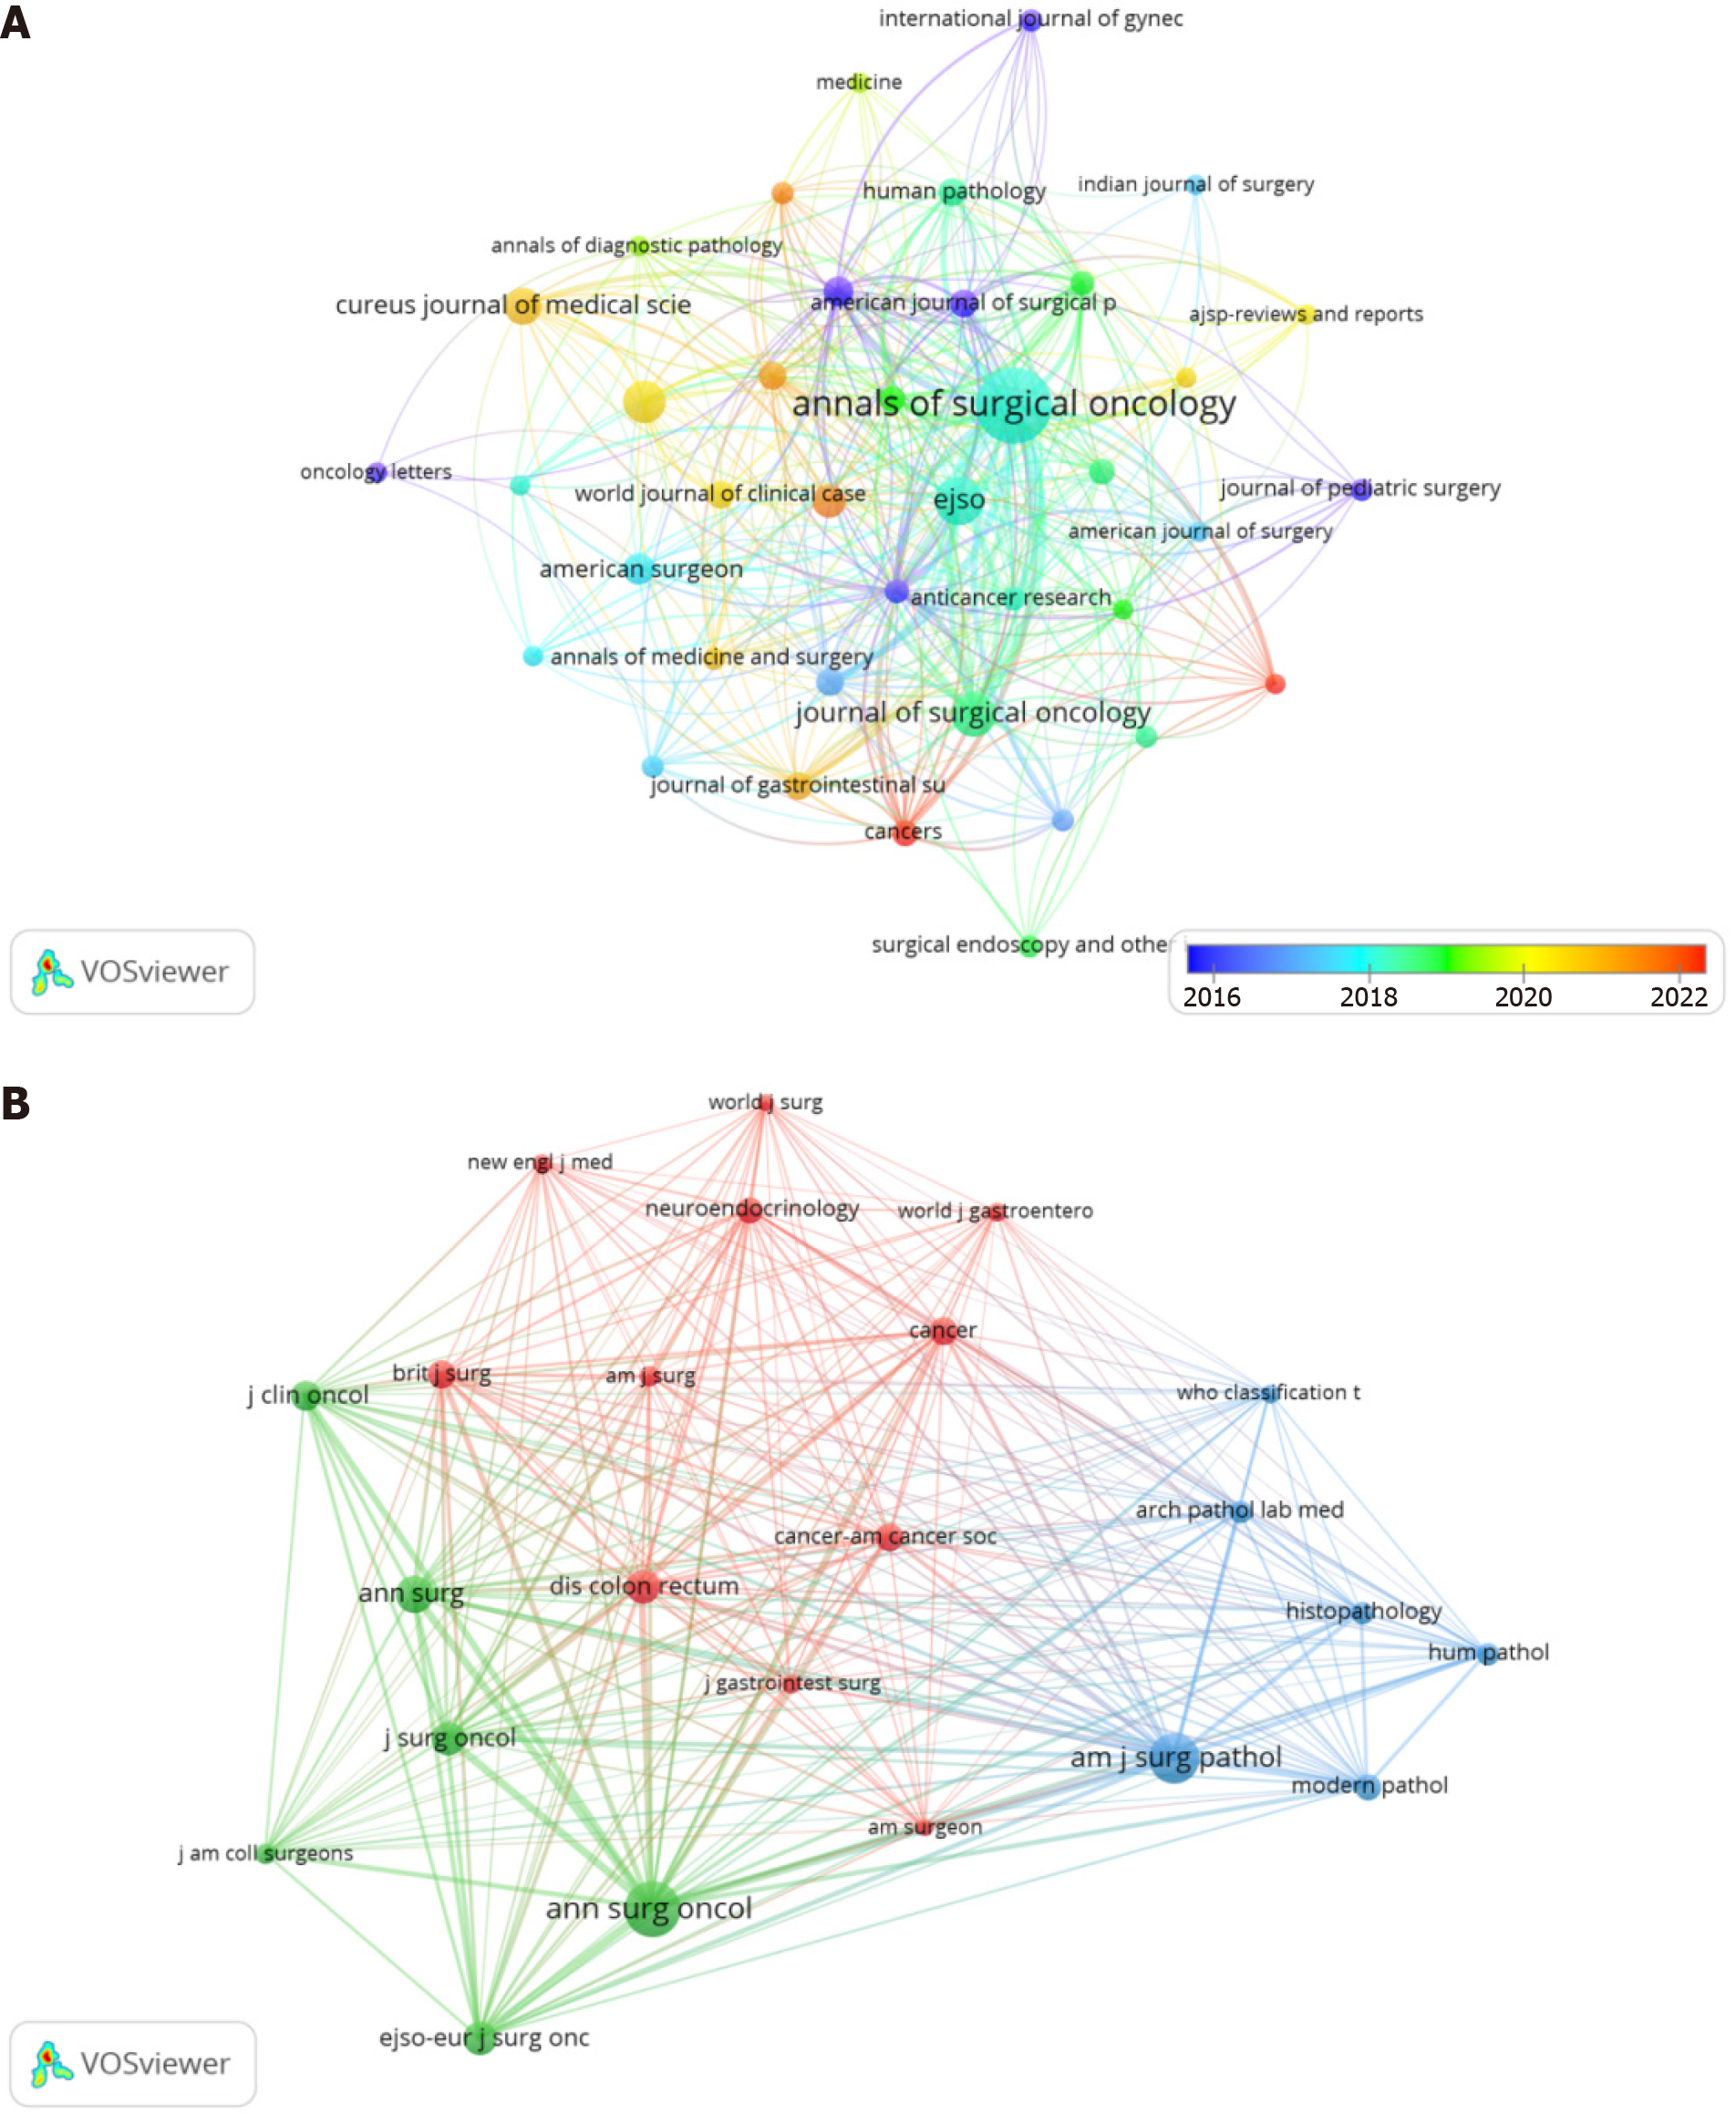
Figure 6 Network of journals and co-cited journals.
A: Network of journals; B: Network of co-cited journals. Node size represents frequency of journal, and link size indicates cooperation intensity.
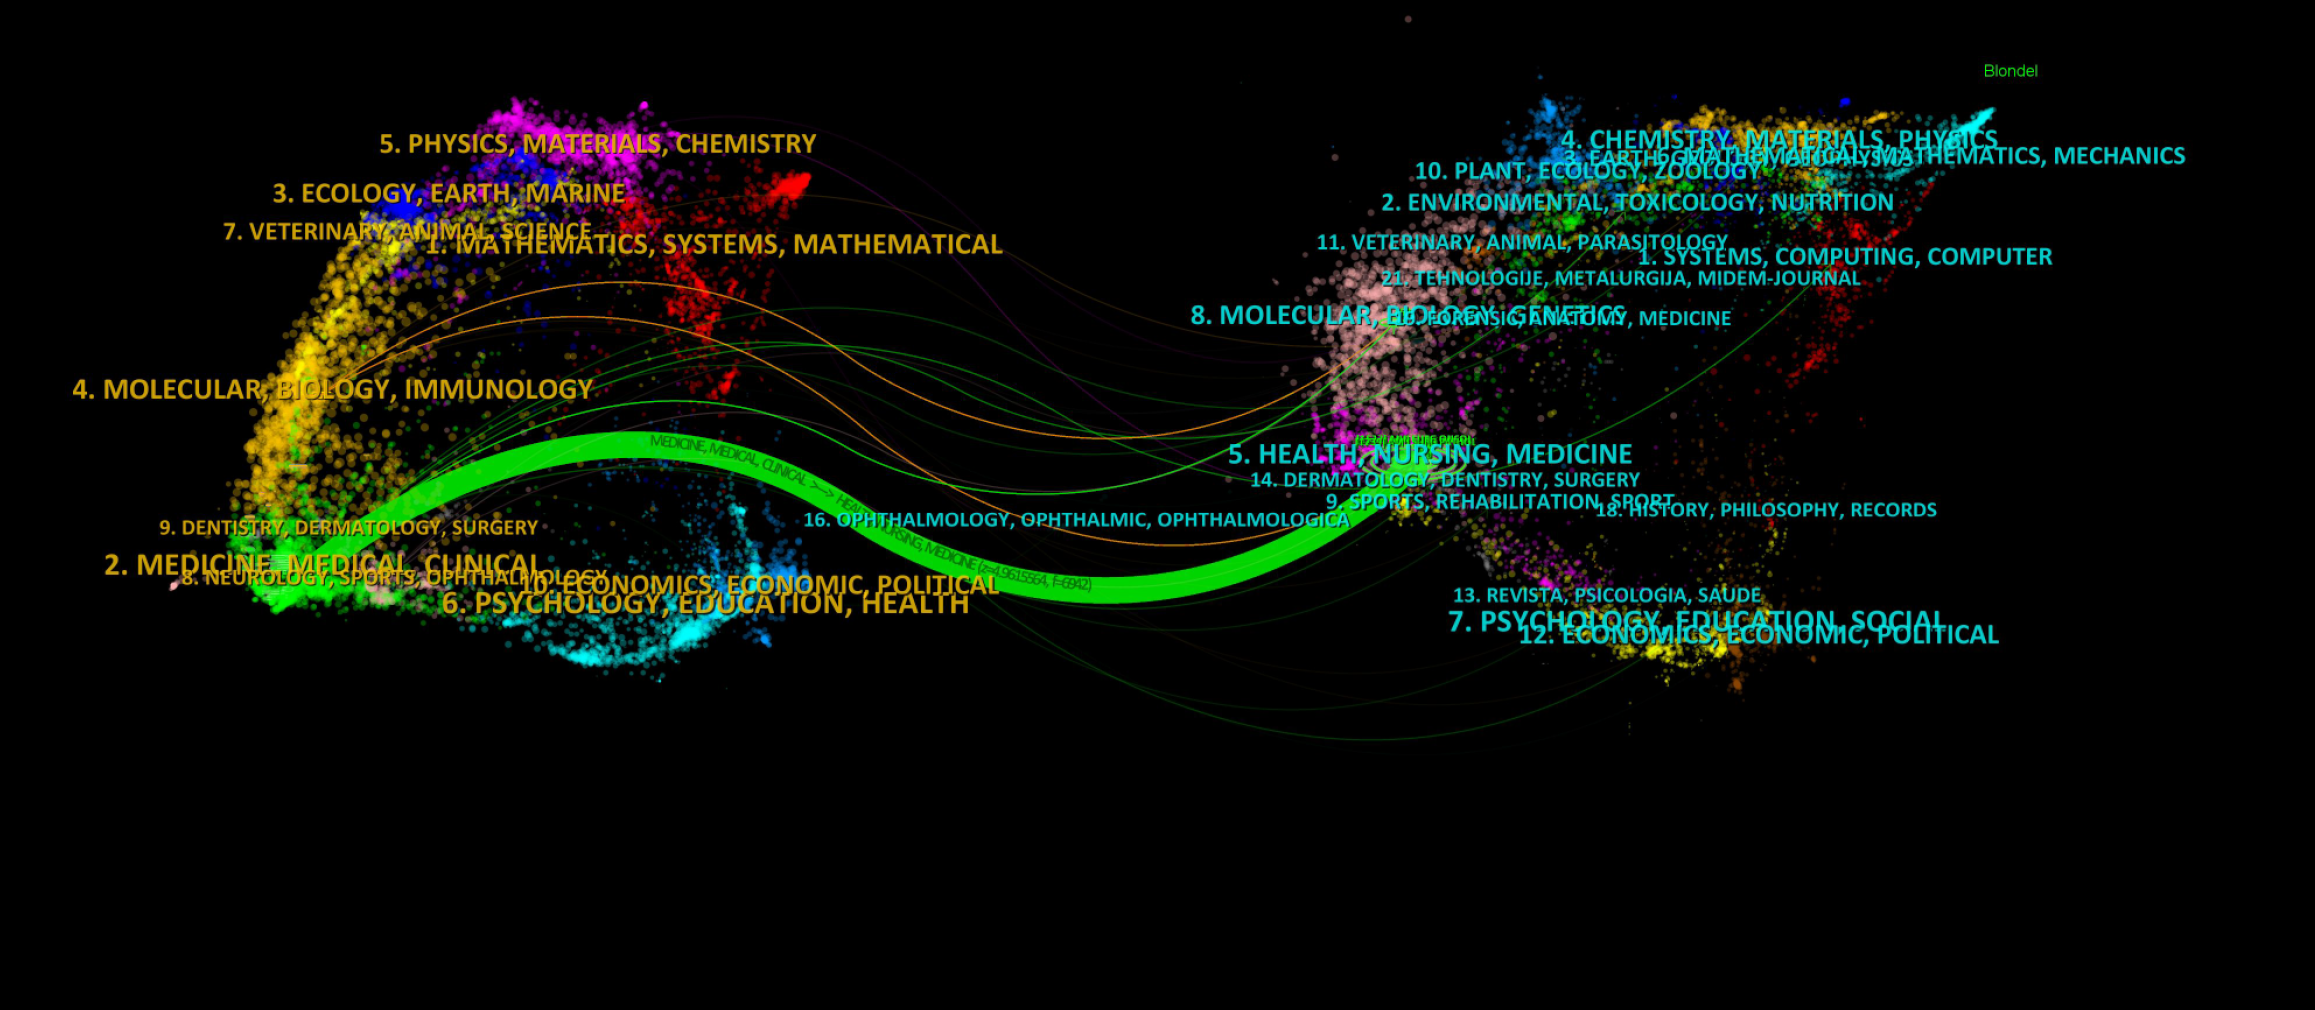
Figure 7 Dual-map overlay of journals.
Clusters of citing journals on the left and clusters of cited journals on the right. The lines show relationships between the citing and cited journals. The thickest green curve represents the main citation path.
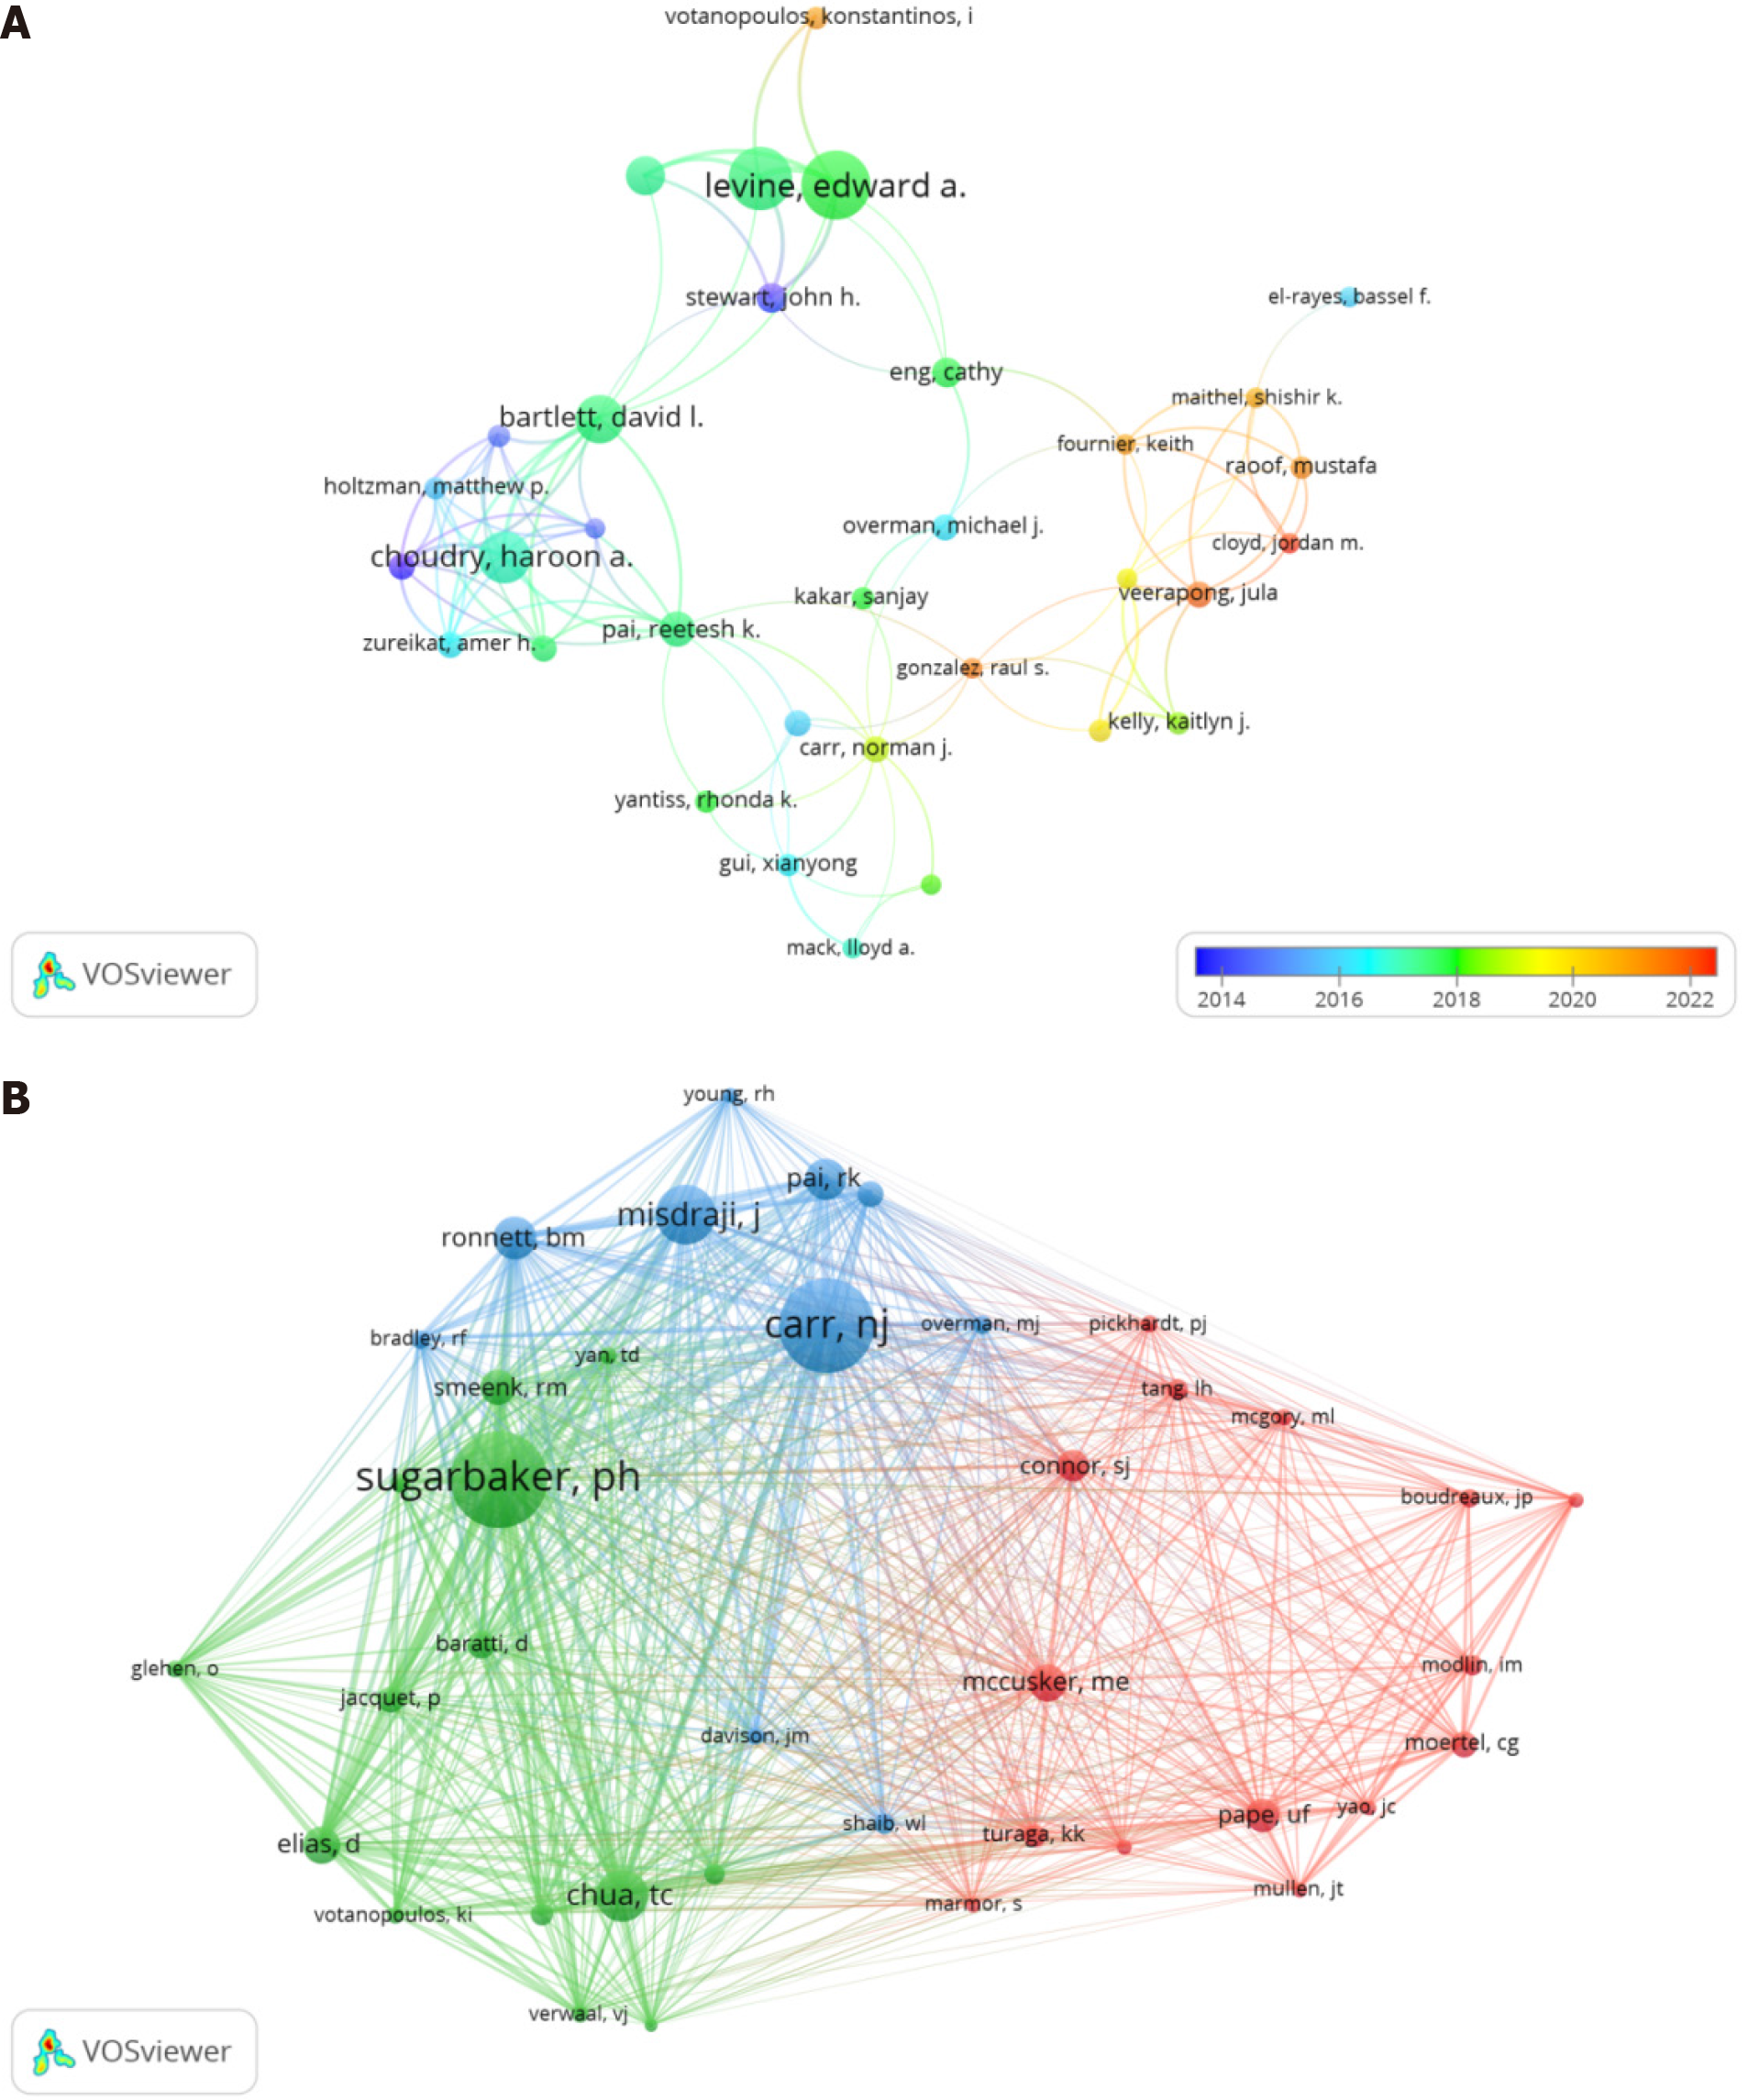
Figure 8 Collaboration network of authors and co-cited authors.
A: Collaboration network of authors; B: Collaboration network of co-cited authors. Node size represents frequency of author, and link size indicates cooperation intensity.
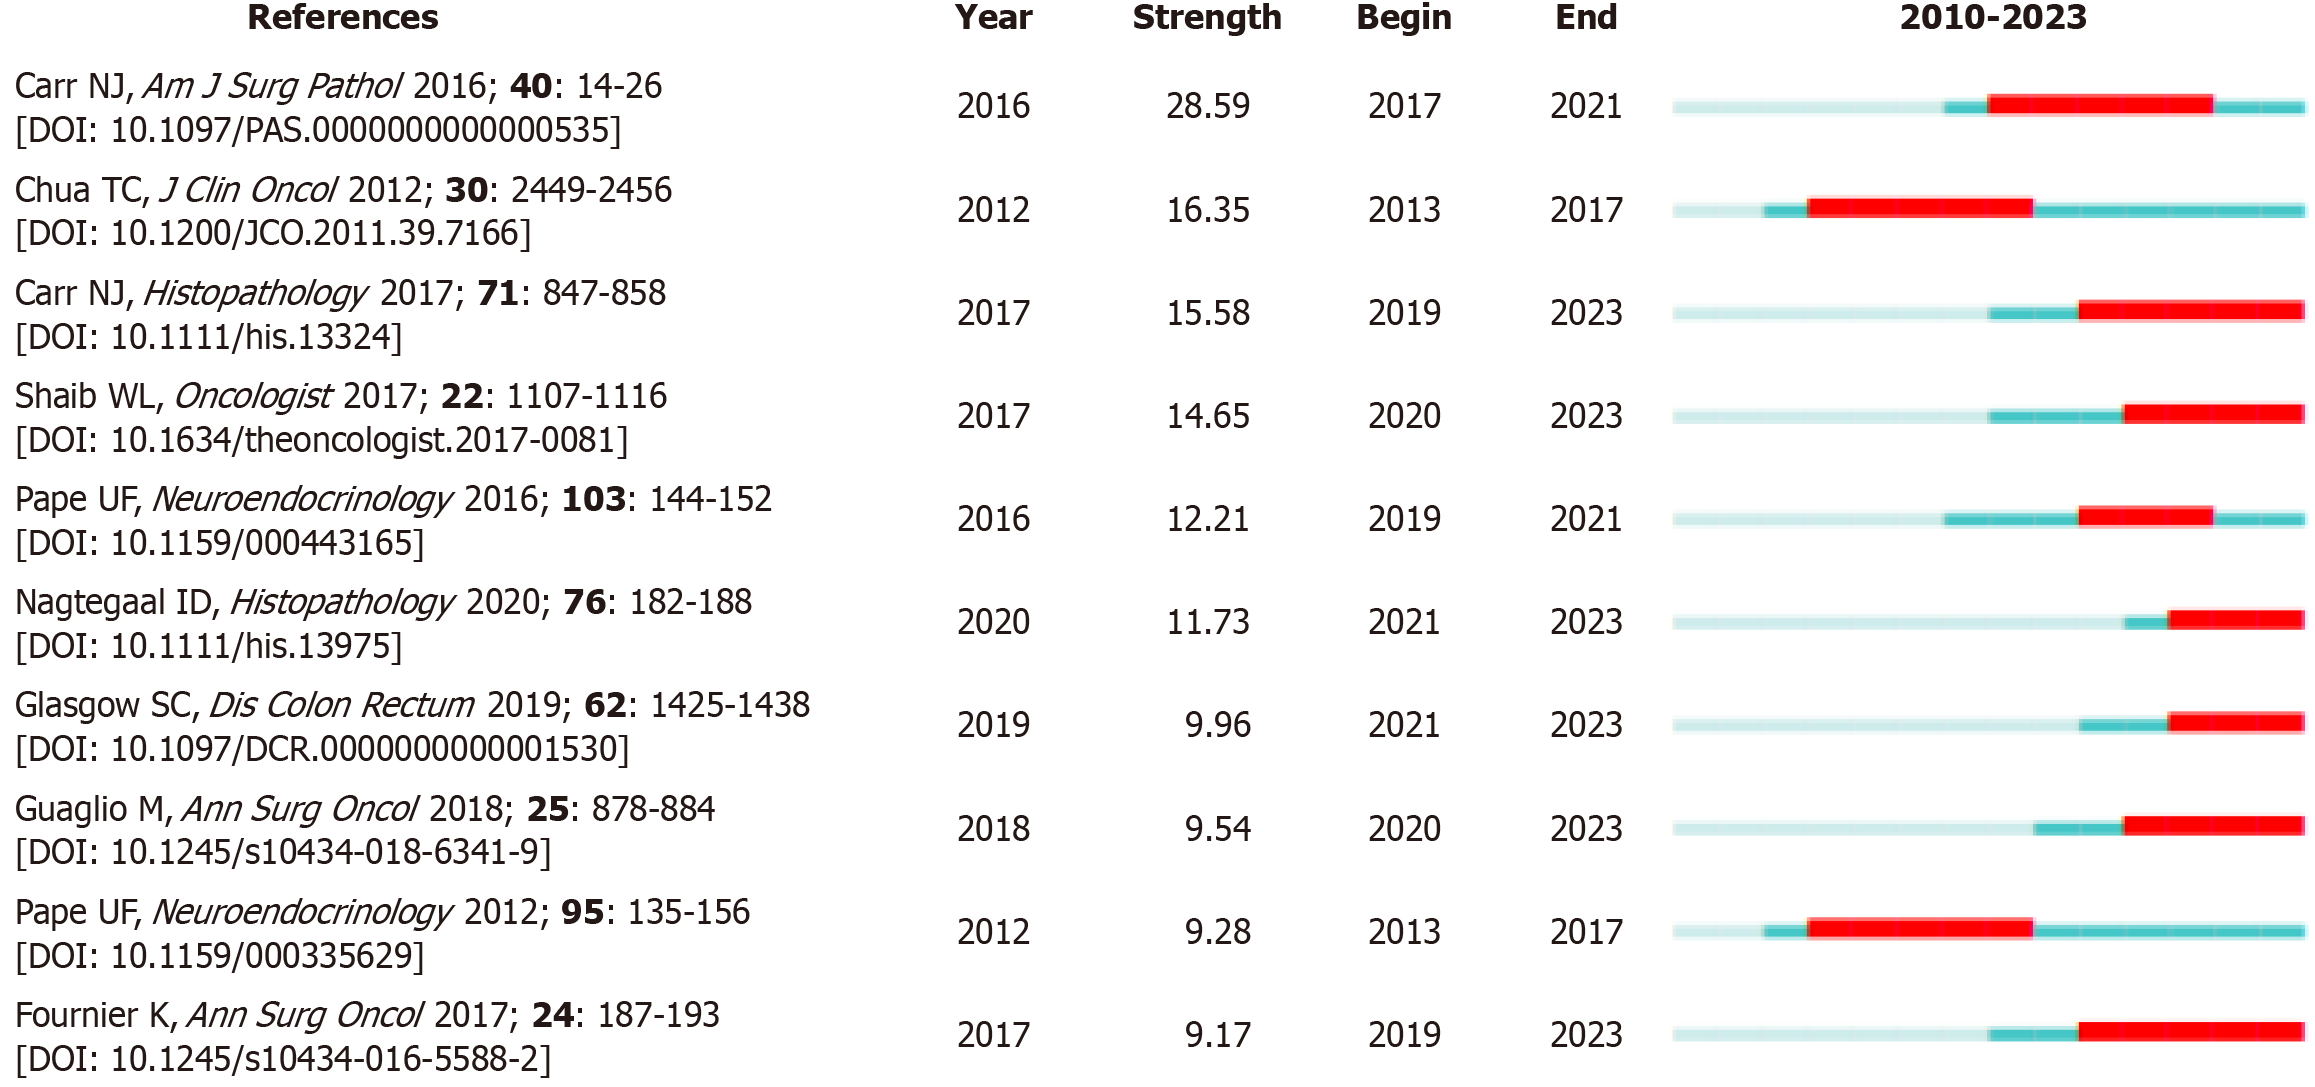
Figure 9 Top 10 references with citation burst.
The red bar represents the duration of strong citation burstiness. The burst strength represents the scientific value of the article.
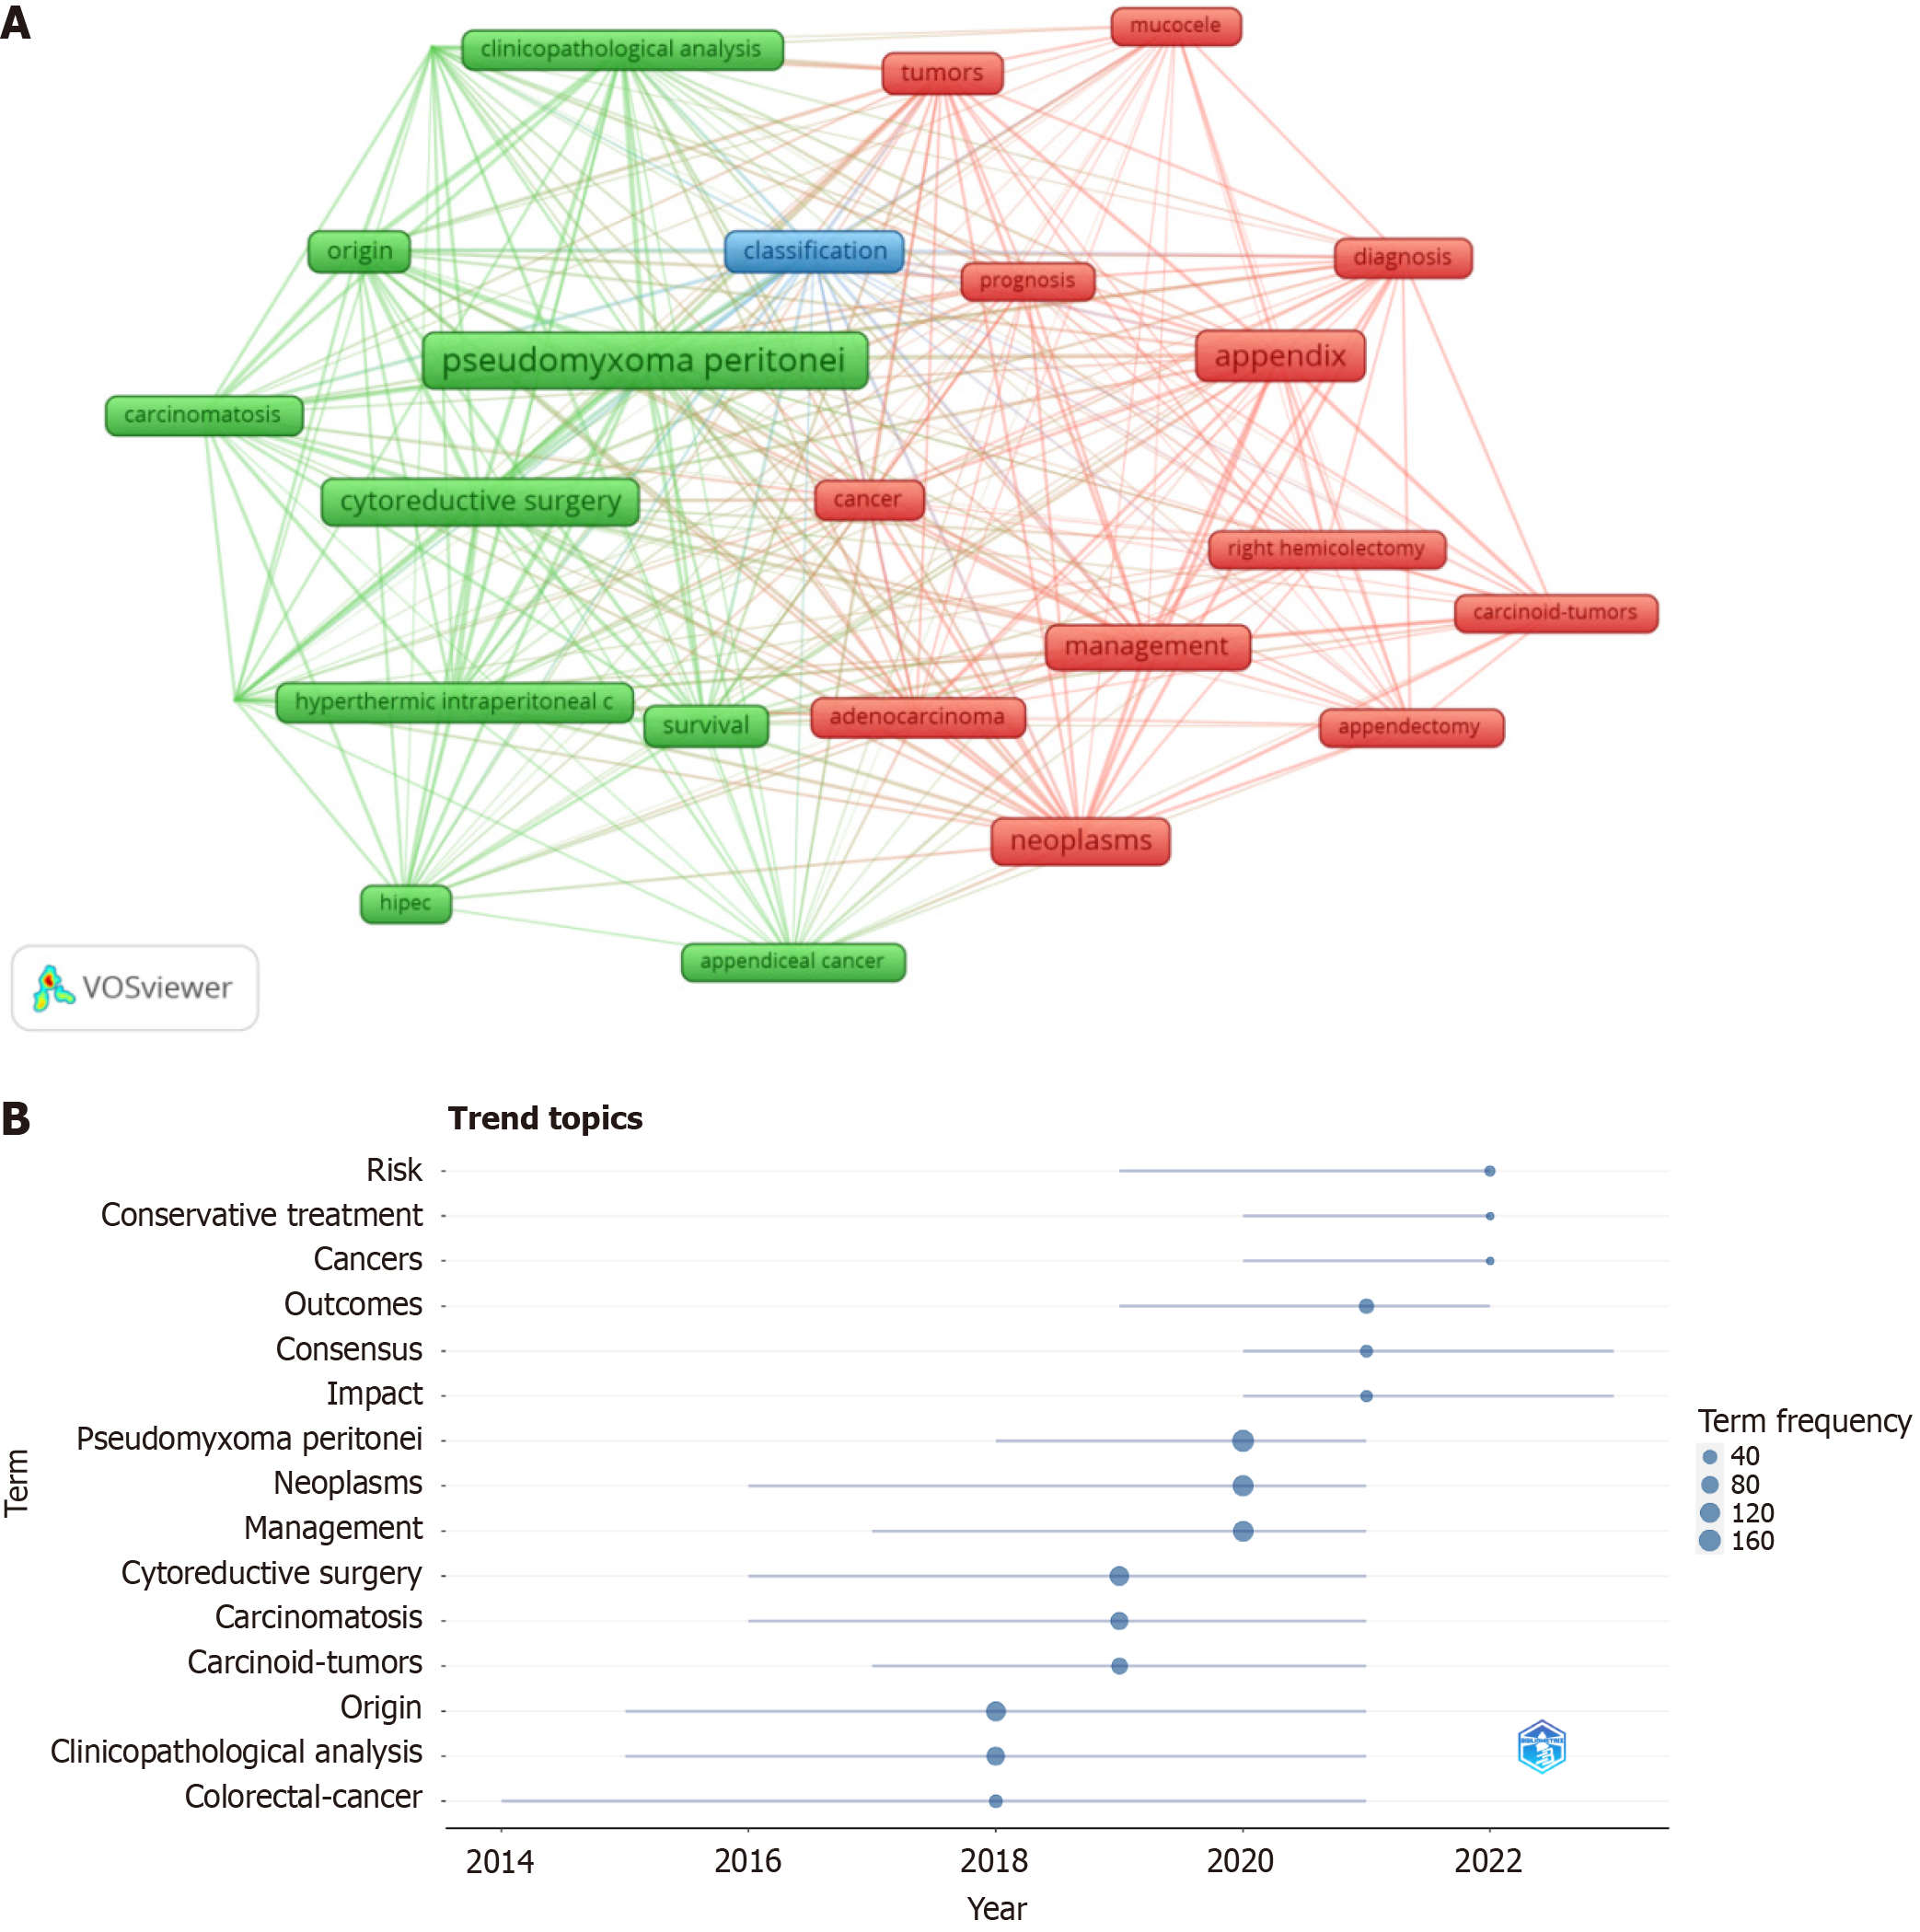
Figure 10 Keyword cluster analysis and trend topic analysis.
A: Keyword cluster analysis. Frame size represents frequency of keyword, and each color represents a cluster; B: Trend topic analysis. Node size represents trend frequency, and line length represents the duration.
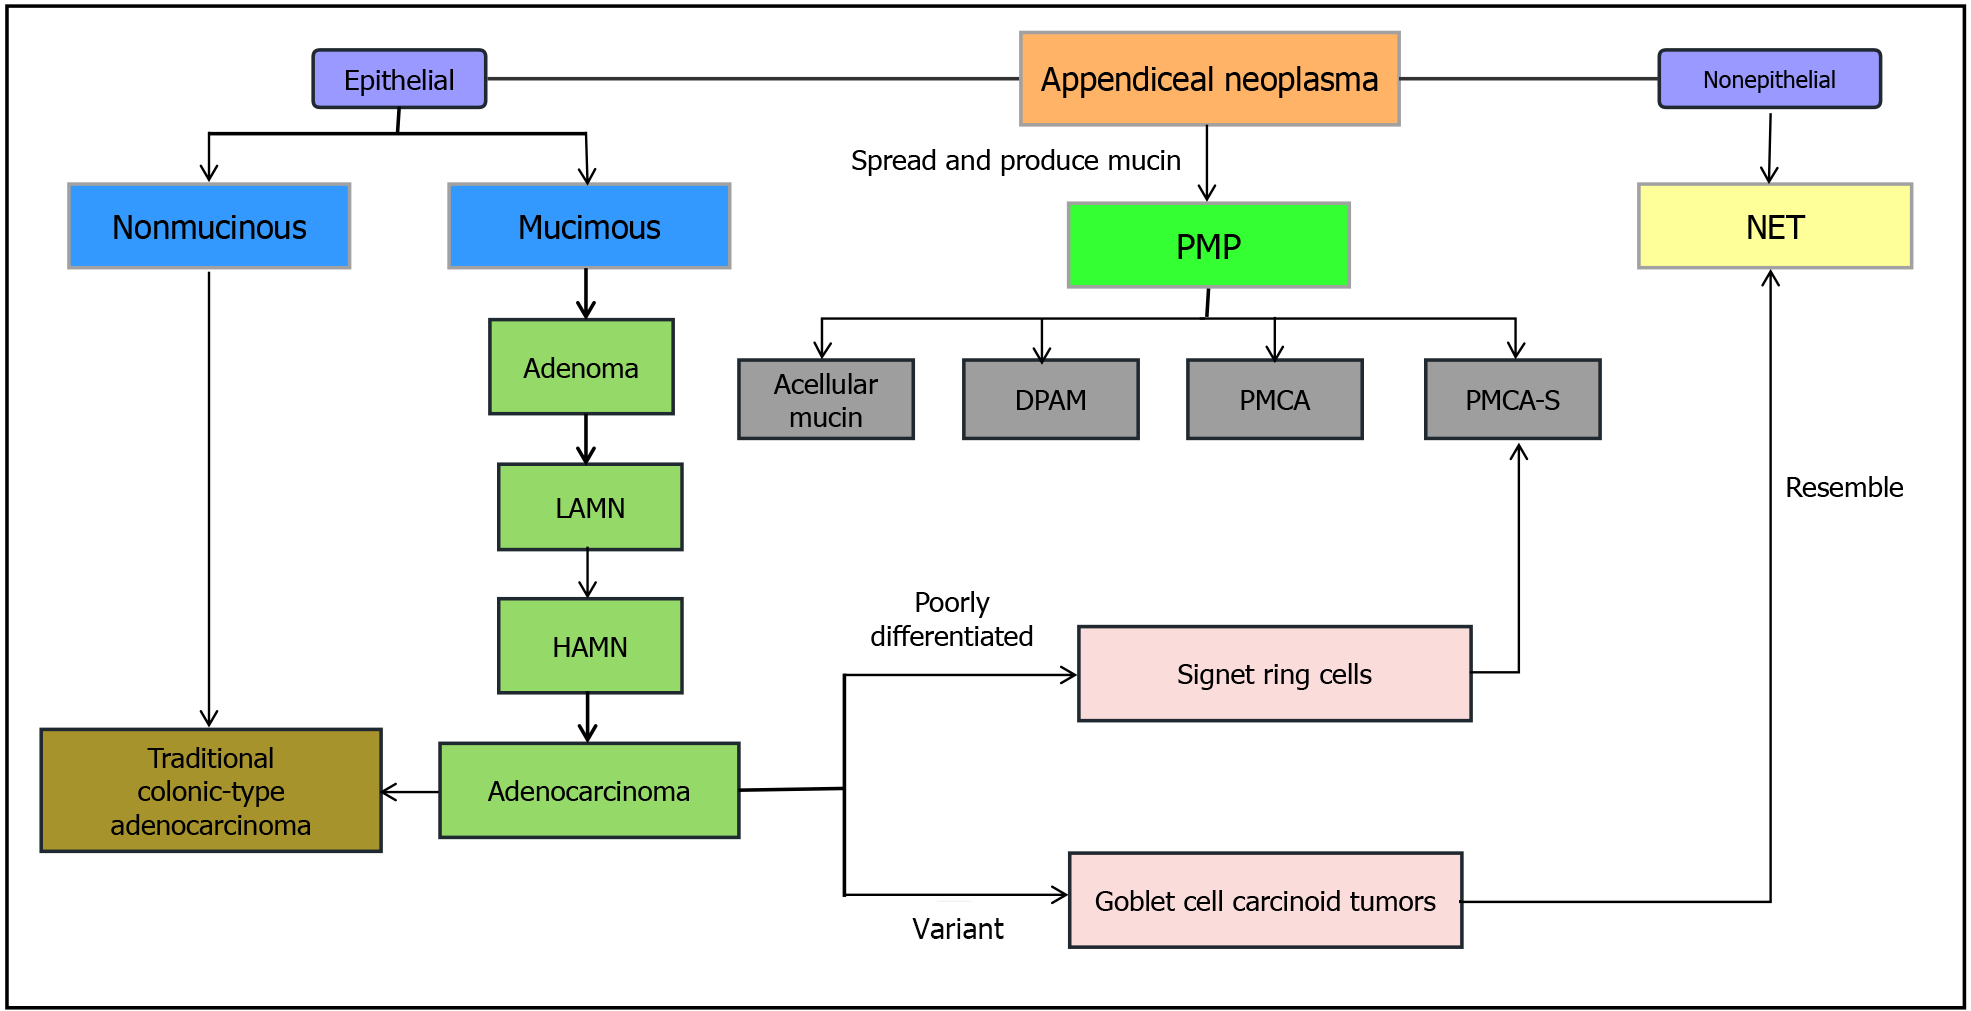
Figure 11 Classification of appendiceal neoplasm.
Visualization of classification of appendiceal neoplasm according to influential references. PMP: Pseudomyxoma peritonei; DPAM: Disseminated peritoneal adenomucinosis; PMCA: Peritoneal mucinous carcinomatosis; PMCA-S: Peritoneal mucinous carcinomatosis with signet ring cells; NET: Neuroendocrine tumor; LAMN: Low-grade appendiceal mucinous neoplasm; HAMN: High-grade appendiceal mucinous neoplasm.
- Citation: Ji JN, Yin ZB. Visualizing the landscape of appendiceal tumor research after 2010: A bibliometric study. World J Gastrointest Surg 2024; 16(6): 1894-1909
- URL: https://www.wjgnet.com/1948-9366/full/v16/i6/1894.htm
- DOI: https://dx.doi.org/10.4240/wjgs.v16.i6.1894


