Copyright
©The Author(s) 2024.
World J Gastrointest Surg. Jun 27, 2024; 16(6): 1803-1824
Published online Jun 27, 2024. doi: 10.4240/wjgs.v16.i6.1803
Published online Jun 27, 2024. doi: 10.4240/wjgs.v16.i6.1803
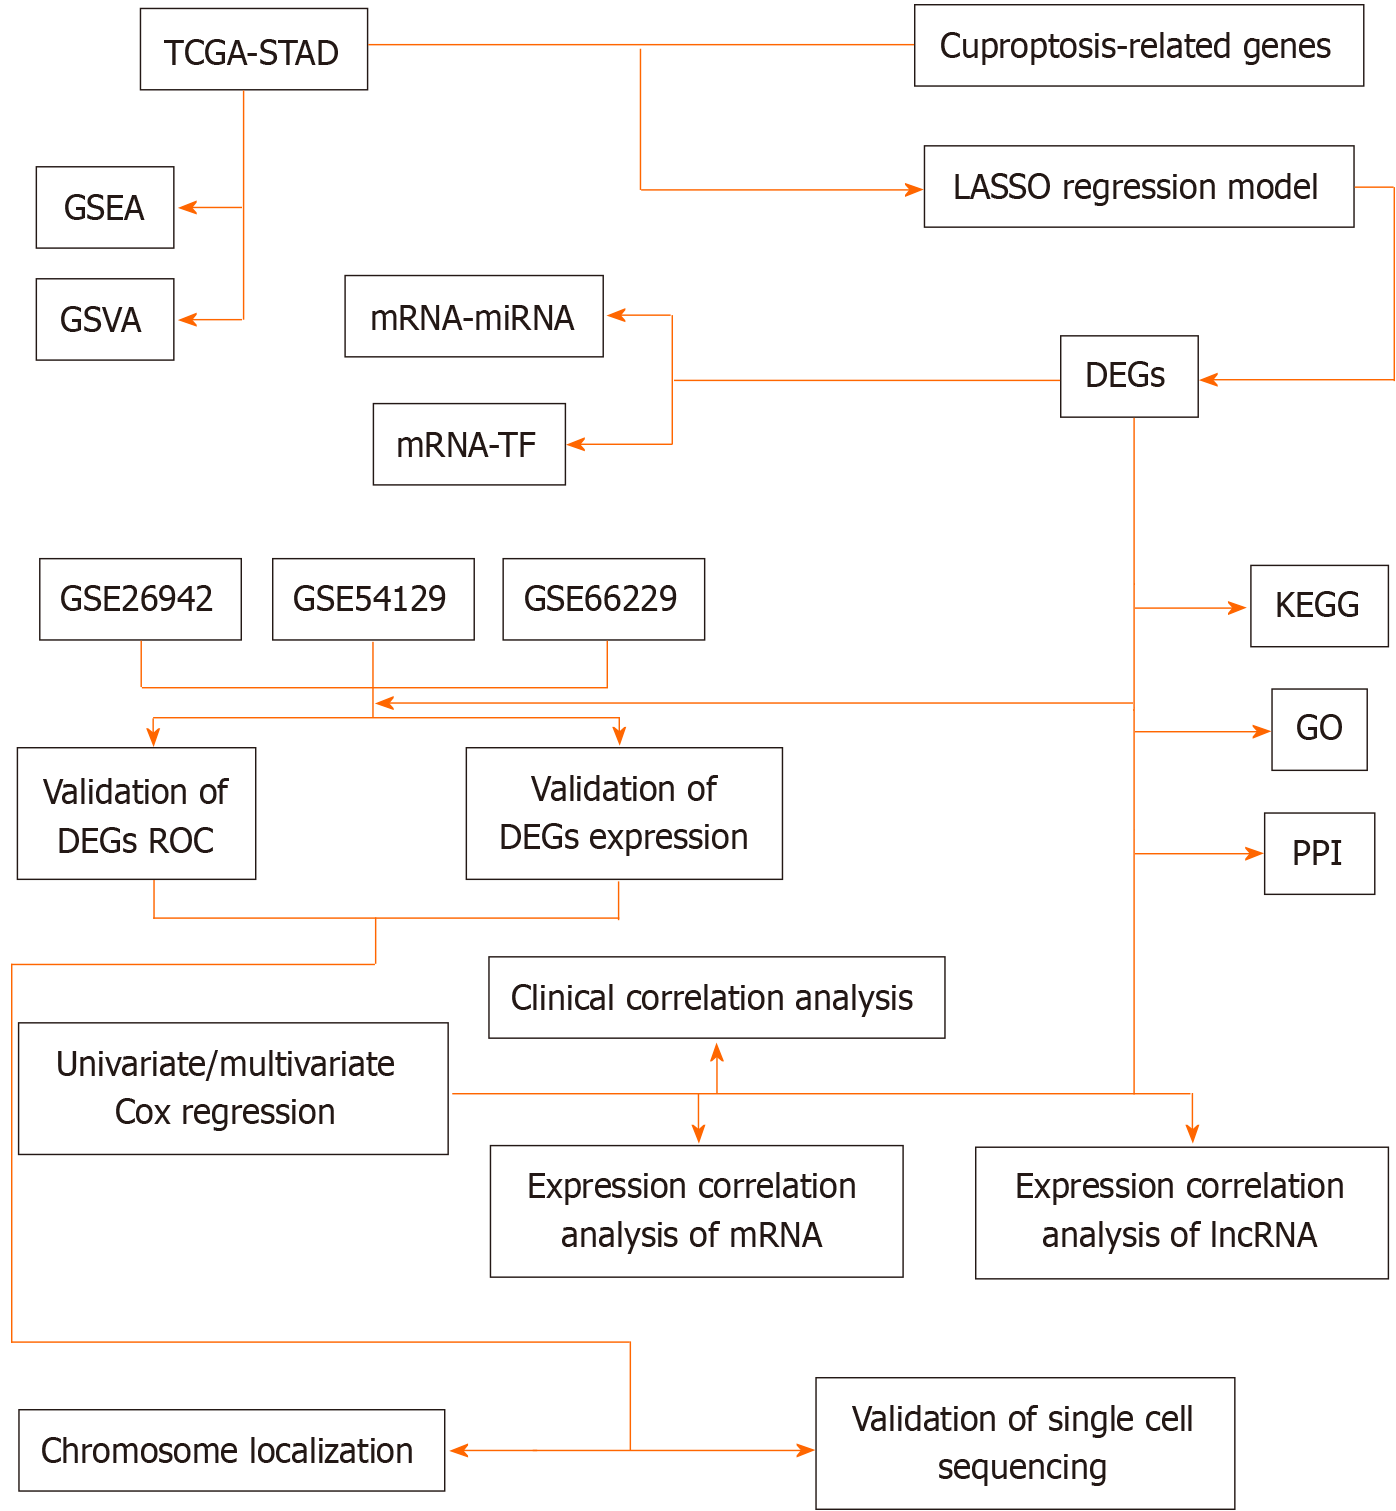
Figure 1 Technology roadmap.
STAD: Stomach adenocarcinoma; TCGA: The Cancer Genome Atlas; GSEA: Gene Set Enrichment Analysis; GSVA: Gene Set Variation Analysis; LASSO: Least Absolute Shrinkage and Selection Operator; DEGs: Differentially expressed genes; KEGG: Kyoto Encyclopedia of Genes and Genomes; GO: Gene Ontology; PPI: Protein-protein interaction; ROC: Receiver operating characteristic curve.
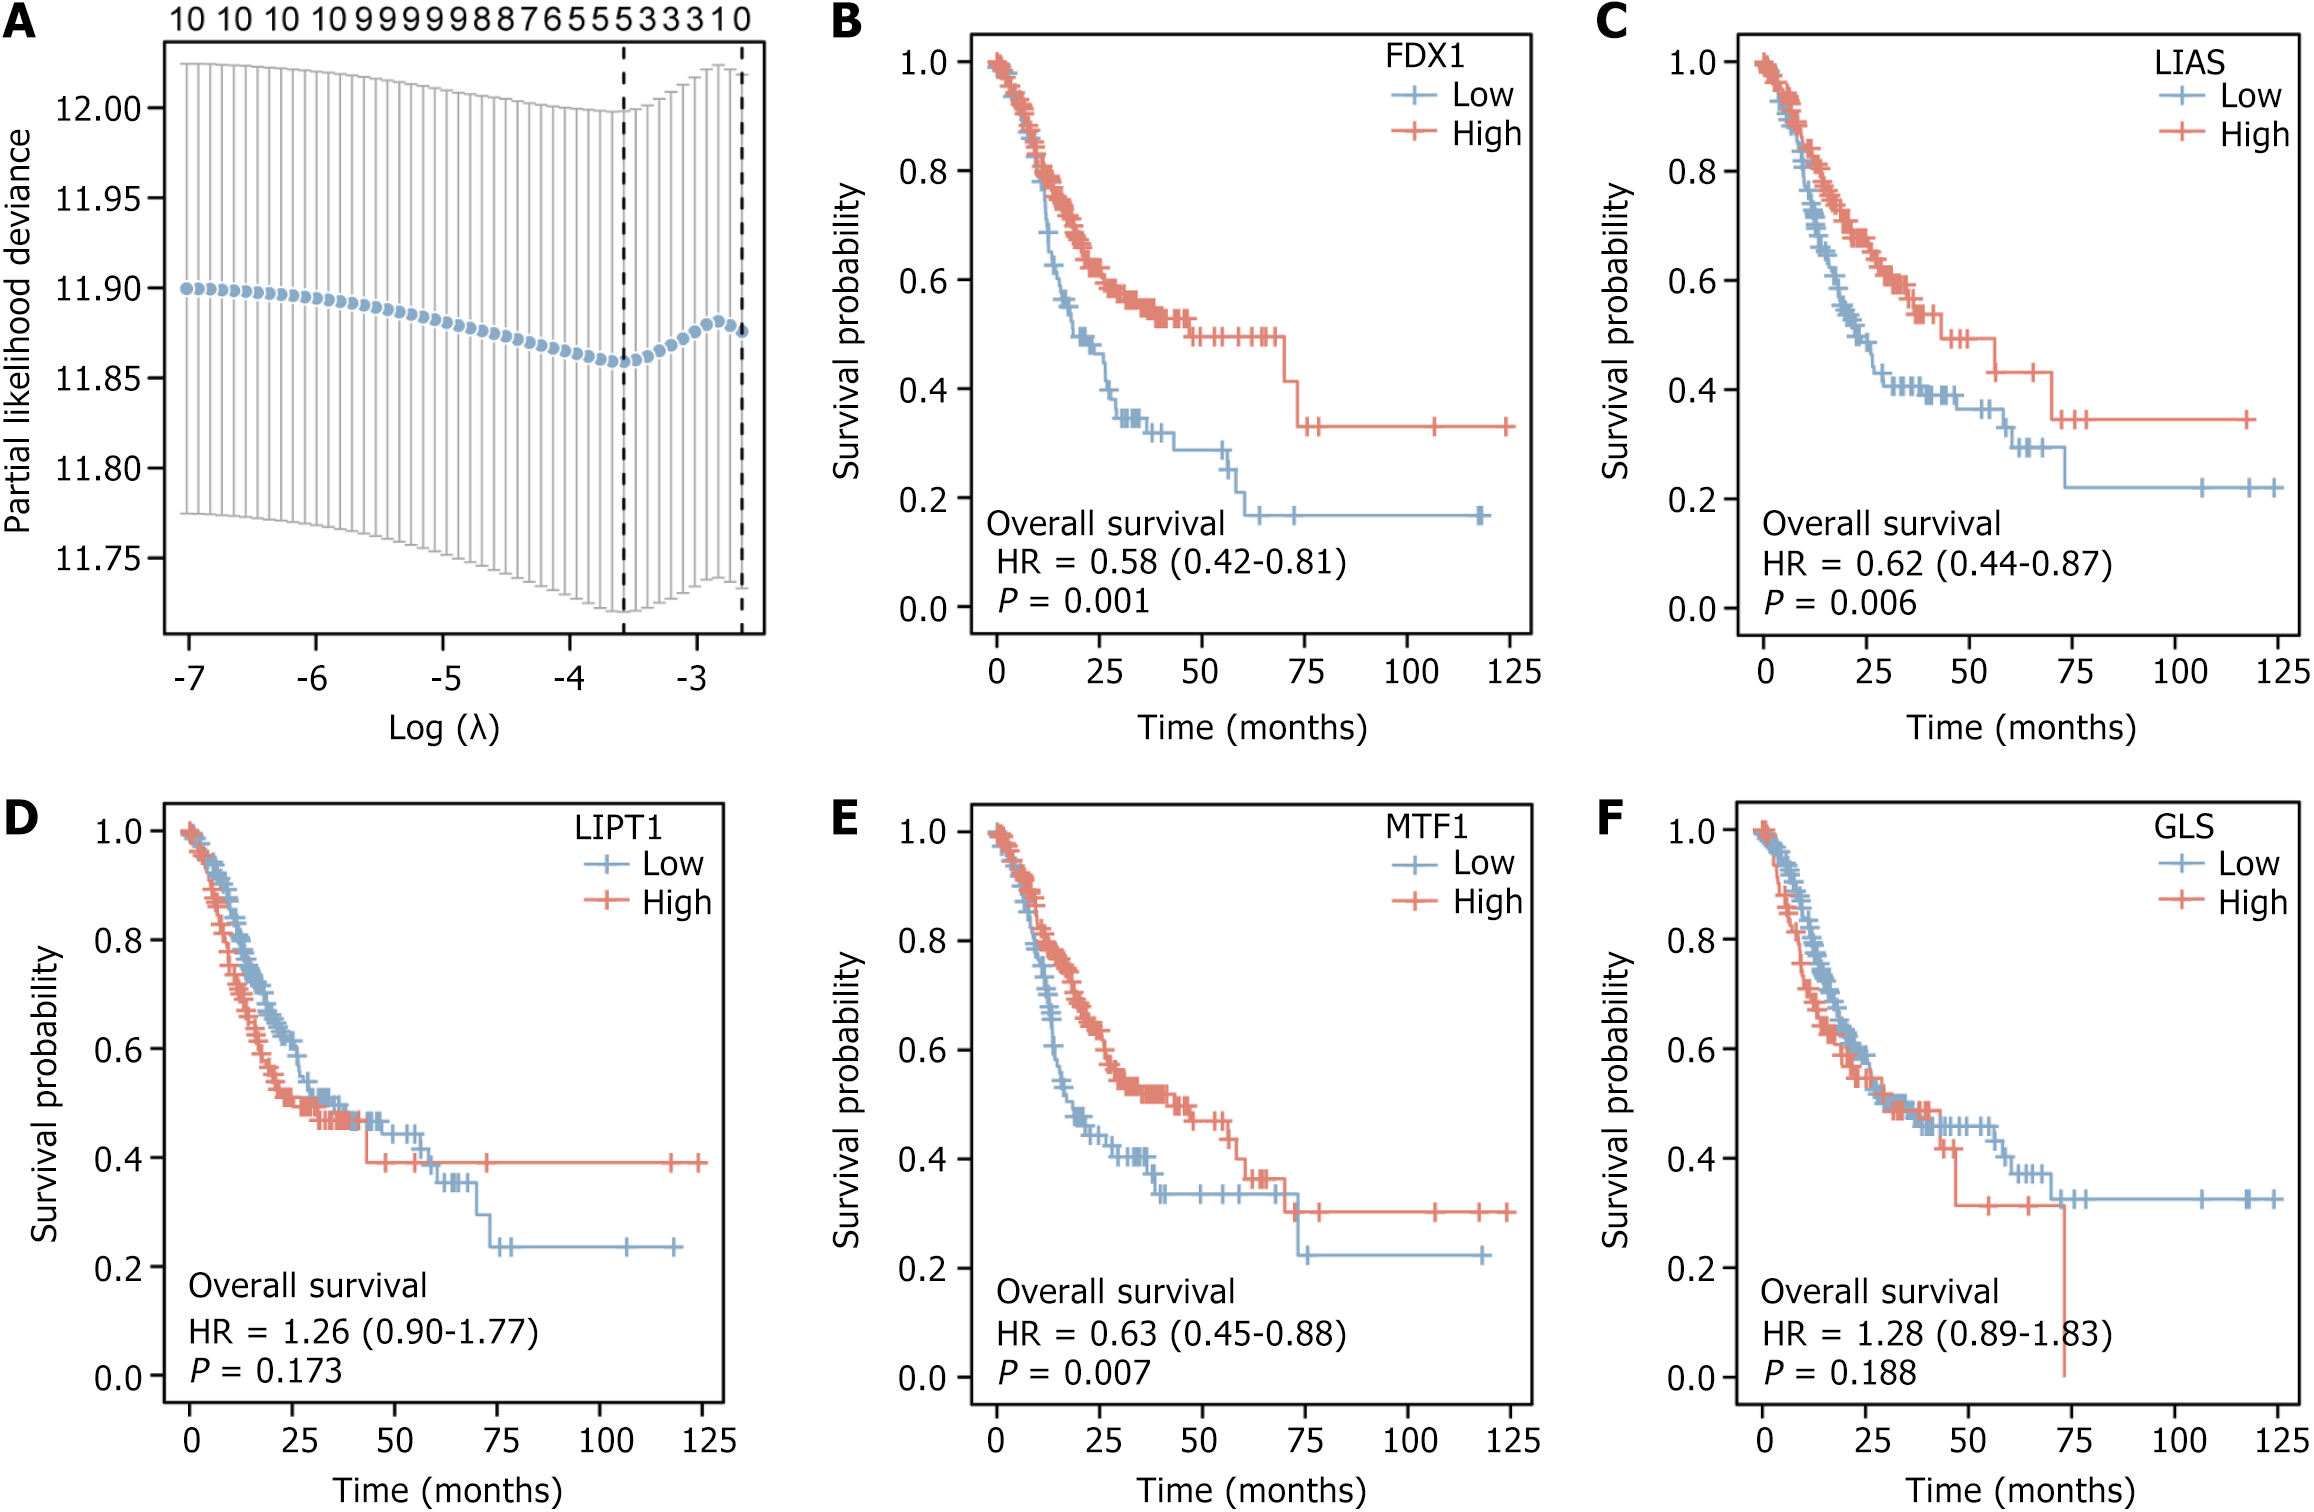
Figure 2 Visualisation of Least Absolute Shrinkage and Selection Operator regression results and Kaplan-Meier curves.
A: Visualization of Least Absolute Shrinkage and Selection Operator regression results for dataset The Cancer Genome Atlas (TCGA)-stomach adenocarcinoma (STAD); B: Kaplan-Meier (K-M) curves for gene FDX1 in dataset TCGA-STAD; C: K-M curves for gene LIAS in dataset TCGA-STAD; D: K-M curves for gene LIPT1 in dataset TCGA-STAD; E: K-M curves for gene MTF1 in dataset TCGA-STAD; F: K-M curves for gene GLS in dataset TCGA-STAD.
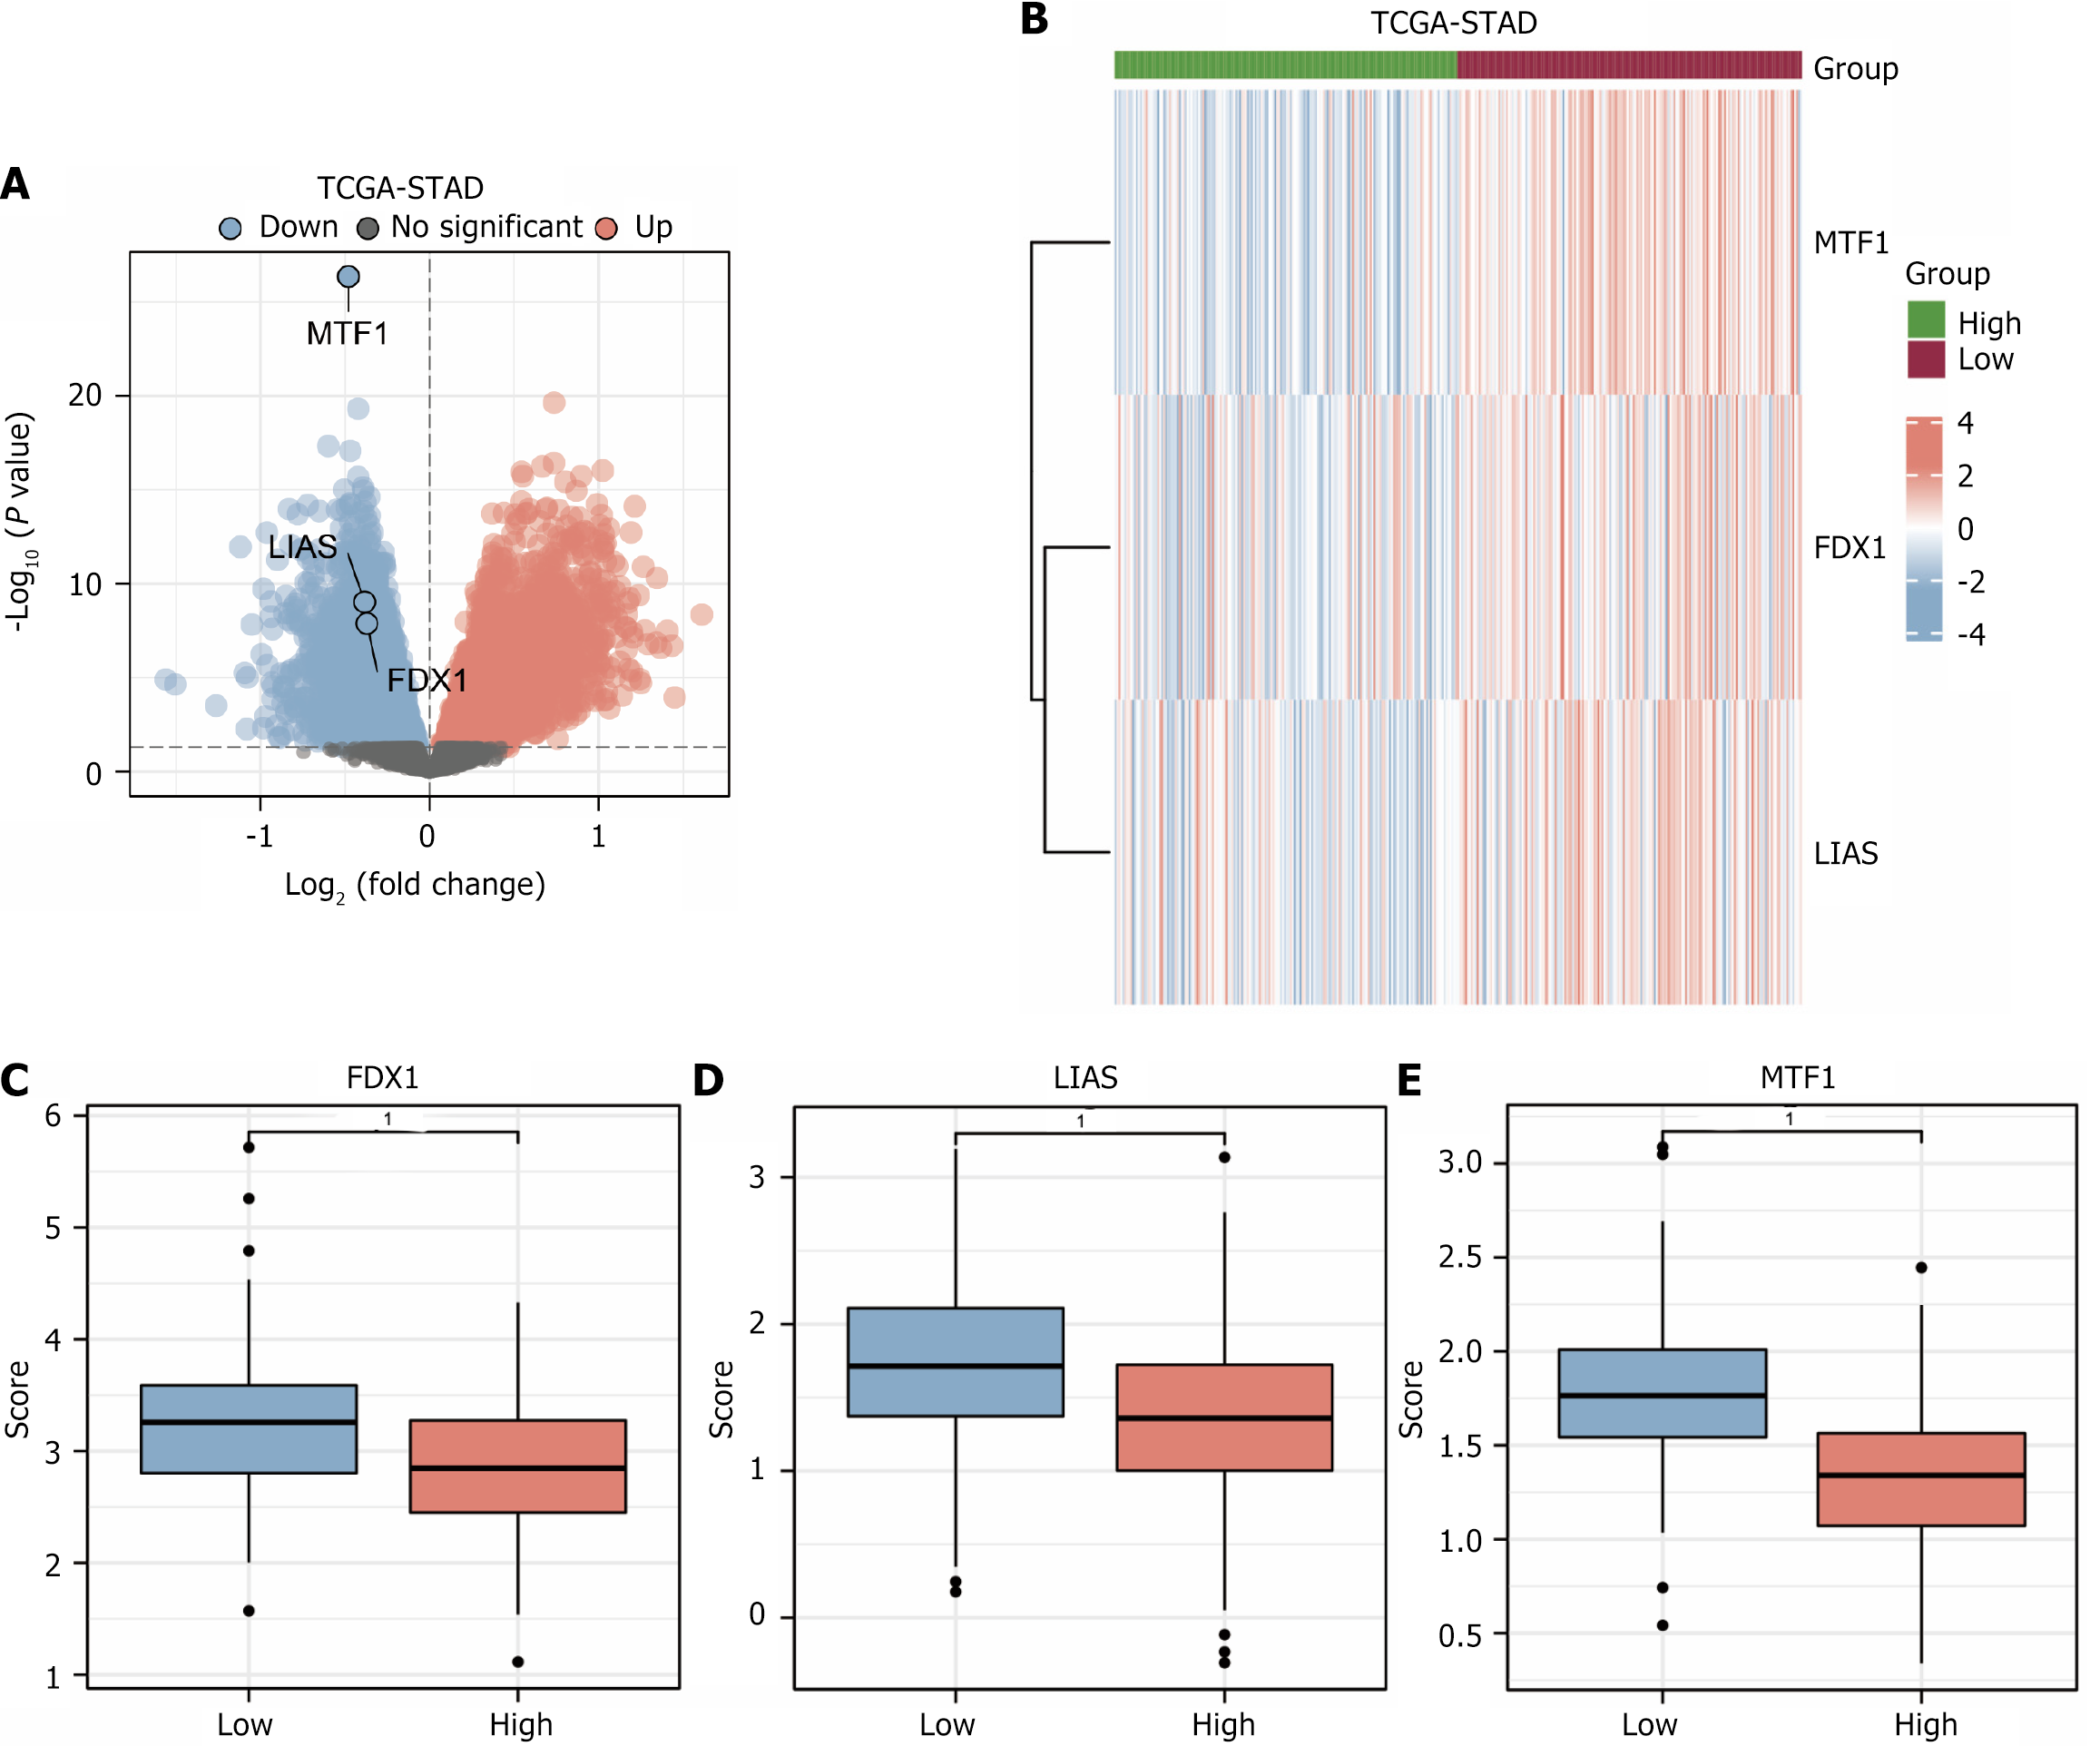
Figure 3 Volcano plot of The Cancer Genome Atlas-stomach adenocarcinoma differential analysis results for dataset, heat map of prognostic differentially expressed genes and group comparison plot.
A: Volcano plot of results of differential analysis in dataset The Cancer Genome Atlas (TCGA)-stomach adenocarcinoma (STAD; genes marked in the plot are copper death prognosis-related differentially expressed genes); B: Heat map of expression of copper death prognosis-related differentially expressed genes in dataset TCGA-STAD according to high and low risk subgroups; C: Comparison plot of gene FDX1 in high and low risk groups (subgroups: High and low) in dataset TCGA-STAD; D: Comparative plot of gene LIAS; E: Comparative plot of gene MTF1. TCGA: The Cancer Genome Atlas; STAD: Stomach adenocarcinoma; Up: Up-regulated genes; Down: Down-regulated genes. 1P < 0.001, which is highly statistically significant.
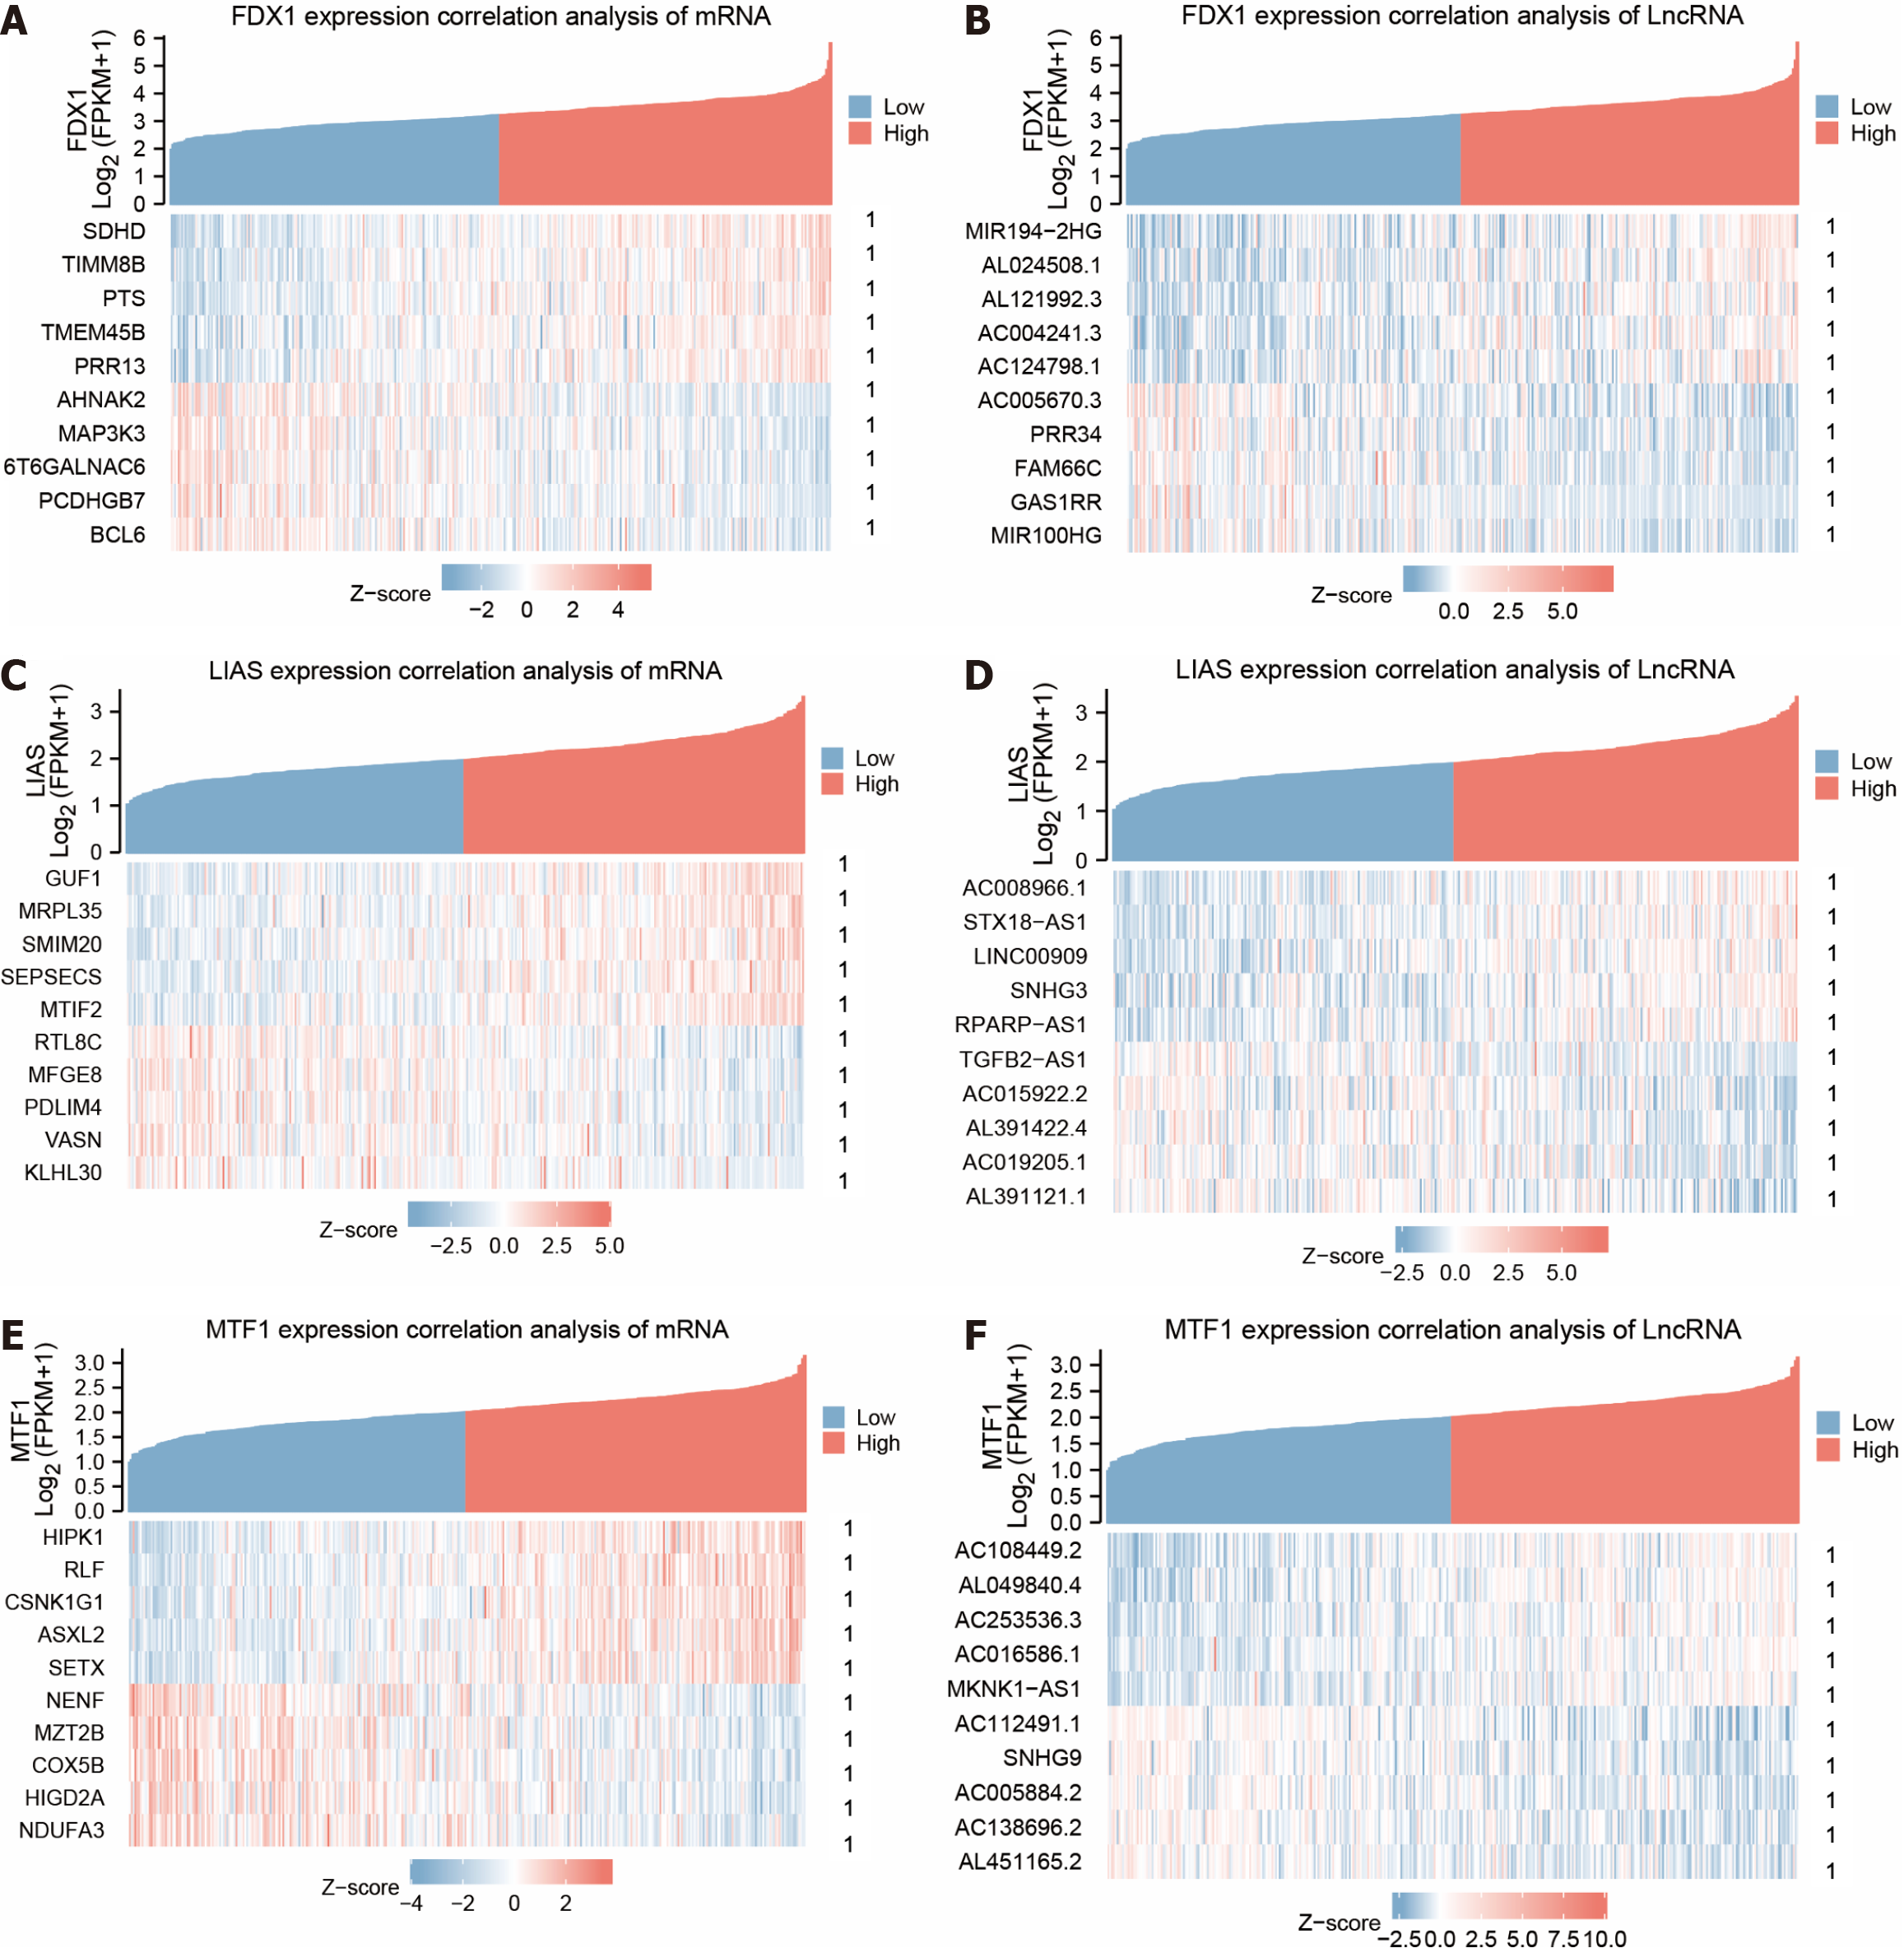
Figure 4 Co-expression heat map of differentially expressed genes for copper death prognosis.
A: Heat map of gene FDX1 co-expression with genotypes of protein-coding molecules with positive correlation Top5 and negative correlation Top5 genes; B: Heat map of gene FDX1 co-expression with genotypes of LncRNA molecules with positive correlation Top5 and negative correlation Top5 genes; C: Heat map of gene LIAS co-expression with genotypes of protein-coding molecules with positive correlation Top5 and negative correlation Top5 genes; D: Co-expression heat map of gene LIAS with genotype LncRNA molecules for positively associated Top5 and negatively associated Top5 genes; E: Co-expression heat map of gene MTF1 with genotype protein-coding molecules for positively associated Top5 and negatively associated Top5 genes; F: Co-expression heat map of gene MTF1 with genotype LncRNA molecules for positively associated Top5 and negatively associated Top5 genes. Negatively related Top5 genes co-expression heat map. 1P < 0.001, which is highly statistically significant.
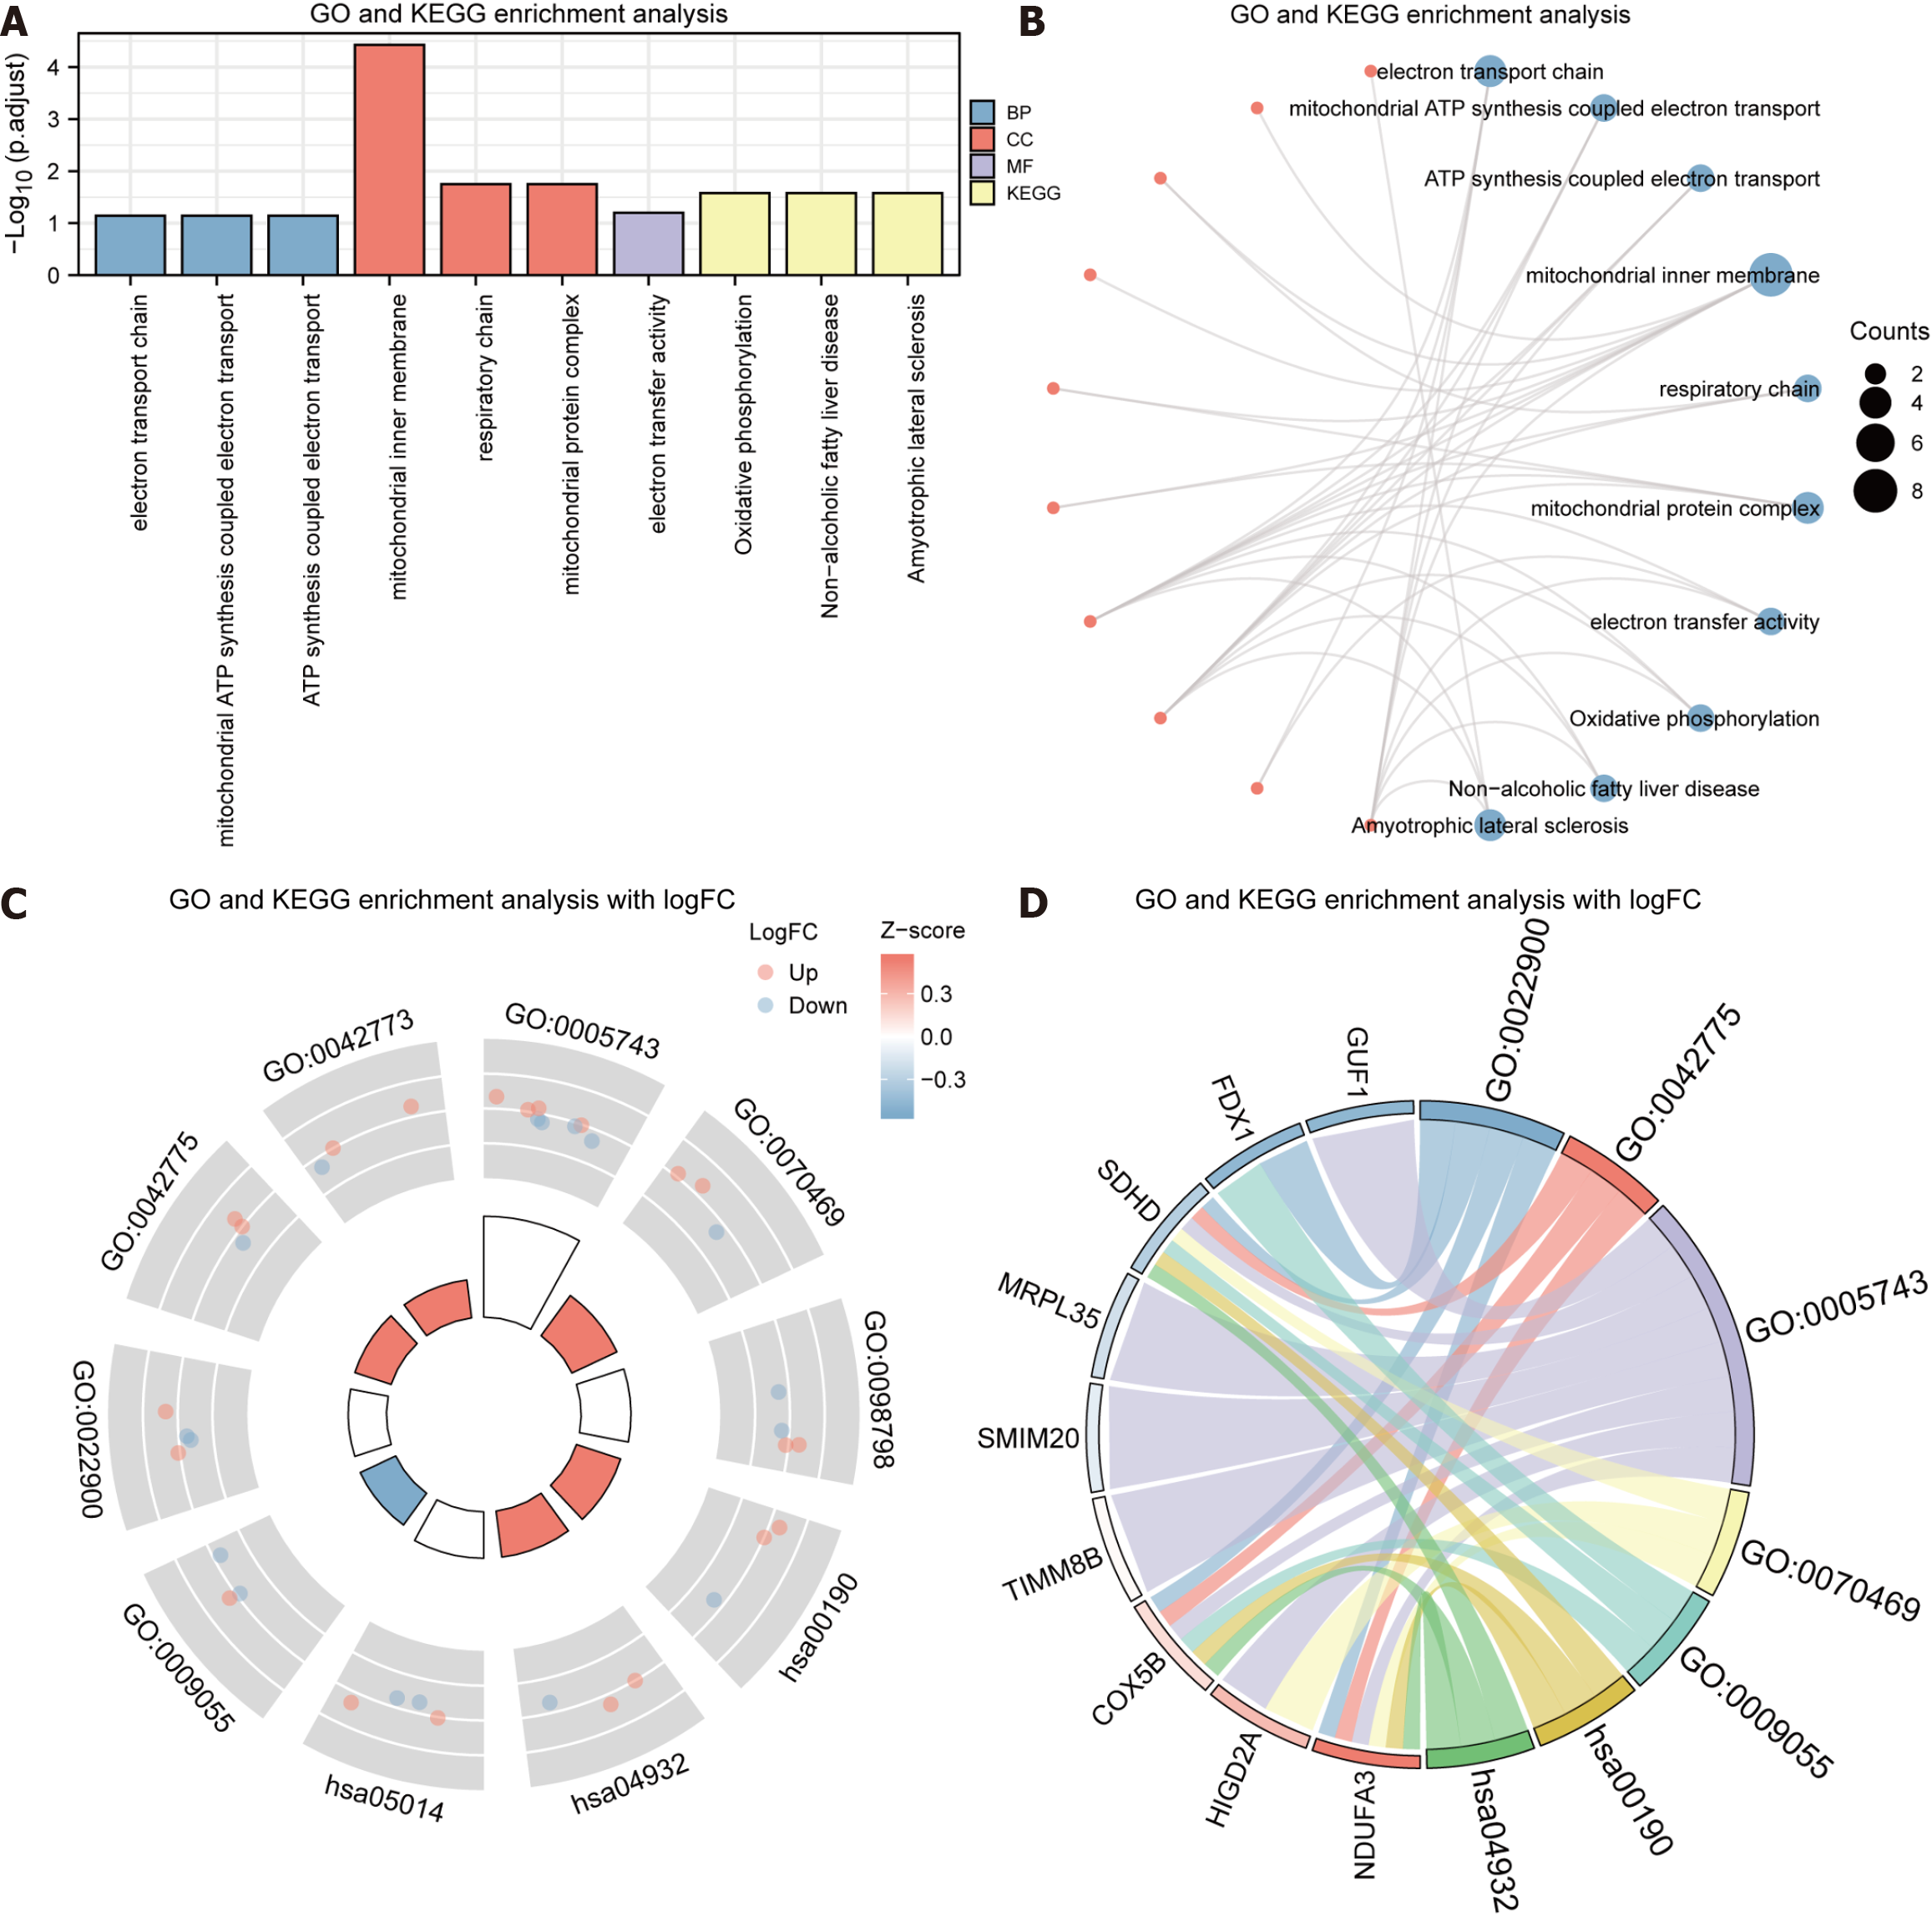
Figure 5 Visualization of functional enrichment (Gene Ontology) and pathway enrichment (Kyoto Encyclopedia of Genes and Genomes) analyses outcomes.
A: Histogram of functional enrichment [Gene Ontology (GO)] and pathway enrichment [Kyoto Encyclopedia of Genes and Genomes (KEGG)] analyses outcomes; B: Ring network of functional enrichment (GO) and pathway enrichment (KEGG) analyses outcomes; C: Circle plot of the combined logFC outcomes of functional enrichment (GO) and pathway enrichment (KEGG) analyses; D: String plot of the combined logFC outcomes of functional enrichment (GO) and pathway enrichment (KEGG) analyses. STAD: Stomach adenocarcinoma. GO: Gene Ontology; KEGG: Kyoto Encyclopedia of Genes and Genomes; BP: Biological process; CC: Bellular component; MF: Molecular function; Up: Up-regulated genes; Down: Down-regulated genes.
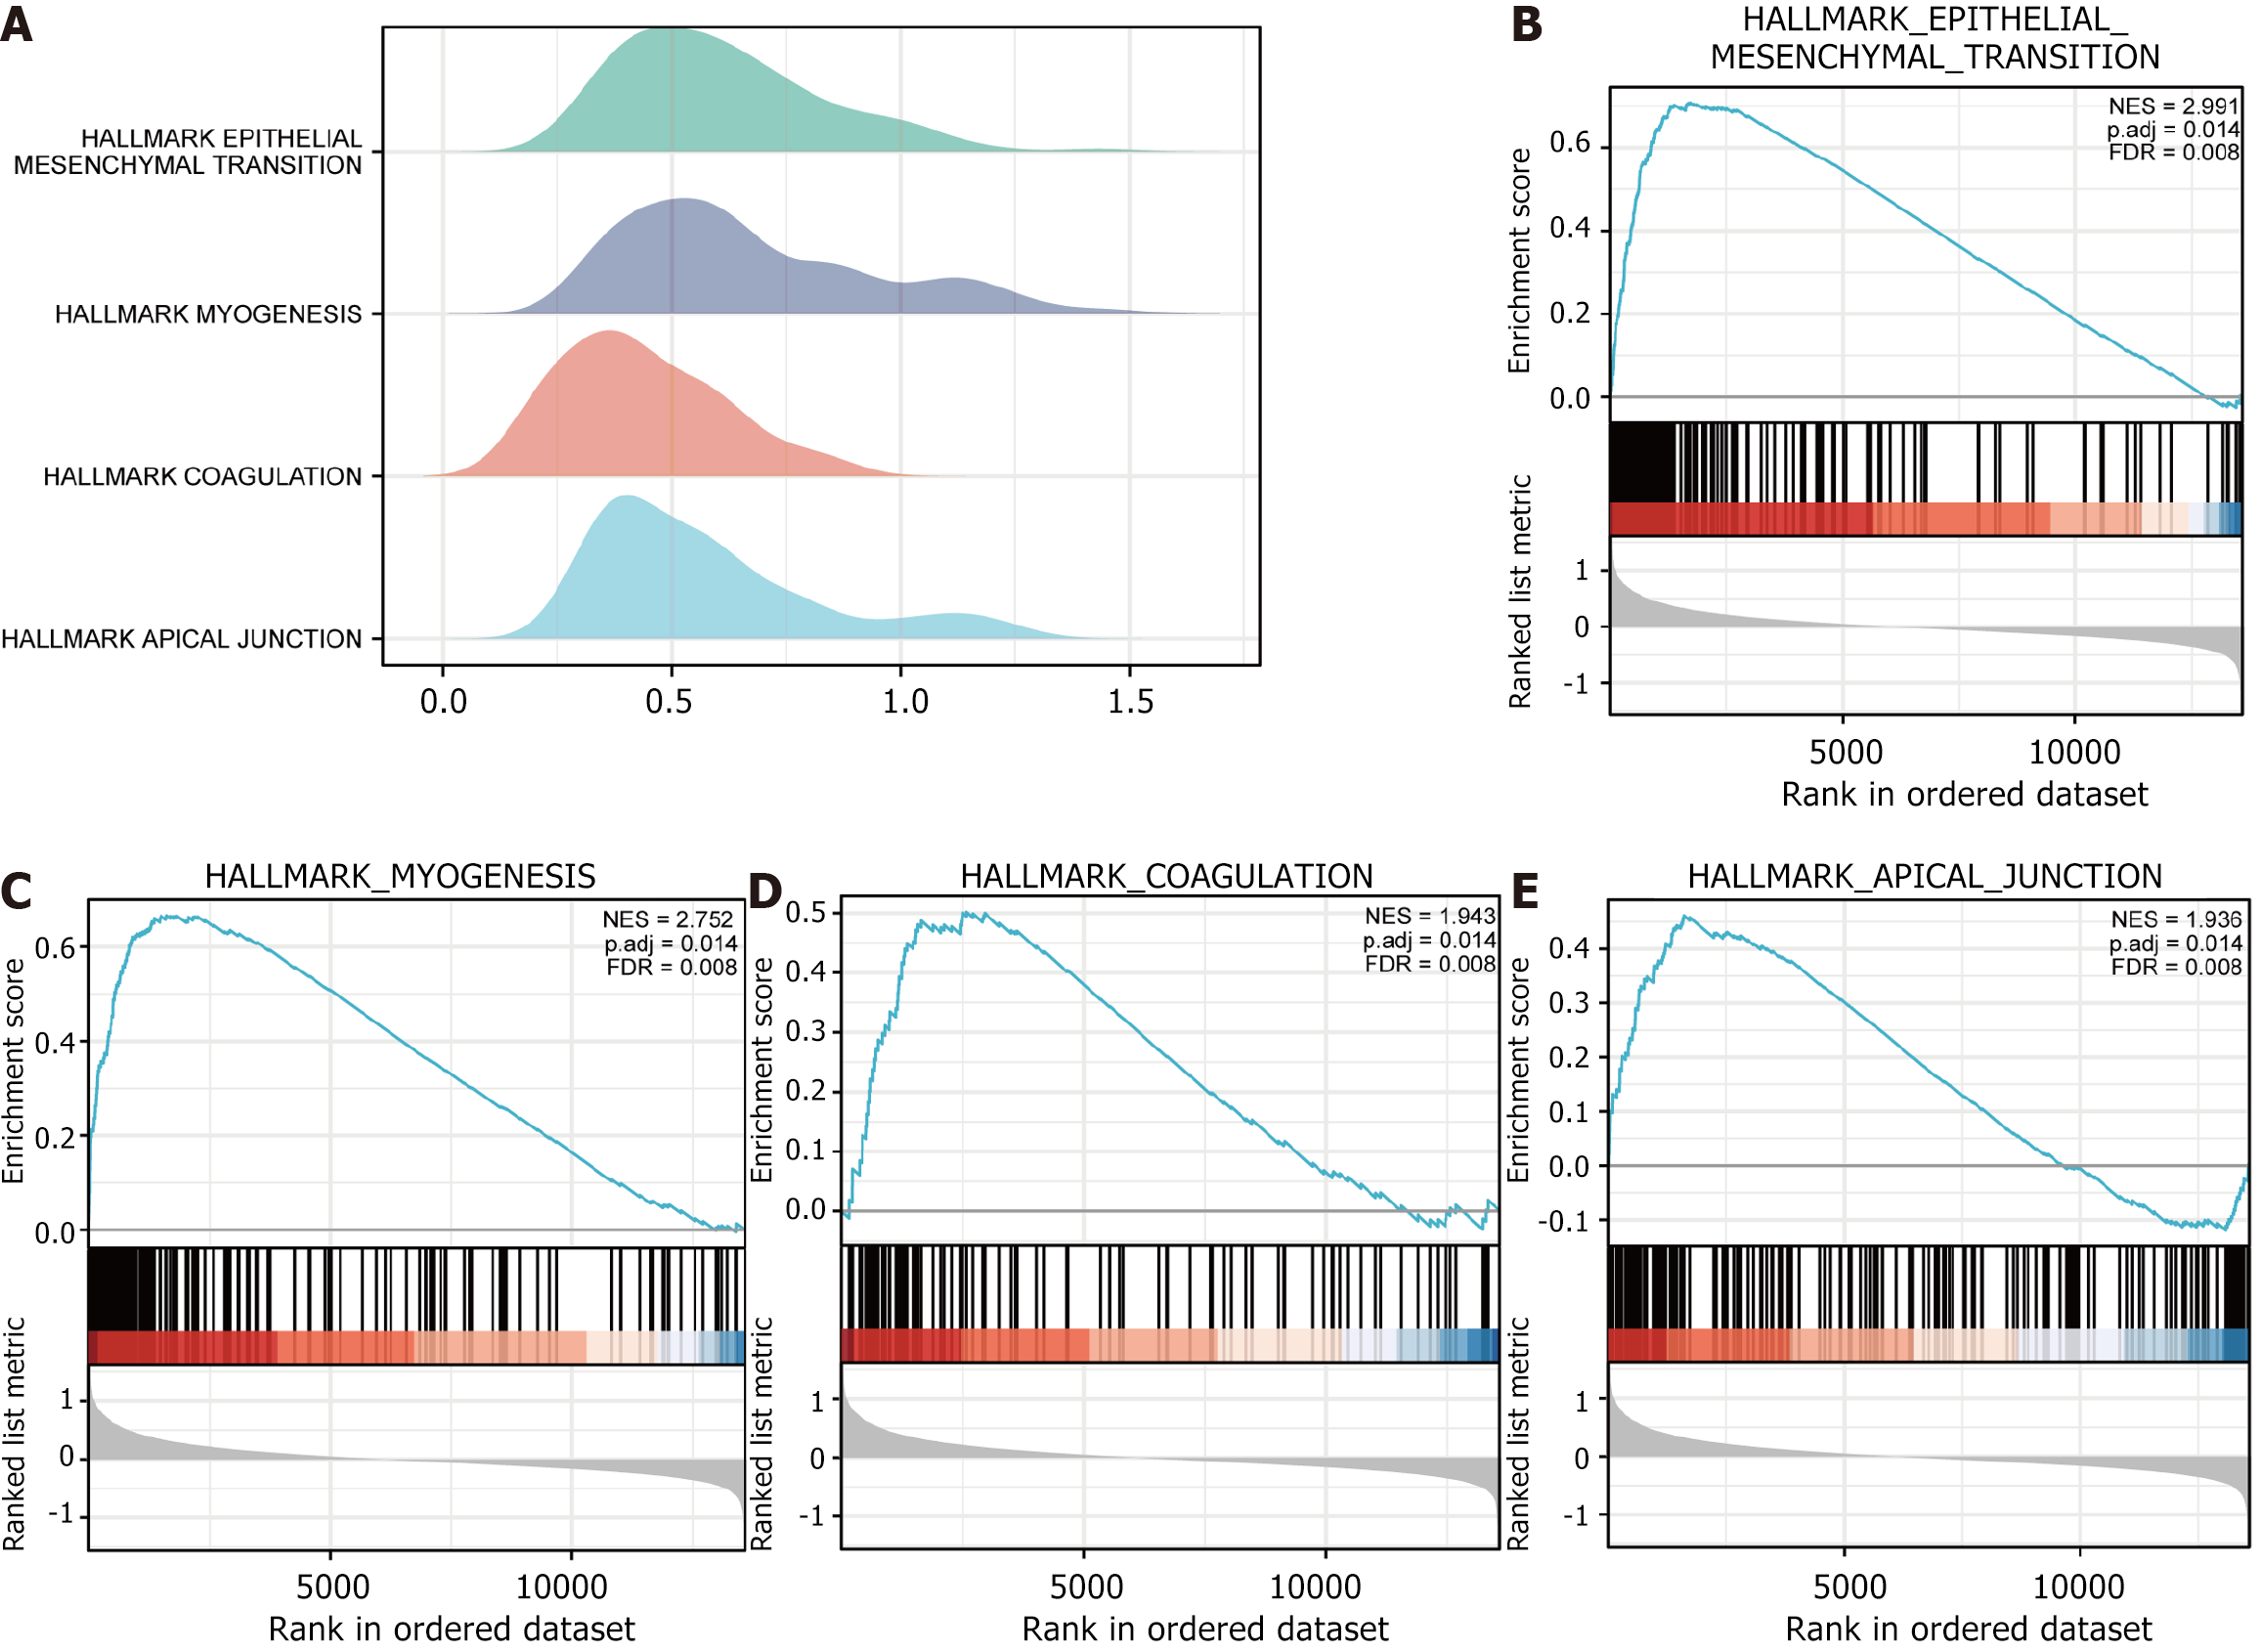
Figure 6 Gene Set Enrichment Analysis of the dataset The Cancer Genome Atlas-stomach adenocarcinoma.
A: Mountain plot of Gene Set Enrichment Analysis (GSEA) results for the dataset The Cancer Genome Atlas (TCGA)-stomach adenocarcinoma (STAD) for gastric cancer (STAD); B: GSEA of all genes in the dataset TCGA-STAD in high and low risk subgroups (subgroup: High and subgroup: Low) vs HALLMARK_EPITHELIAL_MESENCHY
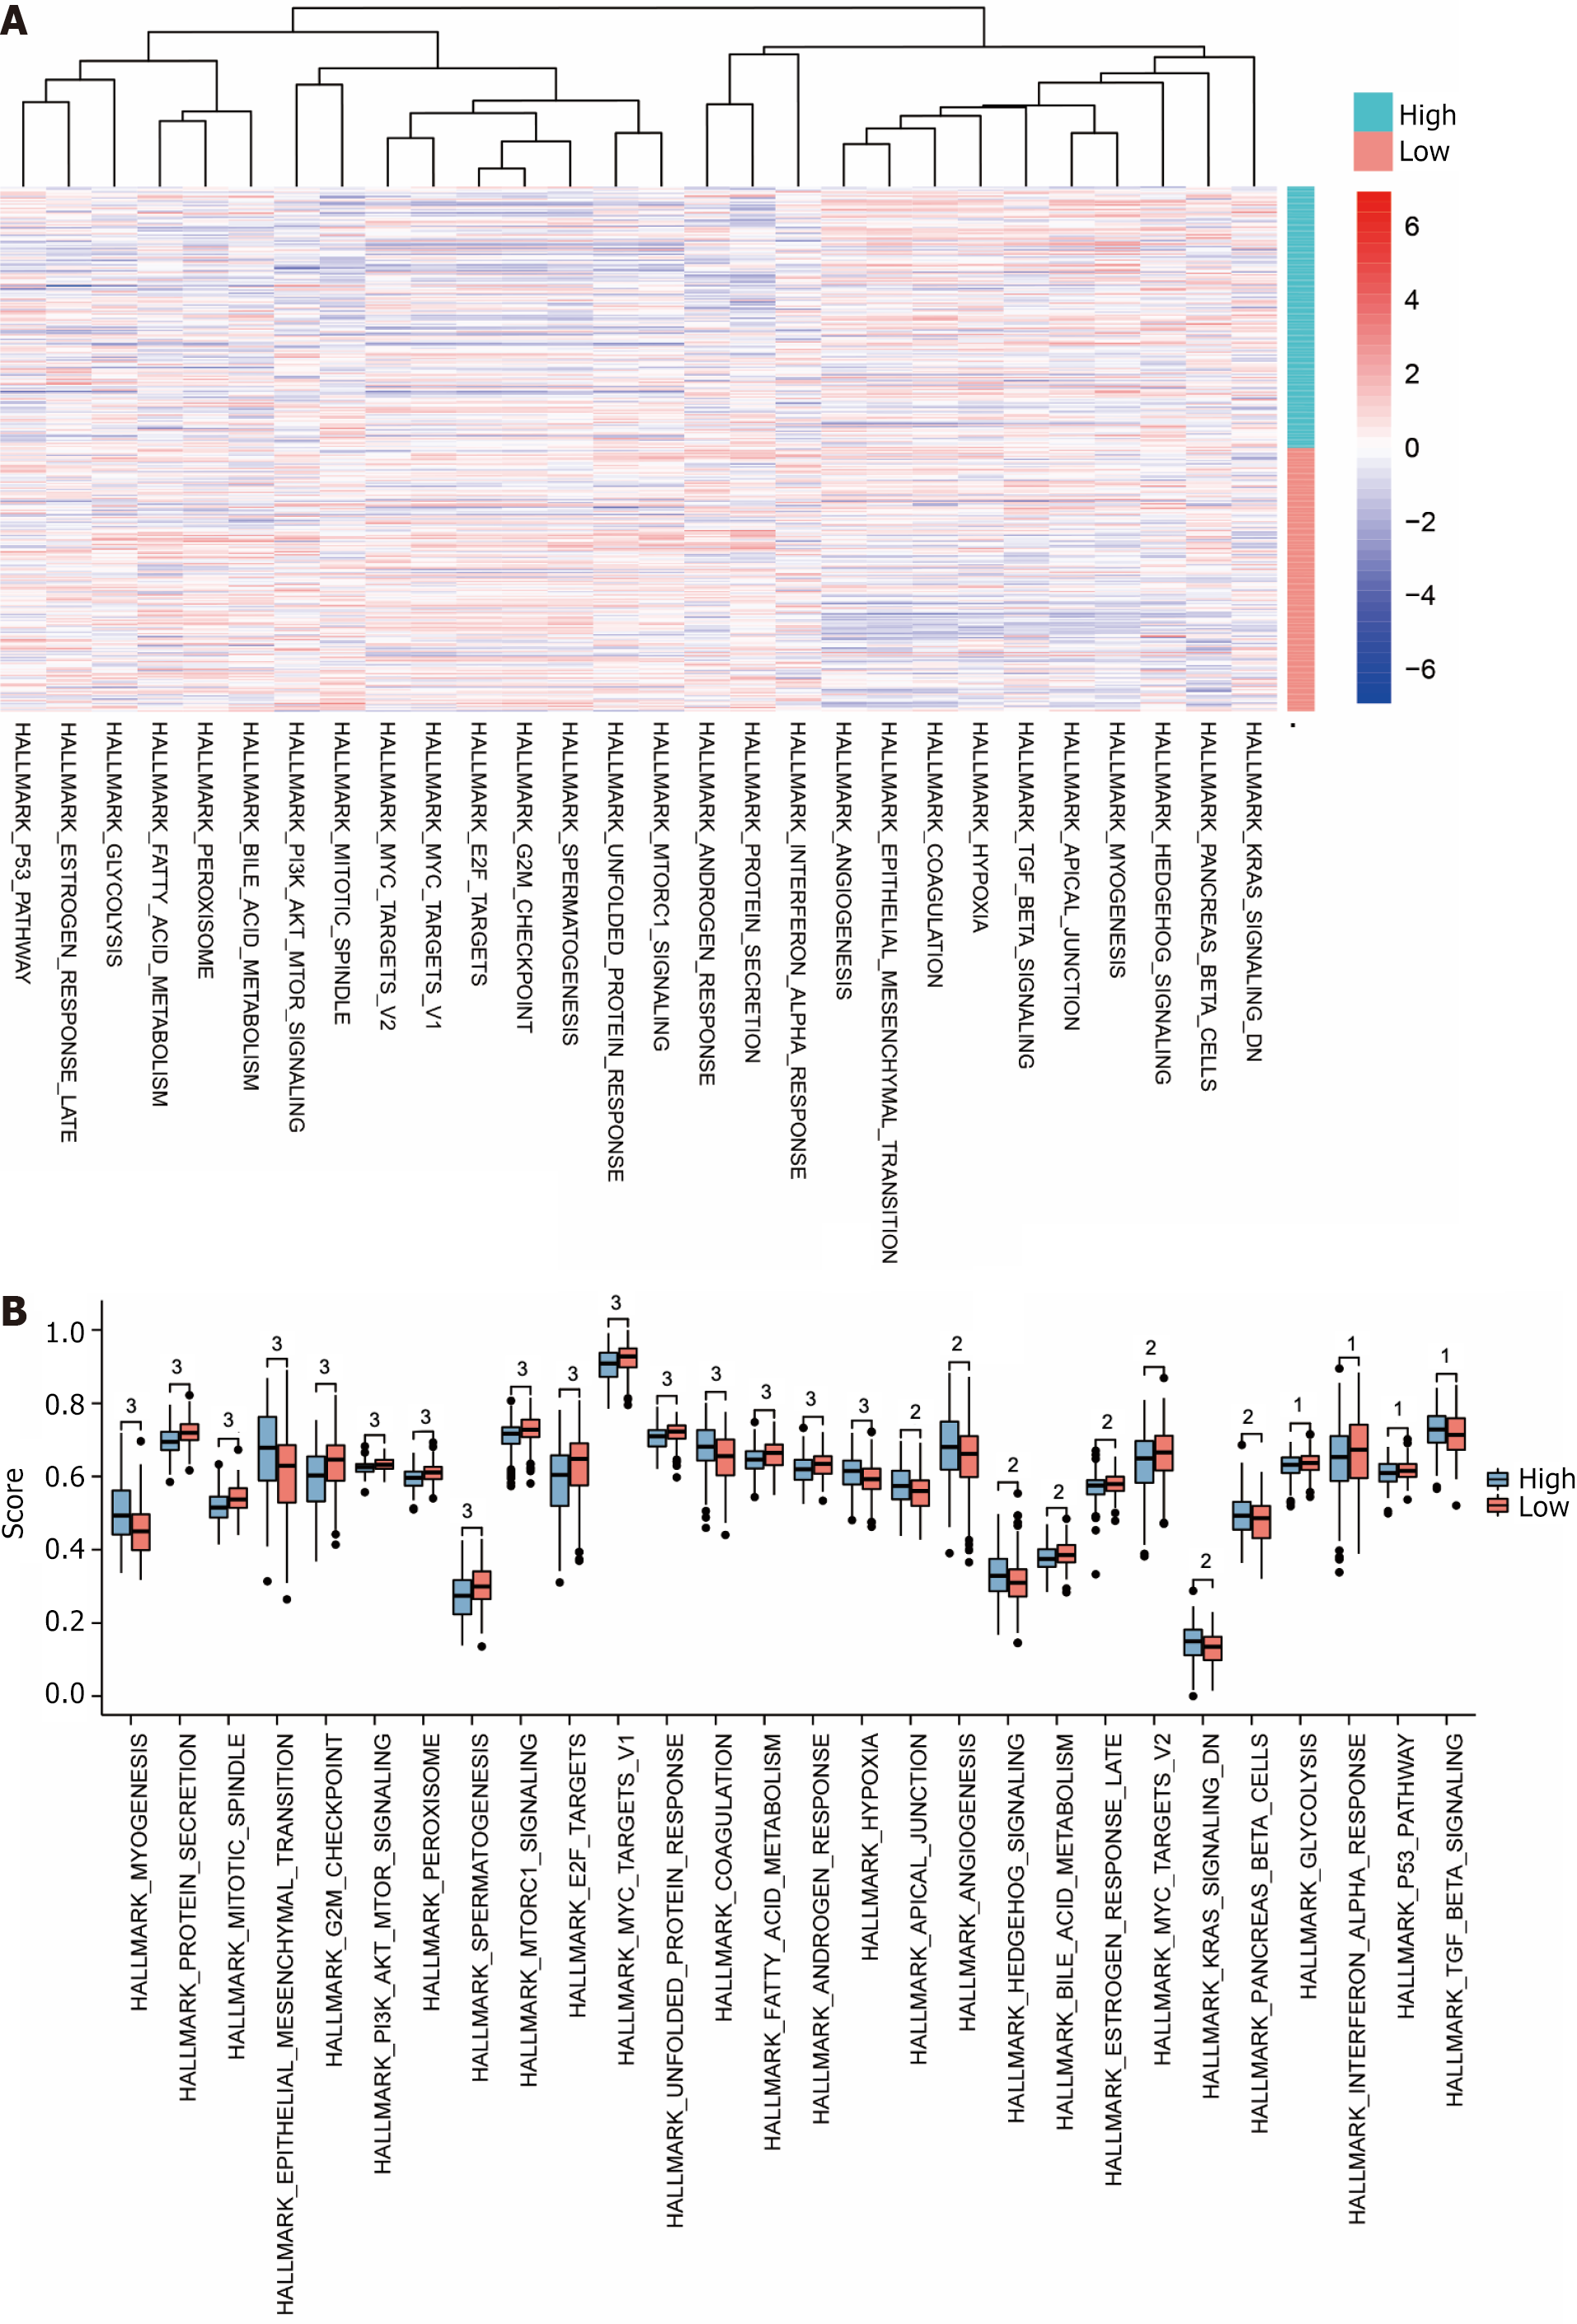
Figure 7 Visualisation of Gene Set Variation Analysis results.
A: Complex heat map of gene sets showing differences (P < 0.05) between datasets The Cancer Genome Atlas (TCGA)-stomach adenocarcinoma (STAD) high and low risk subgroups (subgroup: High and subgroup: Low); B: Subgroup comparison map of gene sets showing differences (P < 0.05) between datasets TCGA-STAD high and low risk subgroups (subgroup: High and subgroup: Low); C: Comparison of gene sets showing differences (P < 0.05) between datasets TCGA-STAD high and low risk subgroups (subgroup: High and subgroup: Low). Up: Up-regulated genes; Down: Down-regulated genes. 1P < 0.05, indicating statistical significance. 2P < 0.01, which is highly statistically significant. 3P < 0.001 and highly statistically significant.
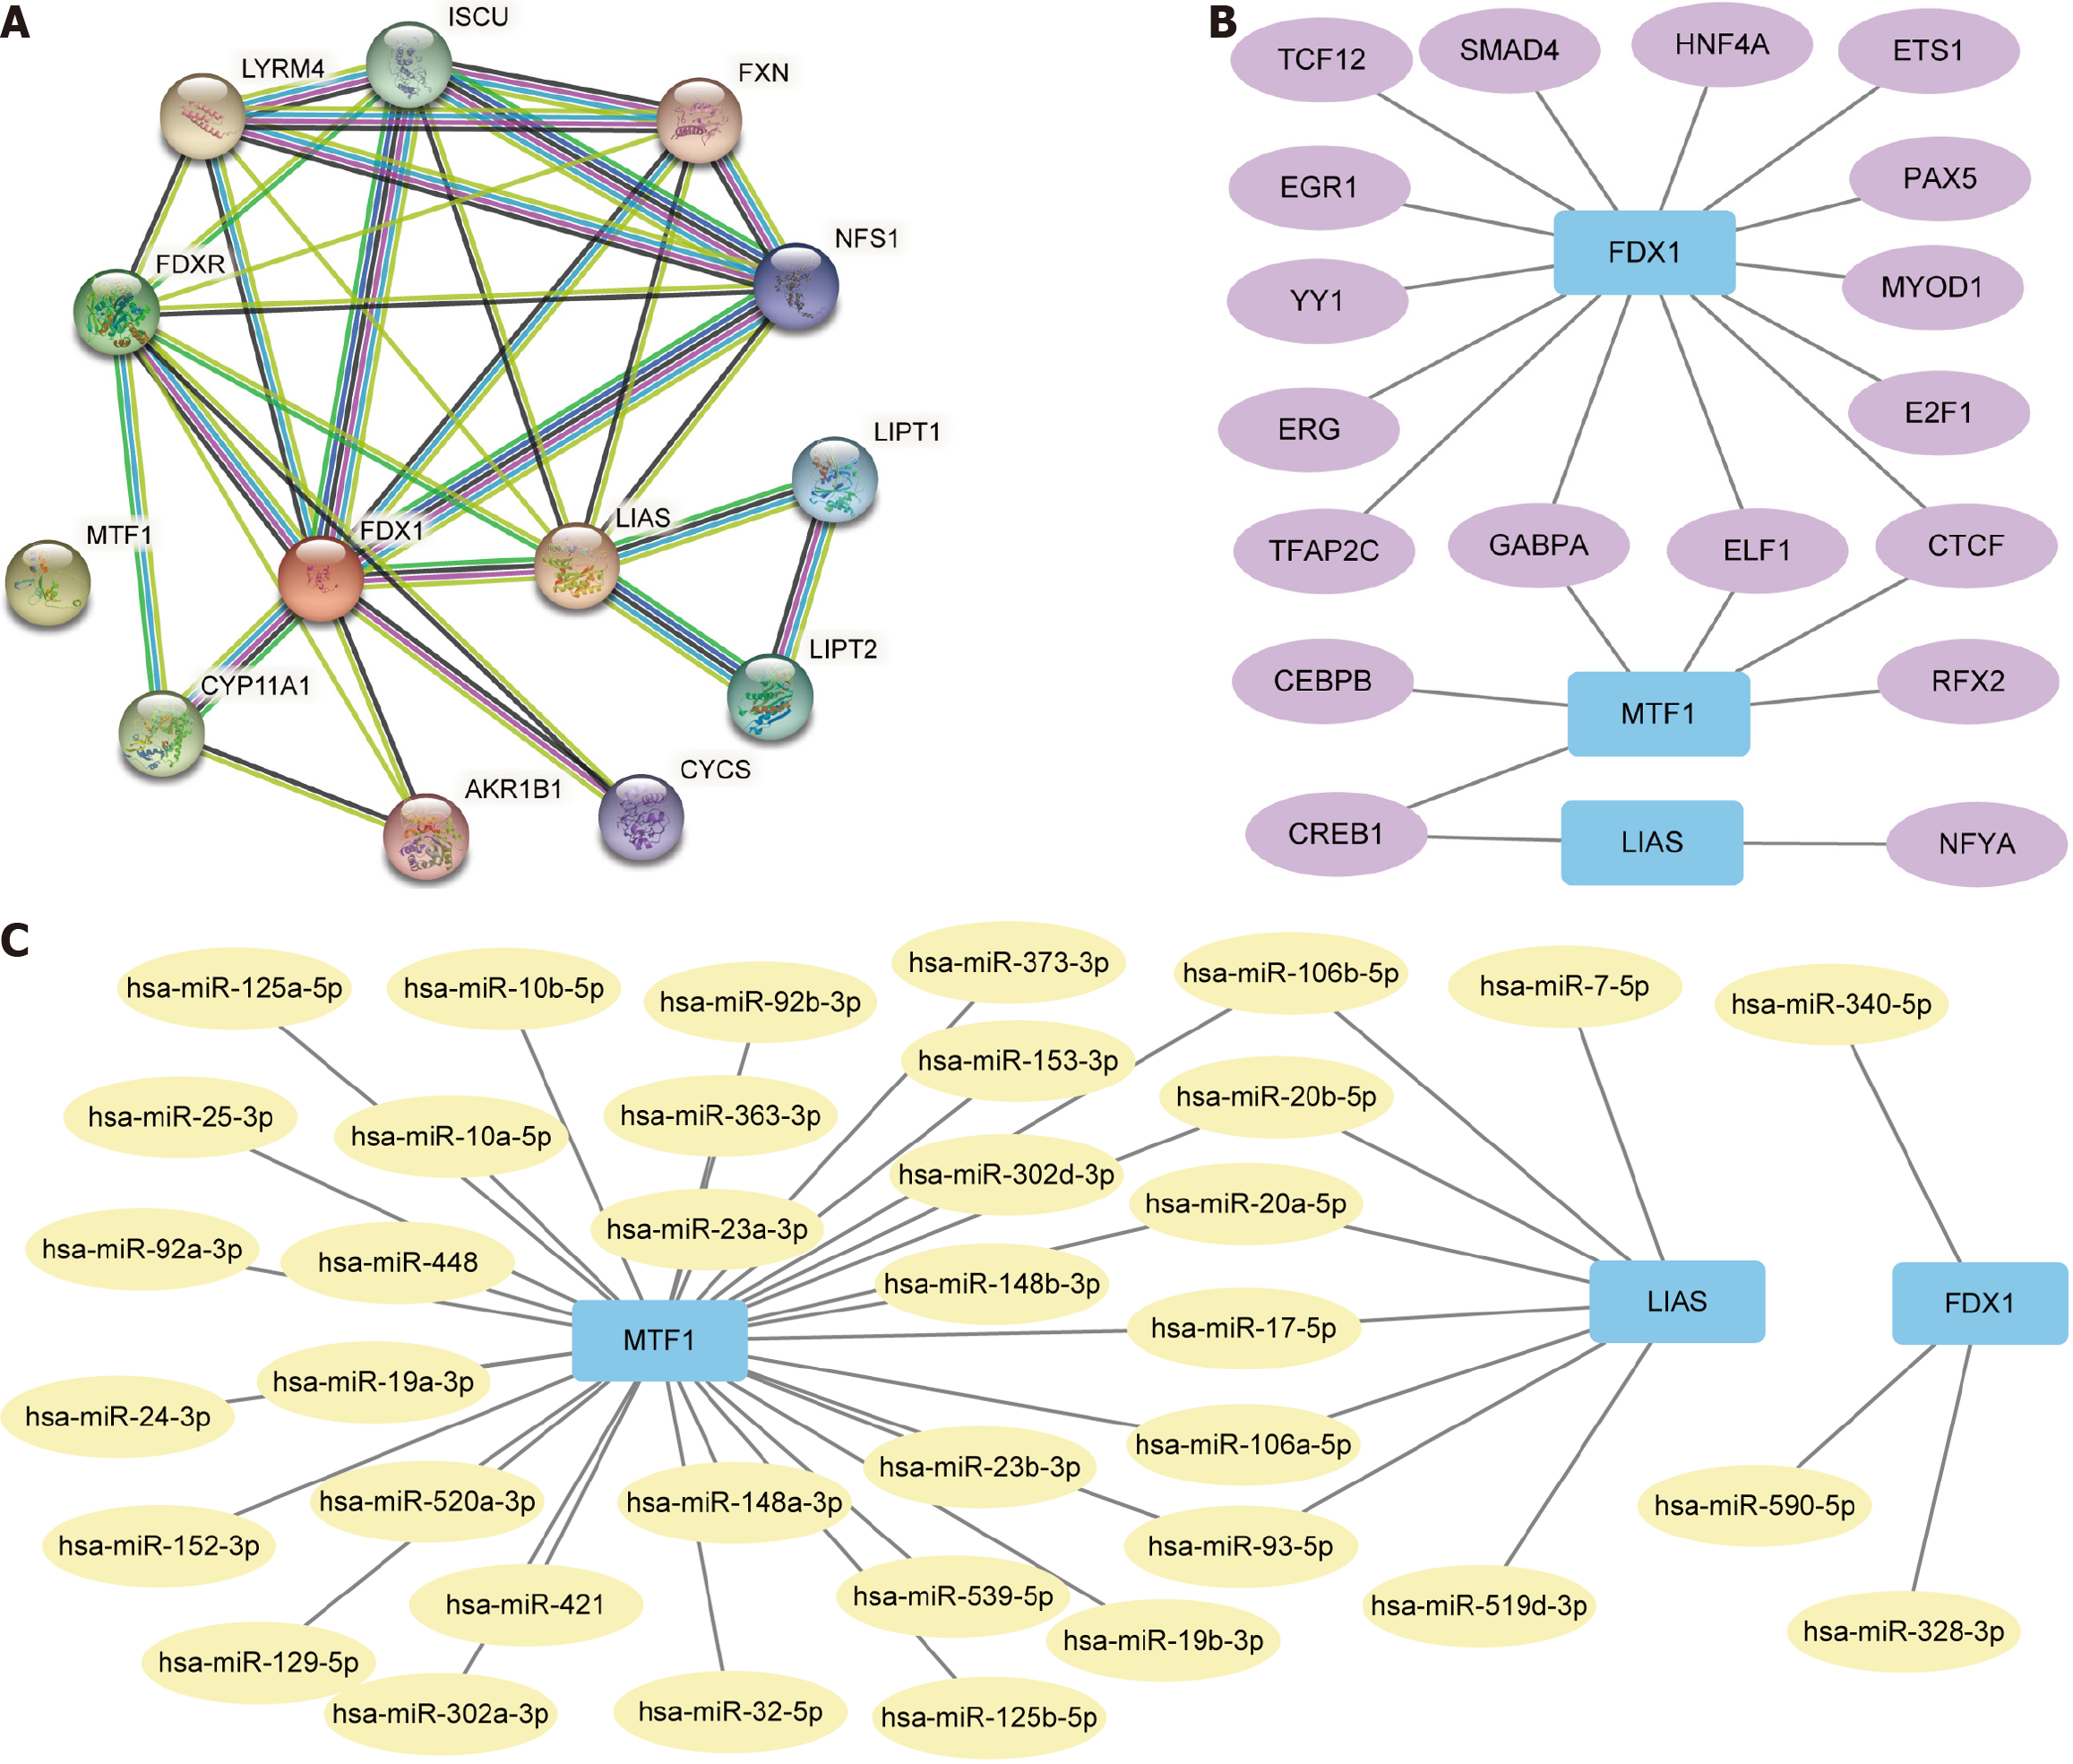
Figure 8 Construction of protein-protein interaction, mRNA-miRNA, and mRNA-transcription factor interactions networks.
A: protein-protein interaction network of differentially expressed genes (DEGs) connected with copper death prognosis; B: mRNA-transcription factor (TF) interaction network of DEGs related to copper death prognosis and TF; C: mRNA-miRNA interaction network of DEGs linked with copper death prognosis and miRNA. Blue rectangles are mRNA molecules. Yellow circles are miRNA molecules. Purple circles are TF.
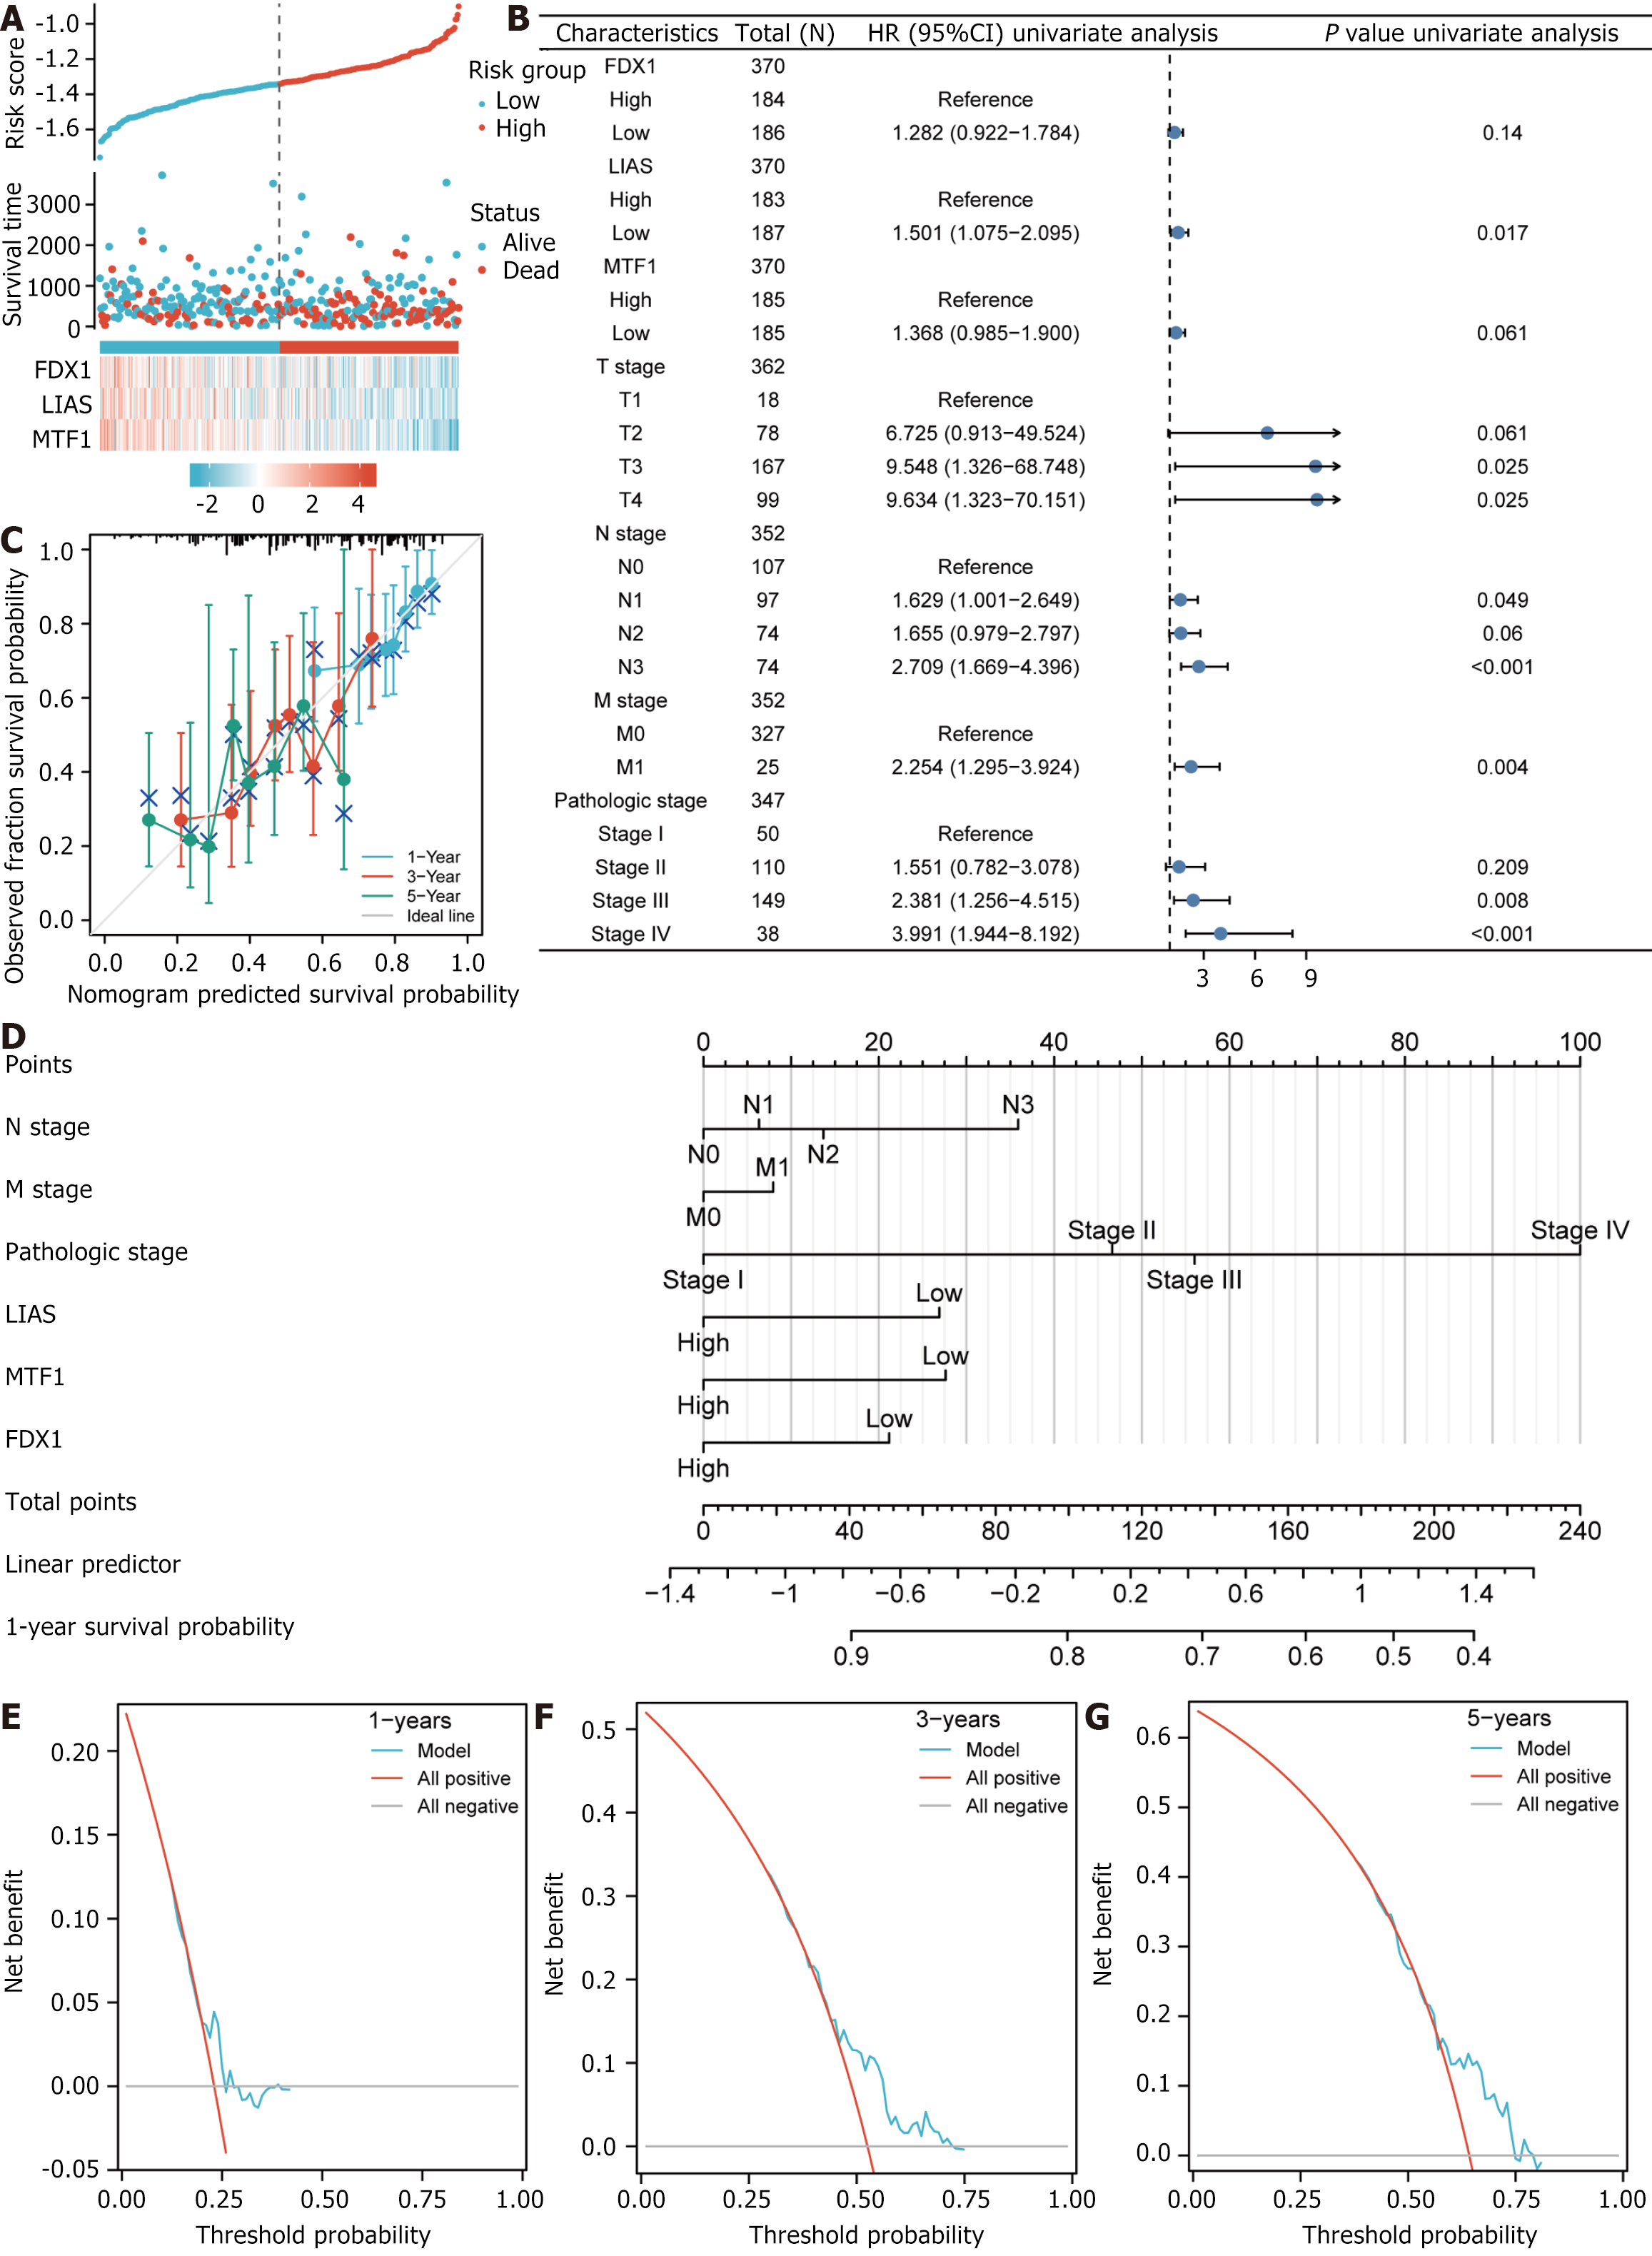
Figure 9 Prognostic analysis and performance of predictive differentially expressed genes.
A: Risk factor plot; B: Forest plot for univaiate Cox regression analysis of differentially expressed genes for copper death prognosis; C: 1-, 3- and 5-year calibration curve plots; D: Nomogram; E: 1-year decision curve analysis (DCA) plot for Least Absolute Shrinkage and Selection Operator (LASSO) regression prognosis model; F: 3-year DCA plot for LASSO regression prognosis model; G: 5-year DCA plot for LASSO regression prognosis model.
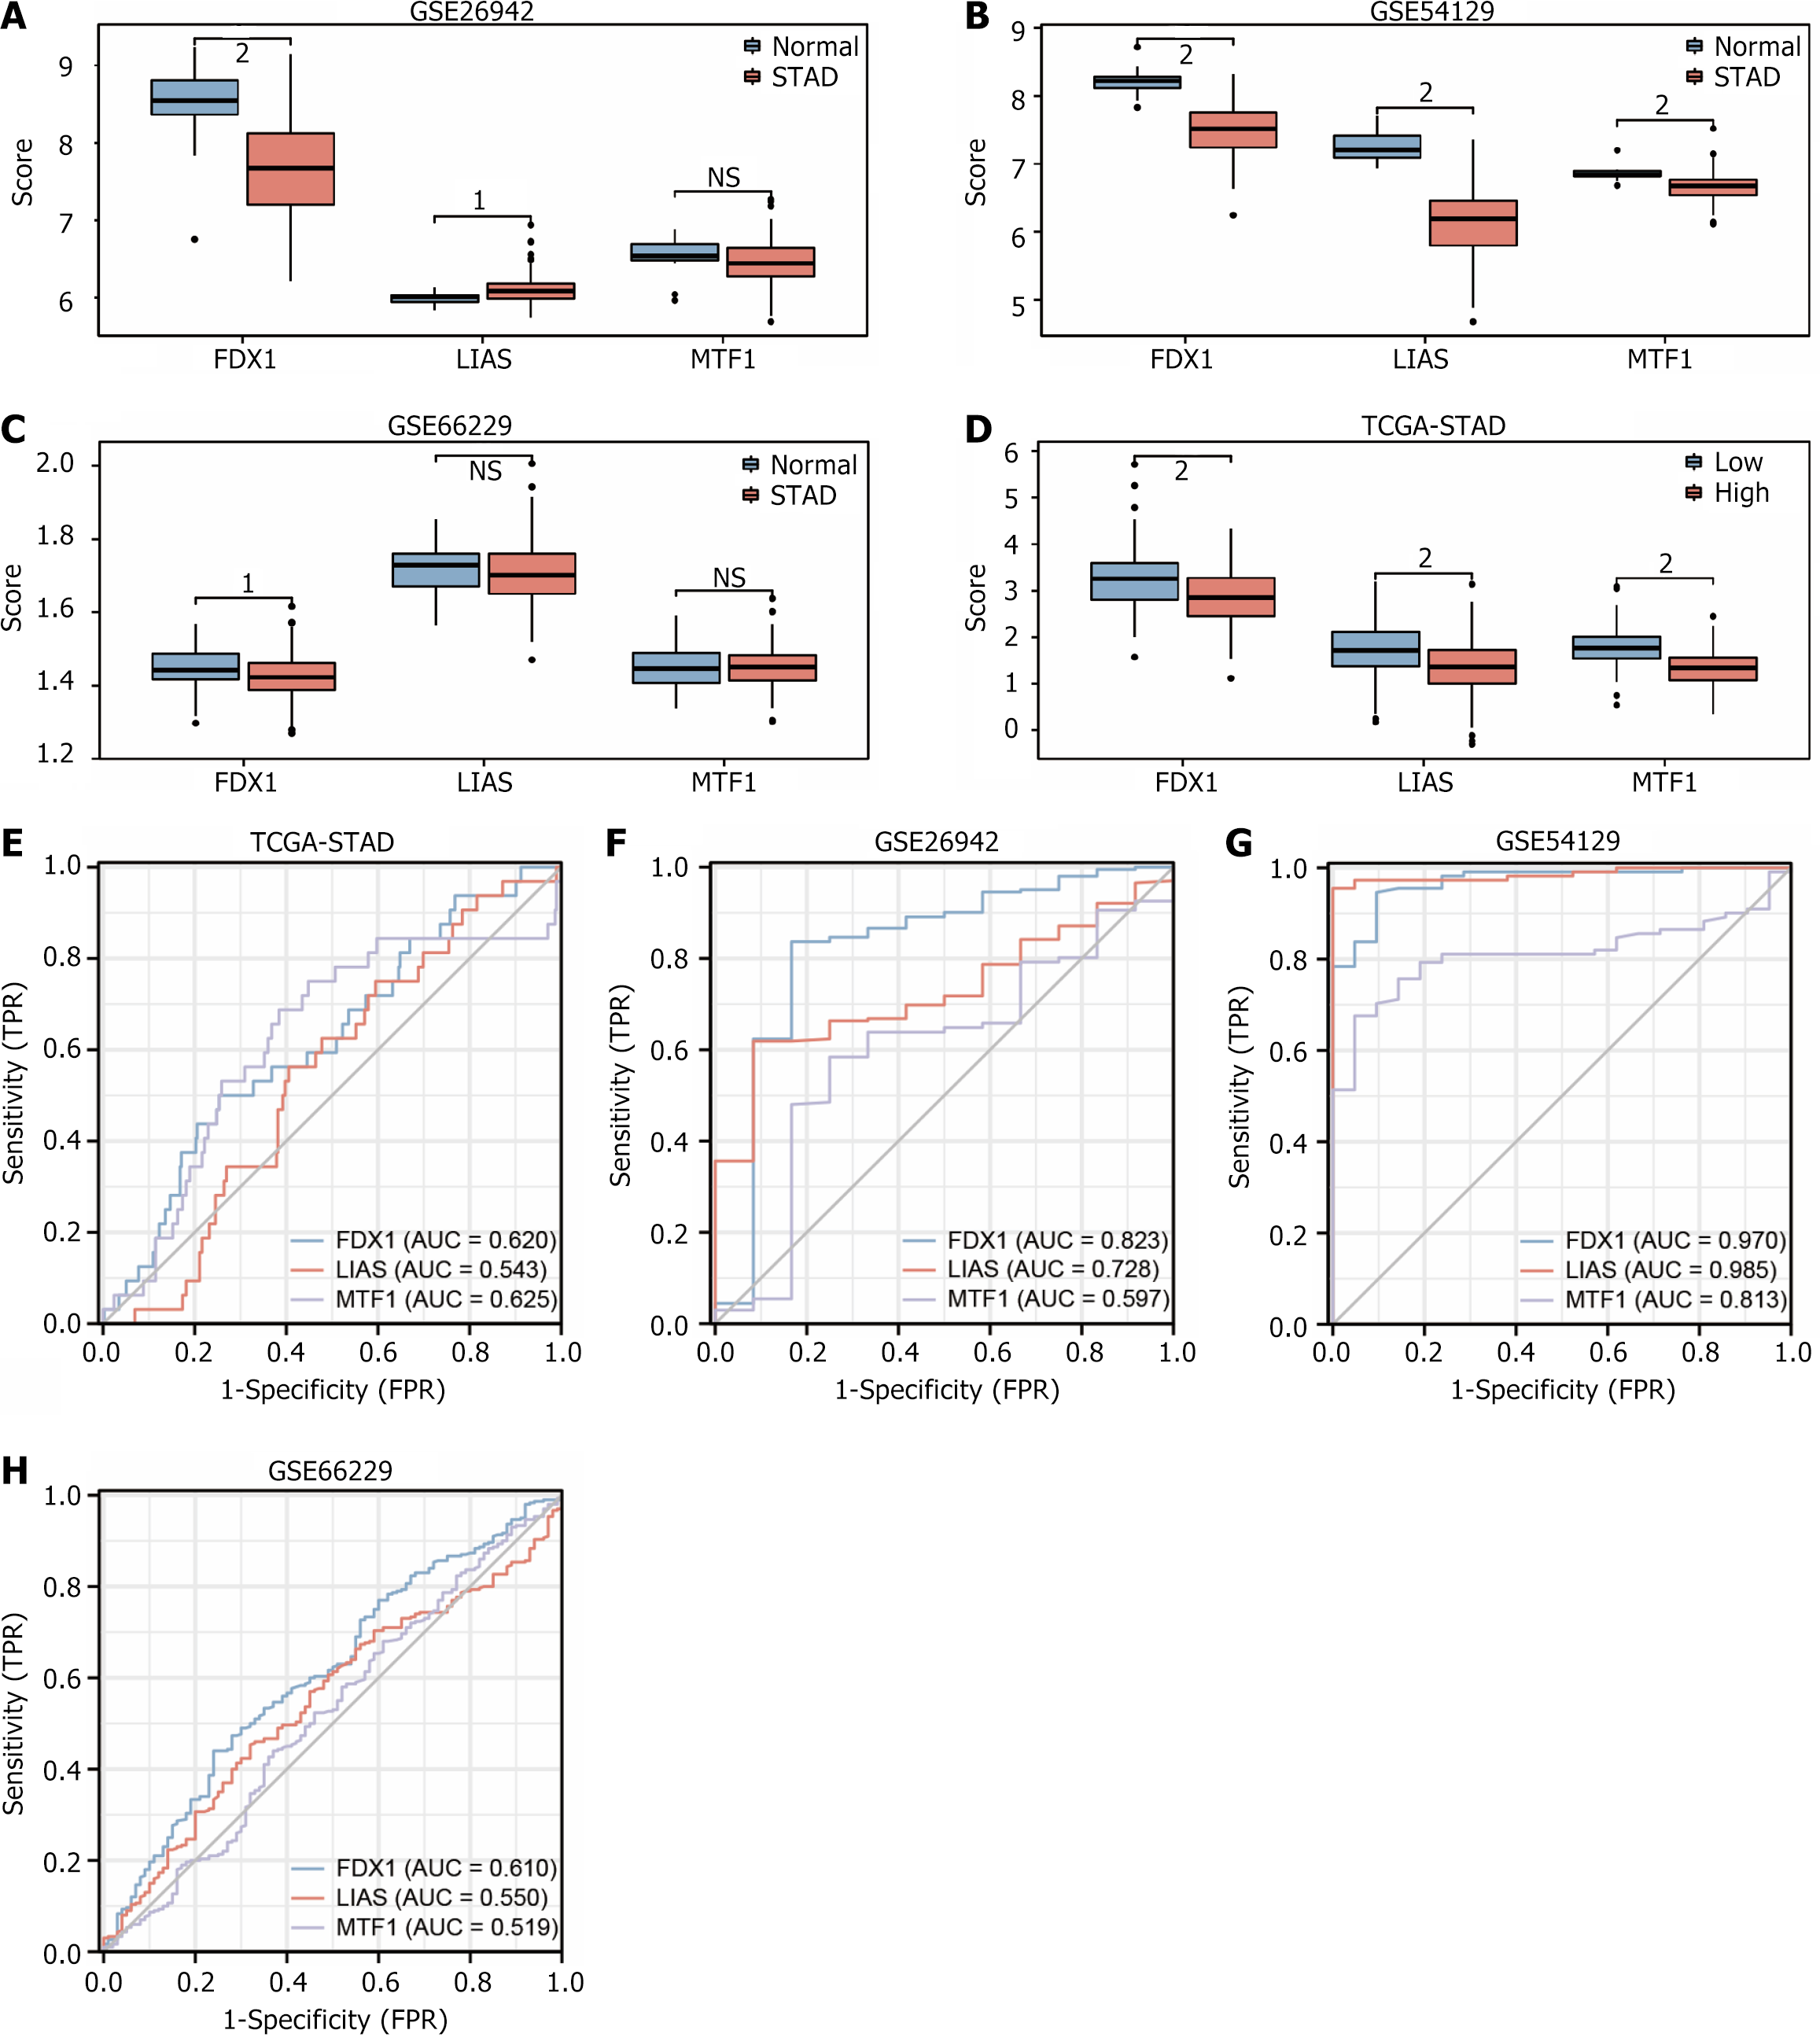
Figure 10 Expression and receiver operating characteristic curve validation of the The Gene Expression Omnibus dataset for prognosis-related differentially expressed genes.
A: Expression validation plot of gene FDX1, LIAS, MTF1 in data set GSE26942; B: Expression validation plot of gene FDX1, LIAS, MTF1 in data set GSE54129; C: Expression validation plot of gene FDX1, LIAS, MTF1 in data set GSE66229; D: Expression validation plot of gene FDX1, LIAS, MTF1 in data set The Cancer Genome Atlas (TCGA)-stomach adenocarcinoma (STAD). MTF1 expression validation plot in dataset TCGA-STAD; E: Receiver operating characteristic curves (ROCs) for gene FDX1, LIAS, MTF1 in dataset GSE26942; F: ROC validation of gene FDX1, LIAS, MTF1 in dataset GSE54129; G: ROC curves for gene FDX1, LIAS, MTF1 in dataset ROC validation in dataset GSE66229; H: ROC validation of gene FDX1, LIAS, MTF1 in dataset TCGA-STAD; I: ROC validation of gene FDX1, LIAS, MTF1 in dataset TCGA-STAD. Up: Up-regulated genes; Down: Down-regulated genes; AUC: Aera under the curve. 1P < 0.01, which is highly statistically significant. 2P < 0.001 and highly statistically significant.
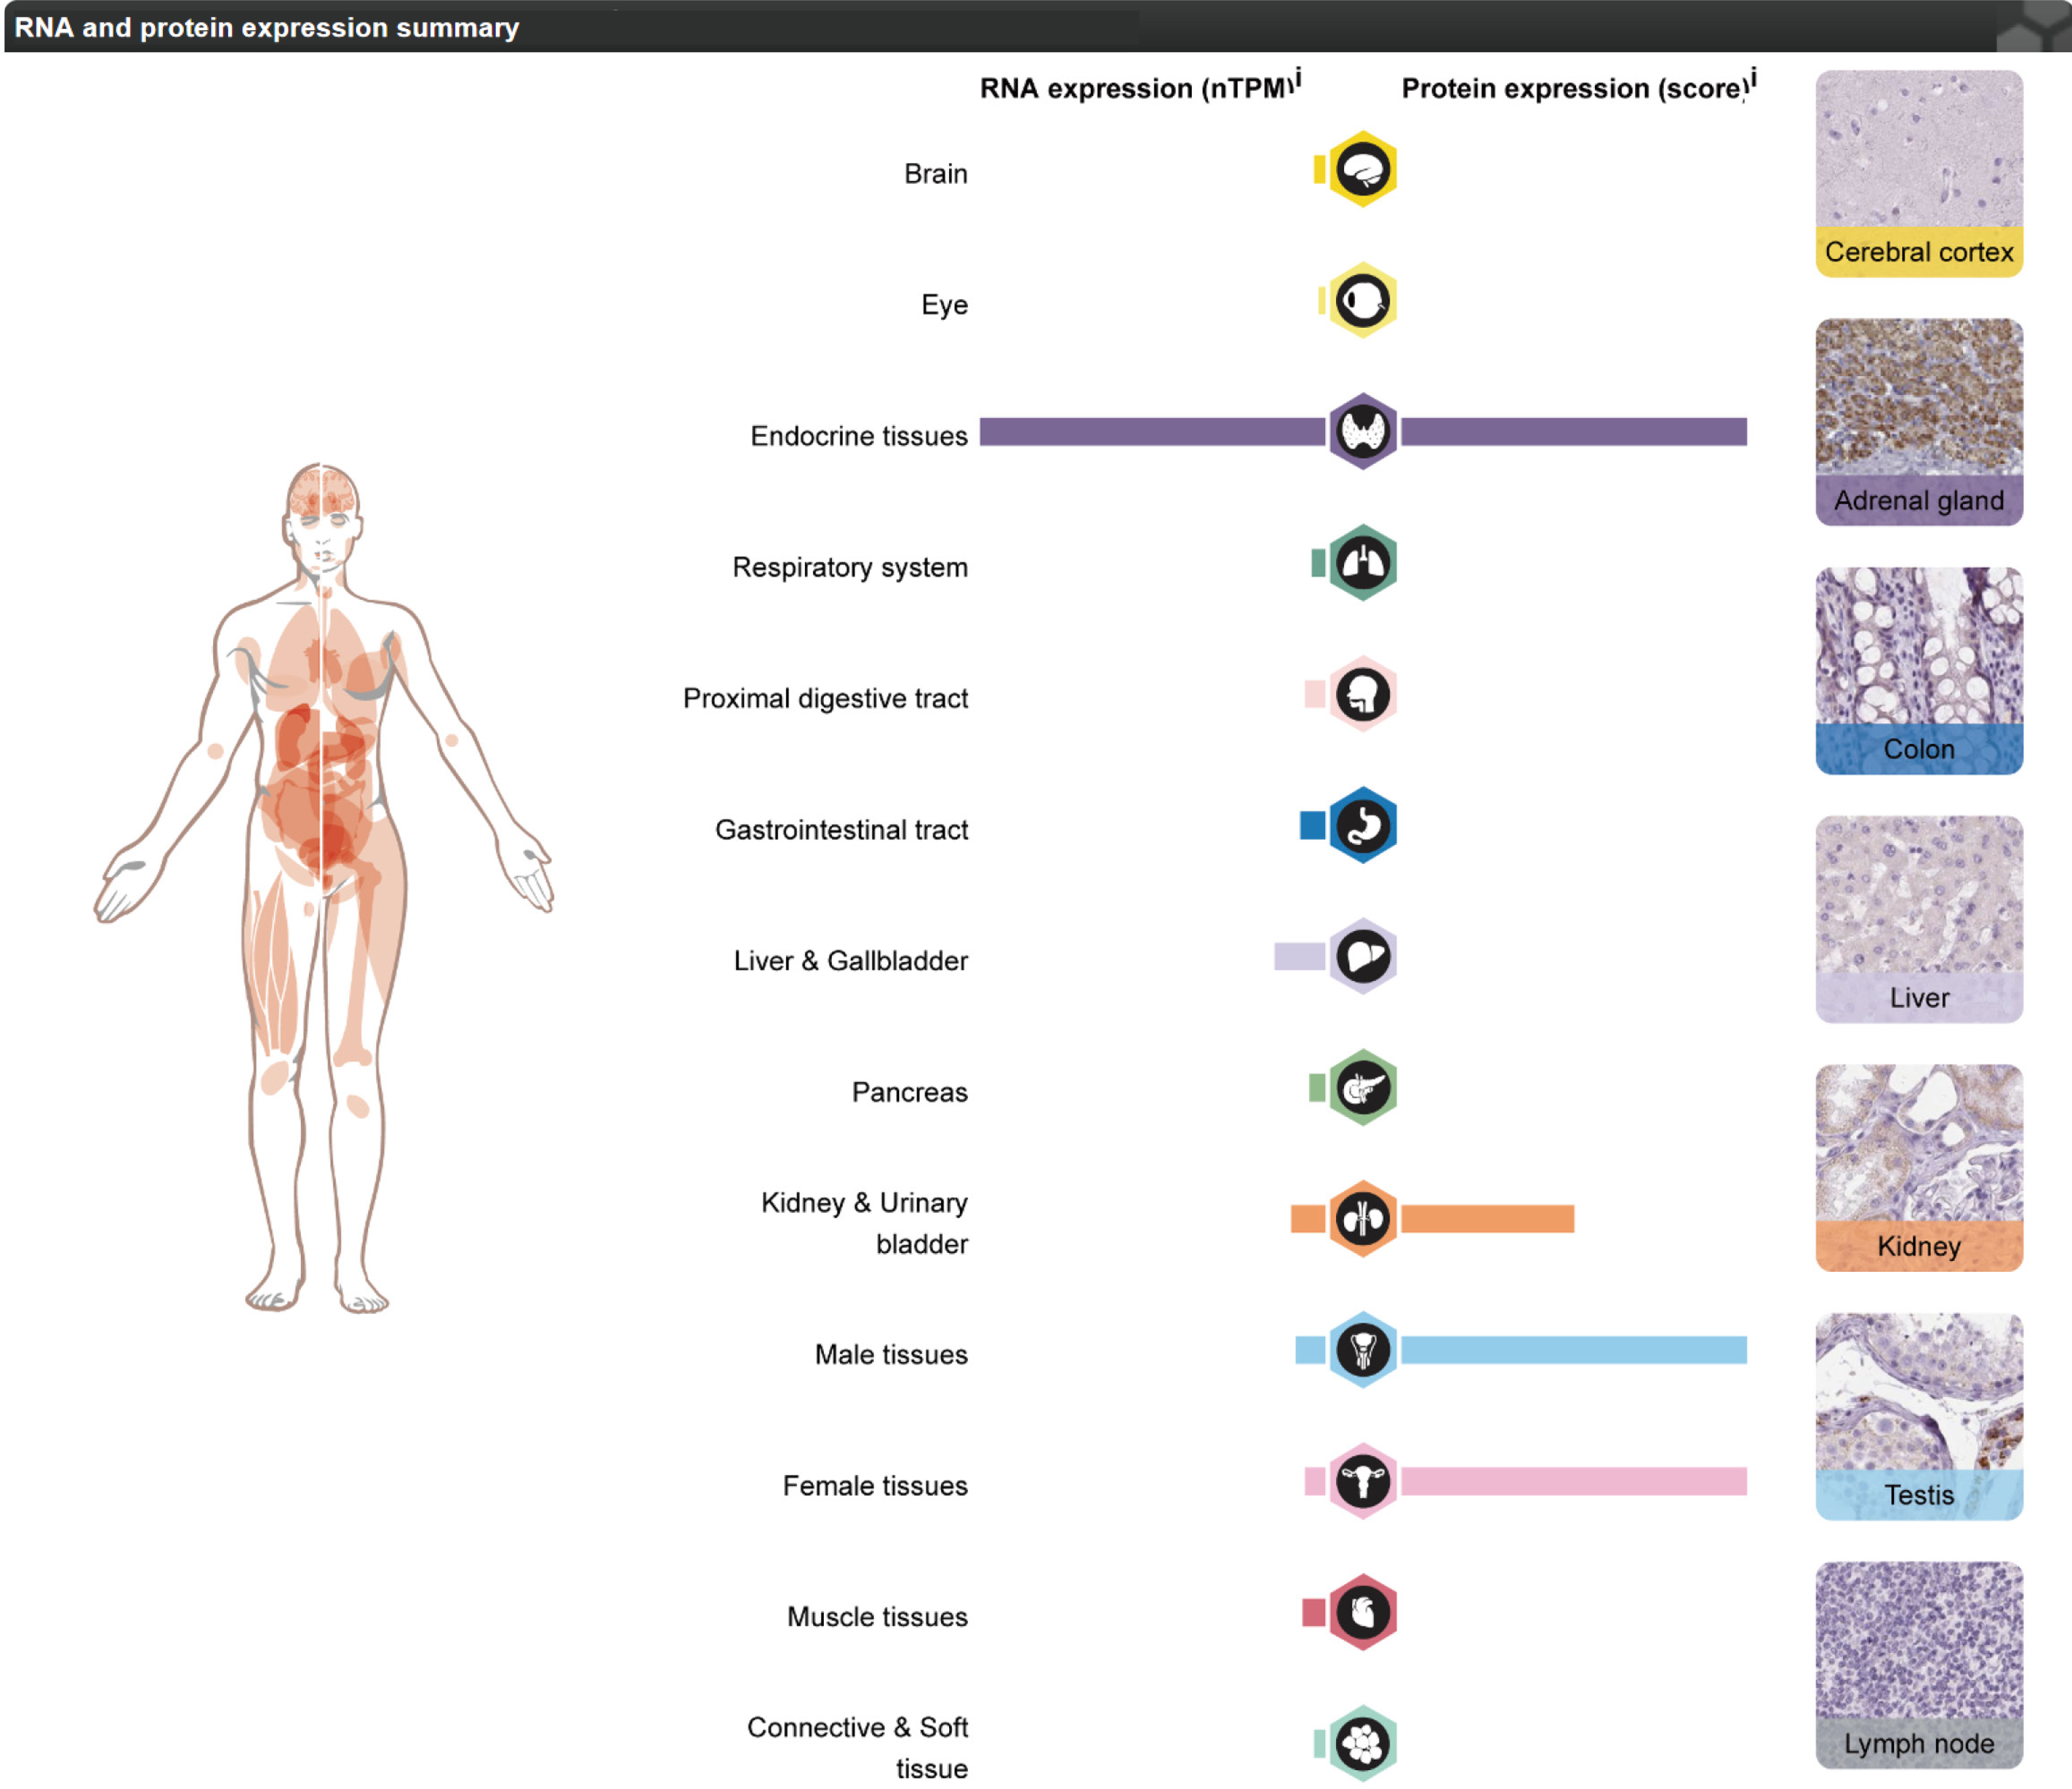
Figure 11 Expression of gene FDX1 in different human tissues.
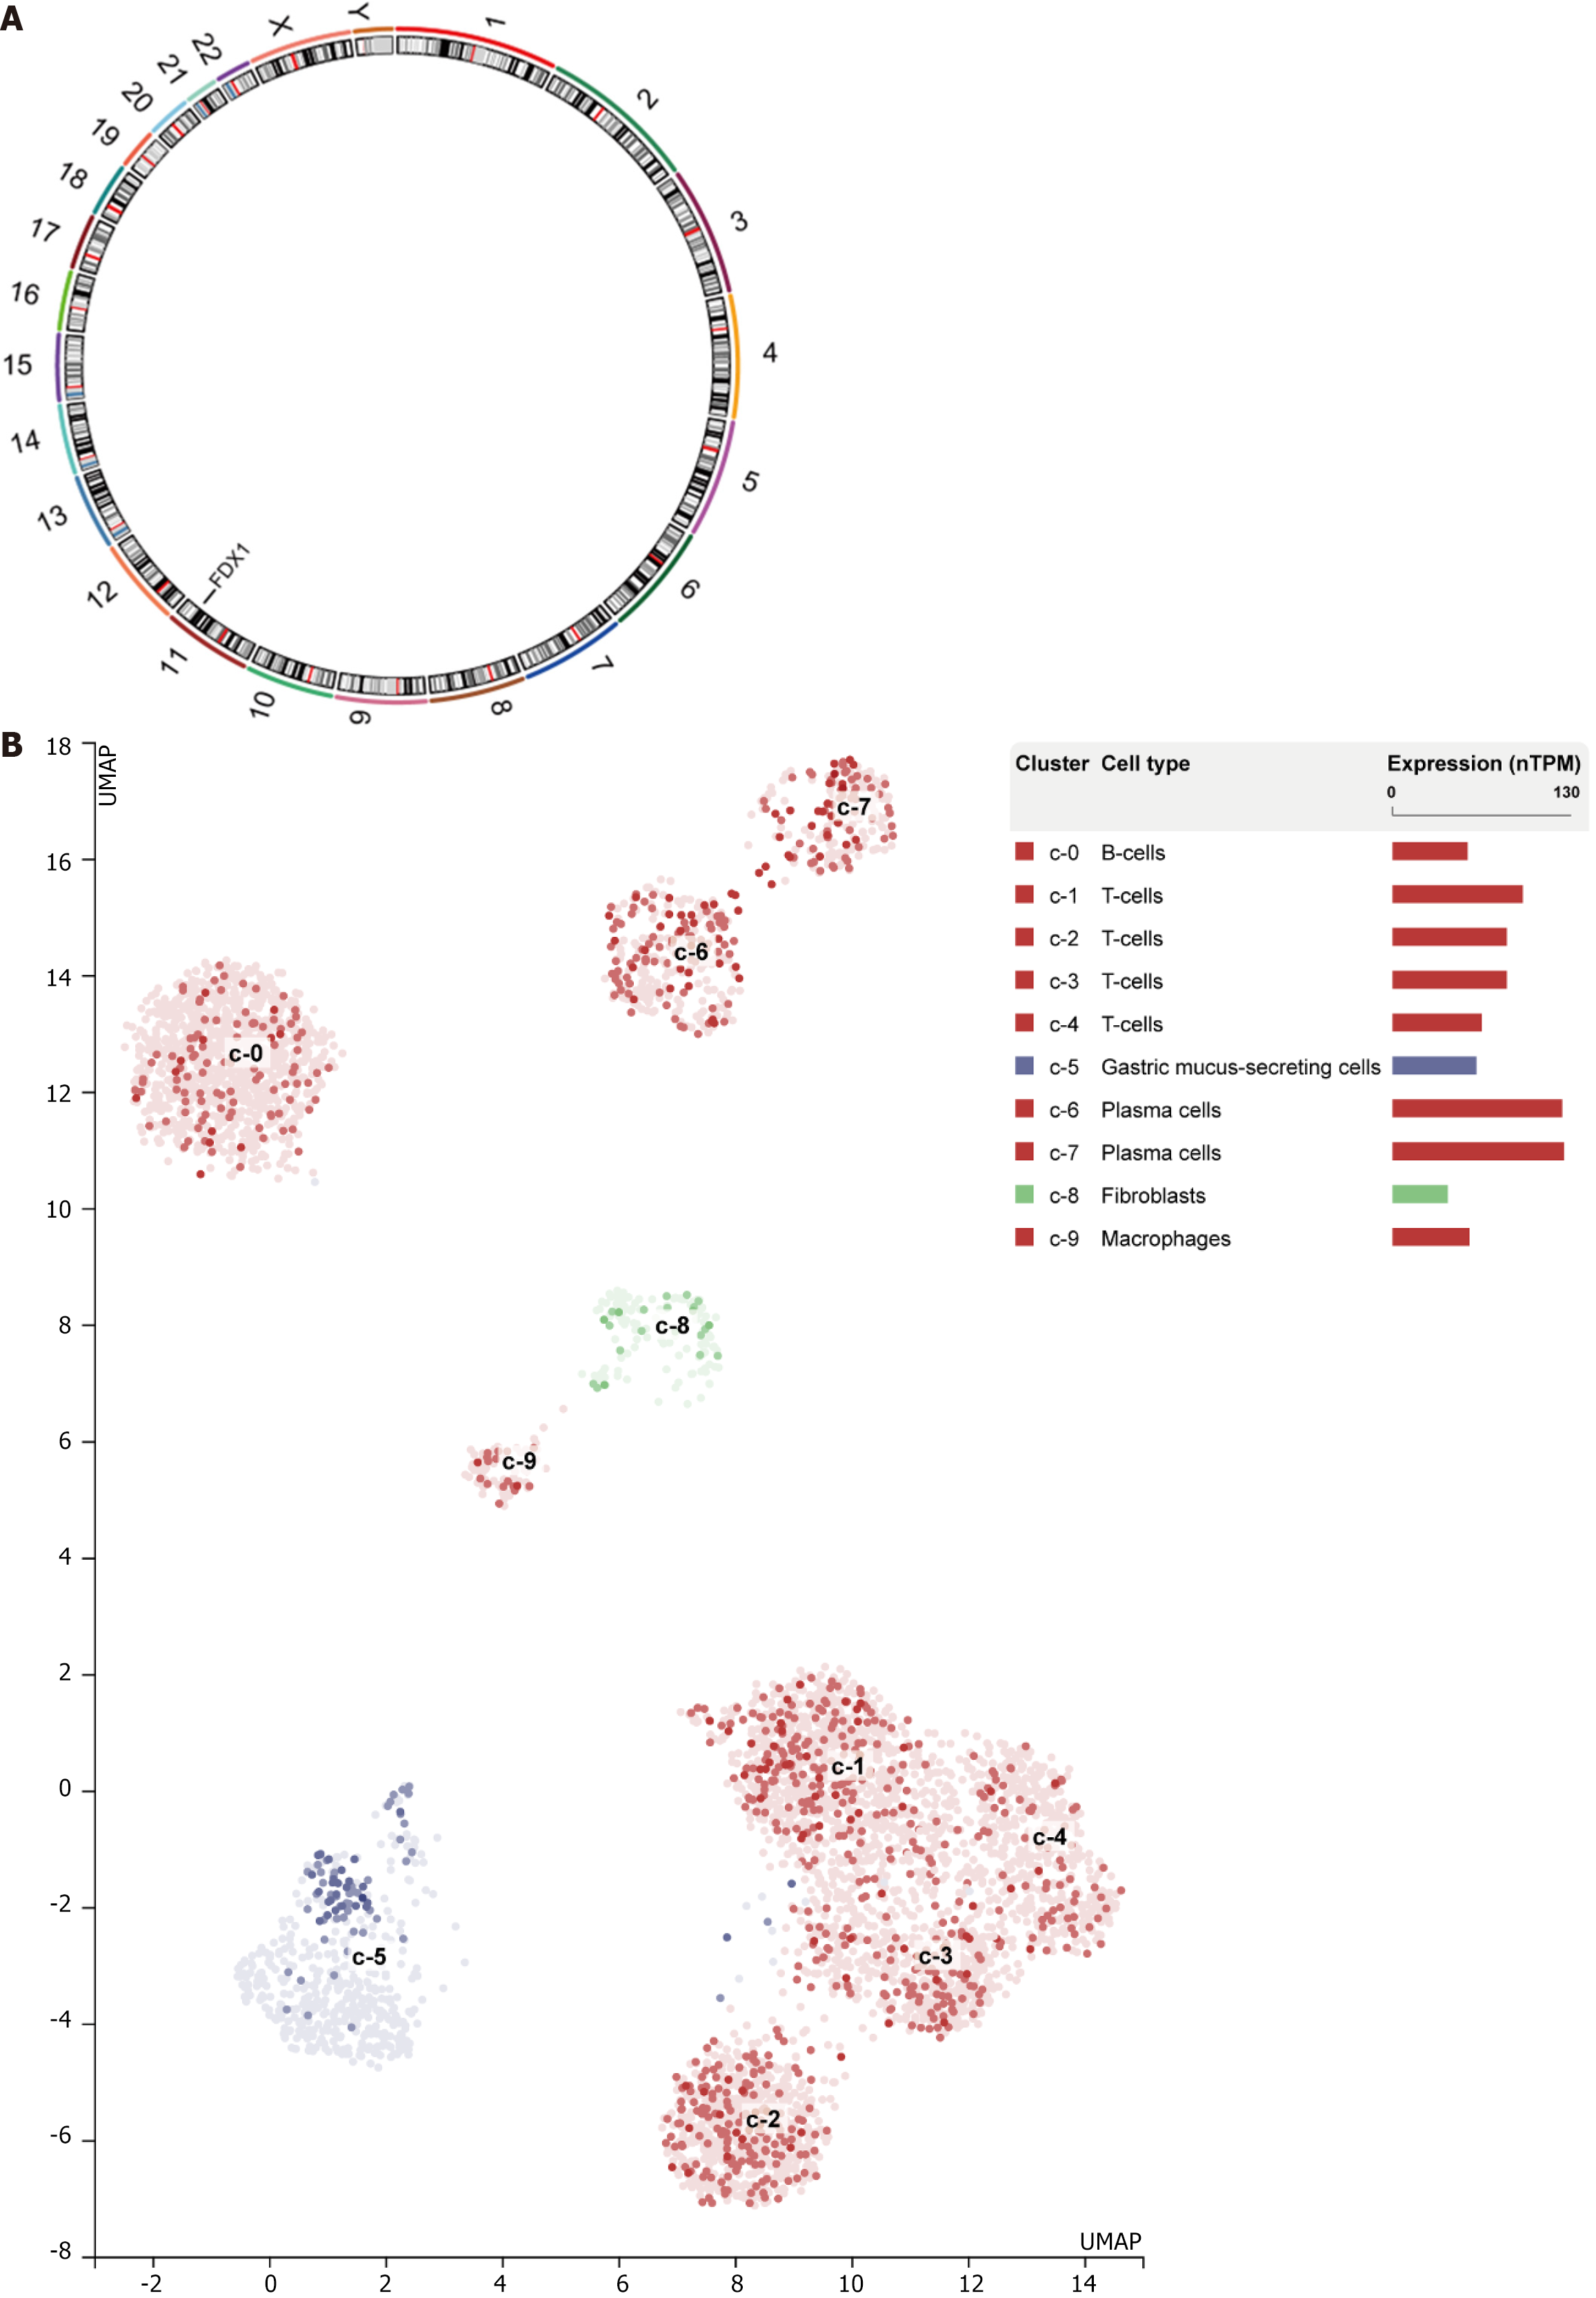
Figure 12 Expression and chromosomal localization of the gene FDX1 in different single cell subpopulations of gastric cancer.
A: Gene FDX1 expression in gastric malignancy cell lines; B: Gene FDX1 Localization in chromosomes.
- Citation: Xie XZ, Zuo L, Huang W, Fan QM, Weng YY, Yao WD, Jiang JL, Jin JQ. FDX1 as a novel biomarker and treatment target for stomach adenocarcinoma. World J Gastrointest Surg 2024; 16(6): 1803-1824
- URL: https://www.wjgnet.com/1948-9366/full/v16/i6/1803.htm
- DOI: https://dx.doi.org/10.4240/wjgs.v16.i6.1803


