Copyright
©The Author(s) 2024.
World J Gastrointest Surg. Jun 27, 2024; 16(6): 1791-1802
Published online Jun 27, 2024. doi: 10.4240/wjgs.v16.i6.1791
Published online Jun 27, 2024. doi: 10.4240/wjgs.v16.i6.1791
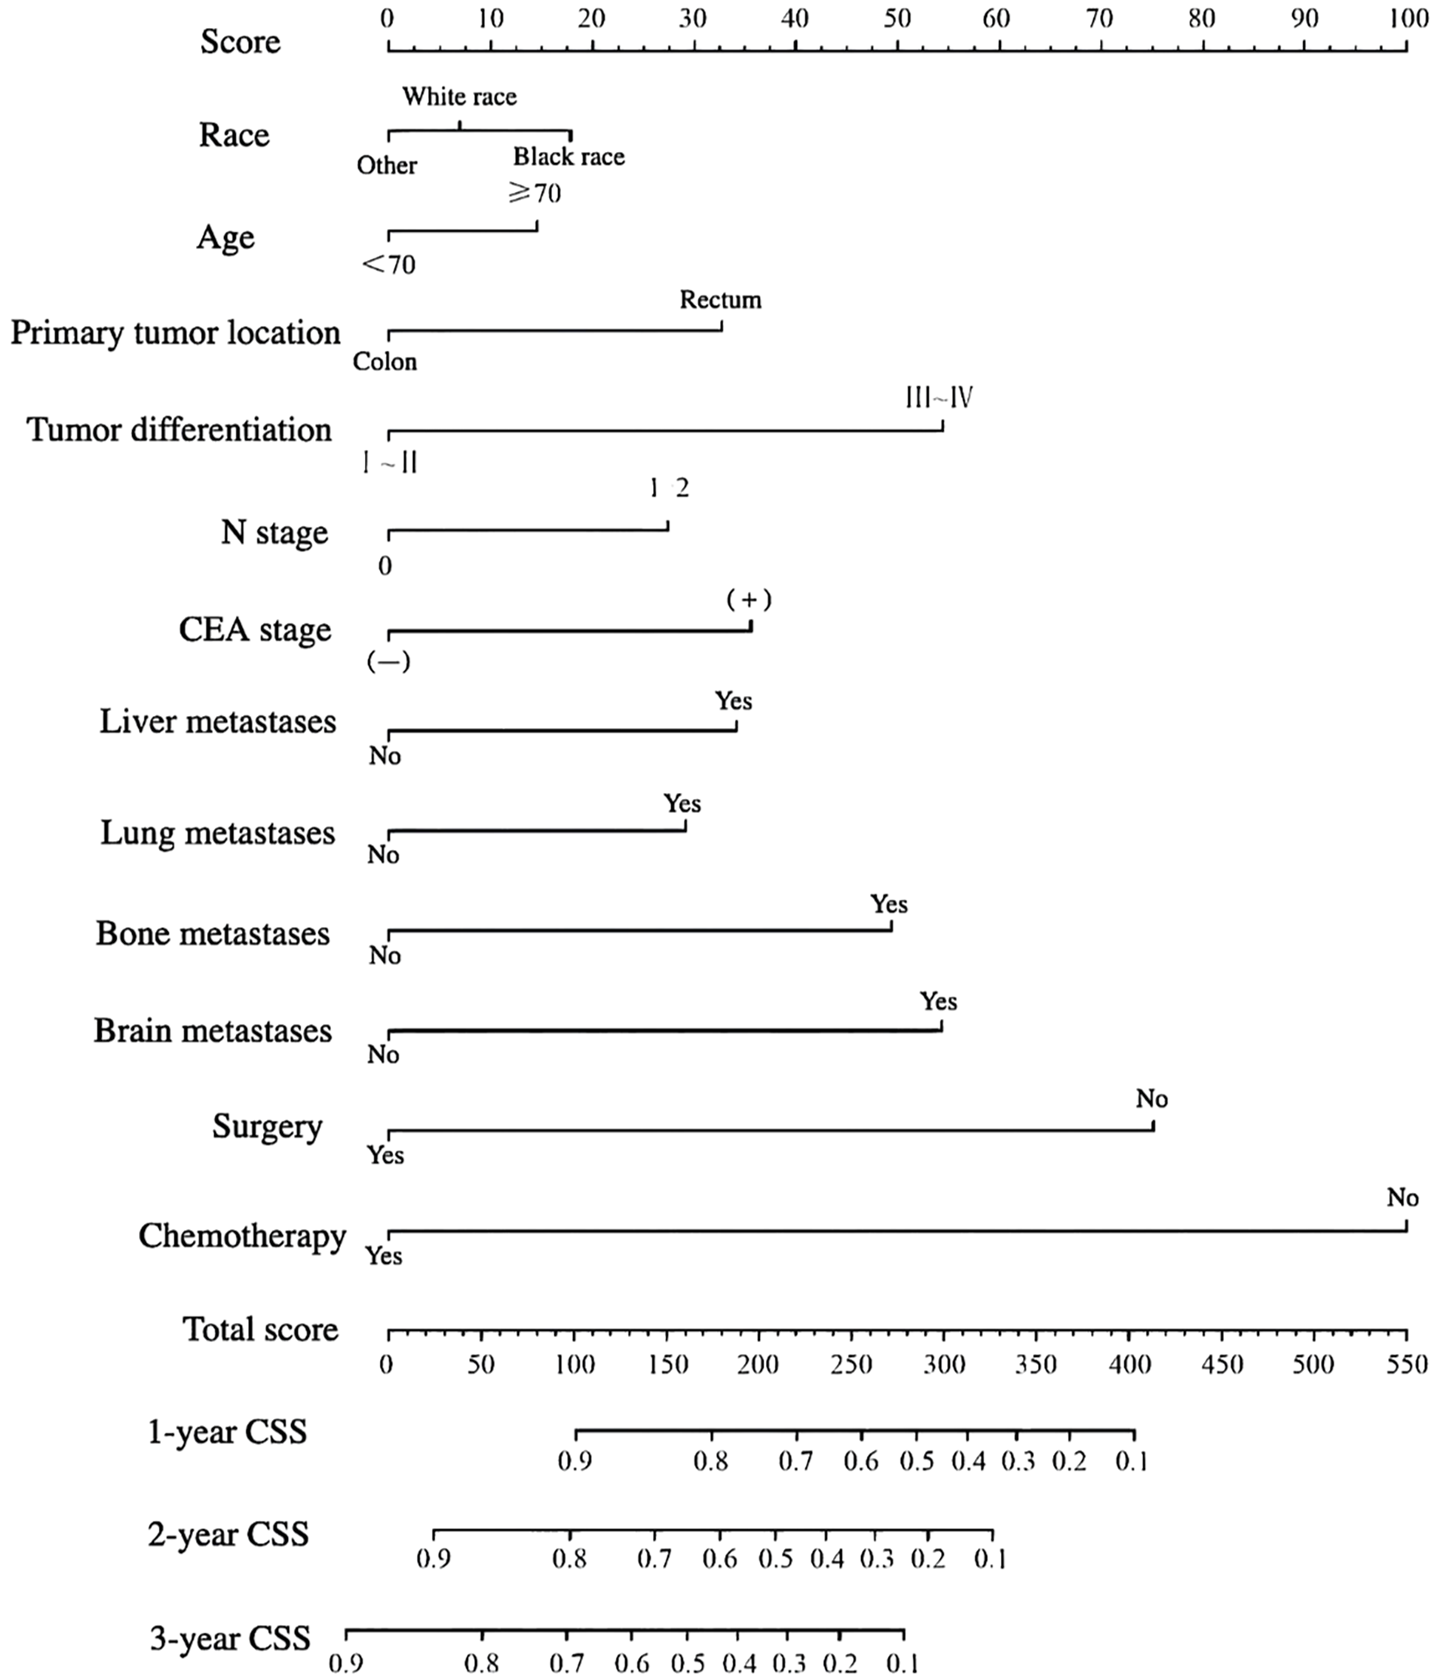
Figure 1 Nomogram for predicting the tumor-specific survival of patients with metastatic colorectal cancer.
CEA: Carcinoembryonic antigen; CSS: Cancer-specific survival.
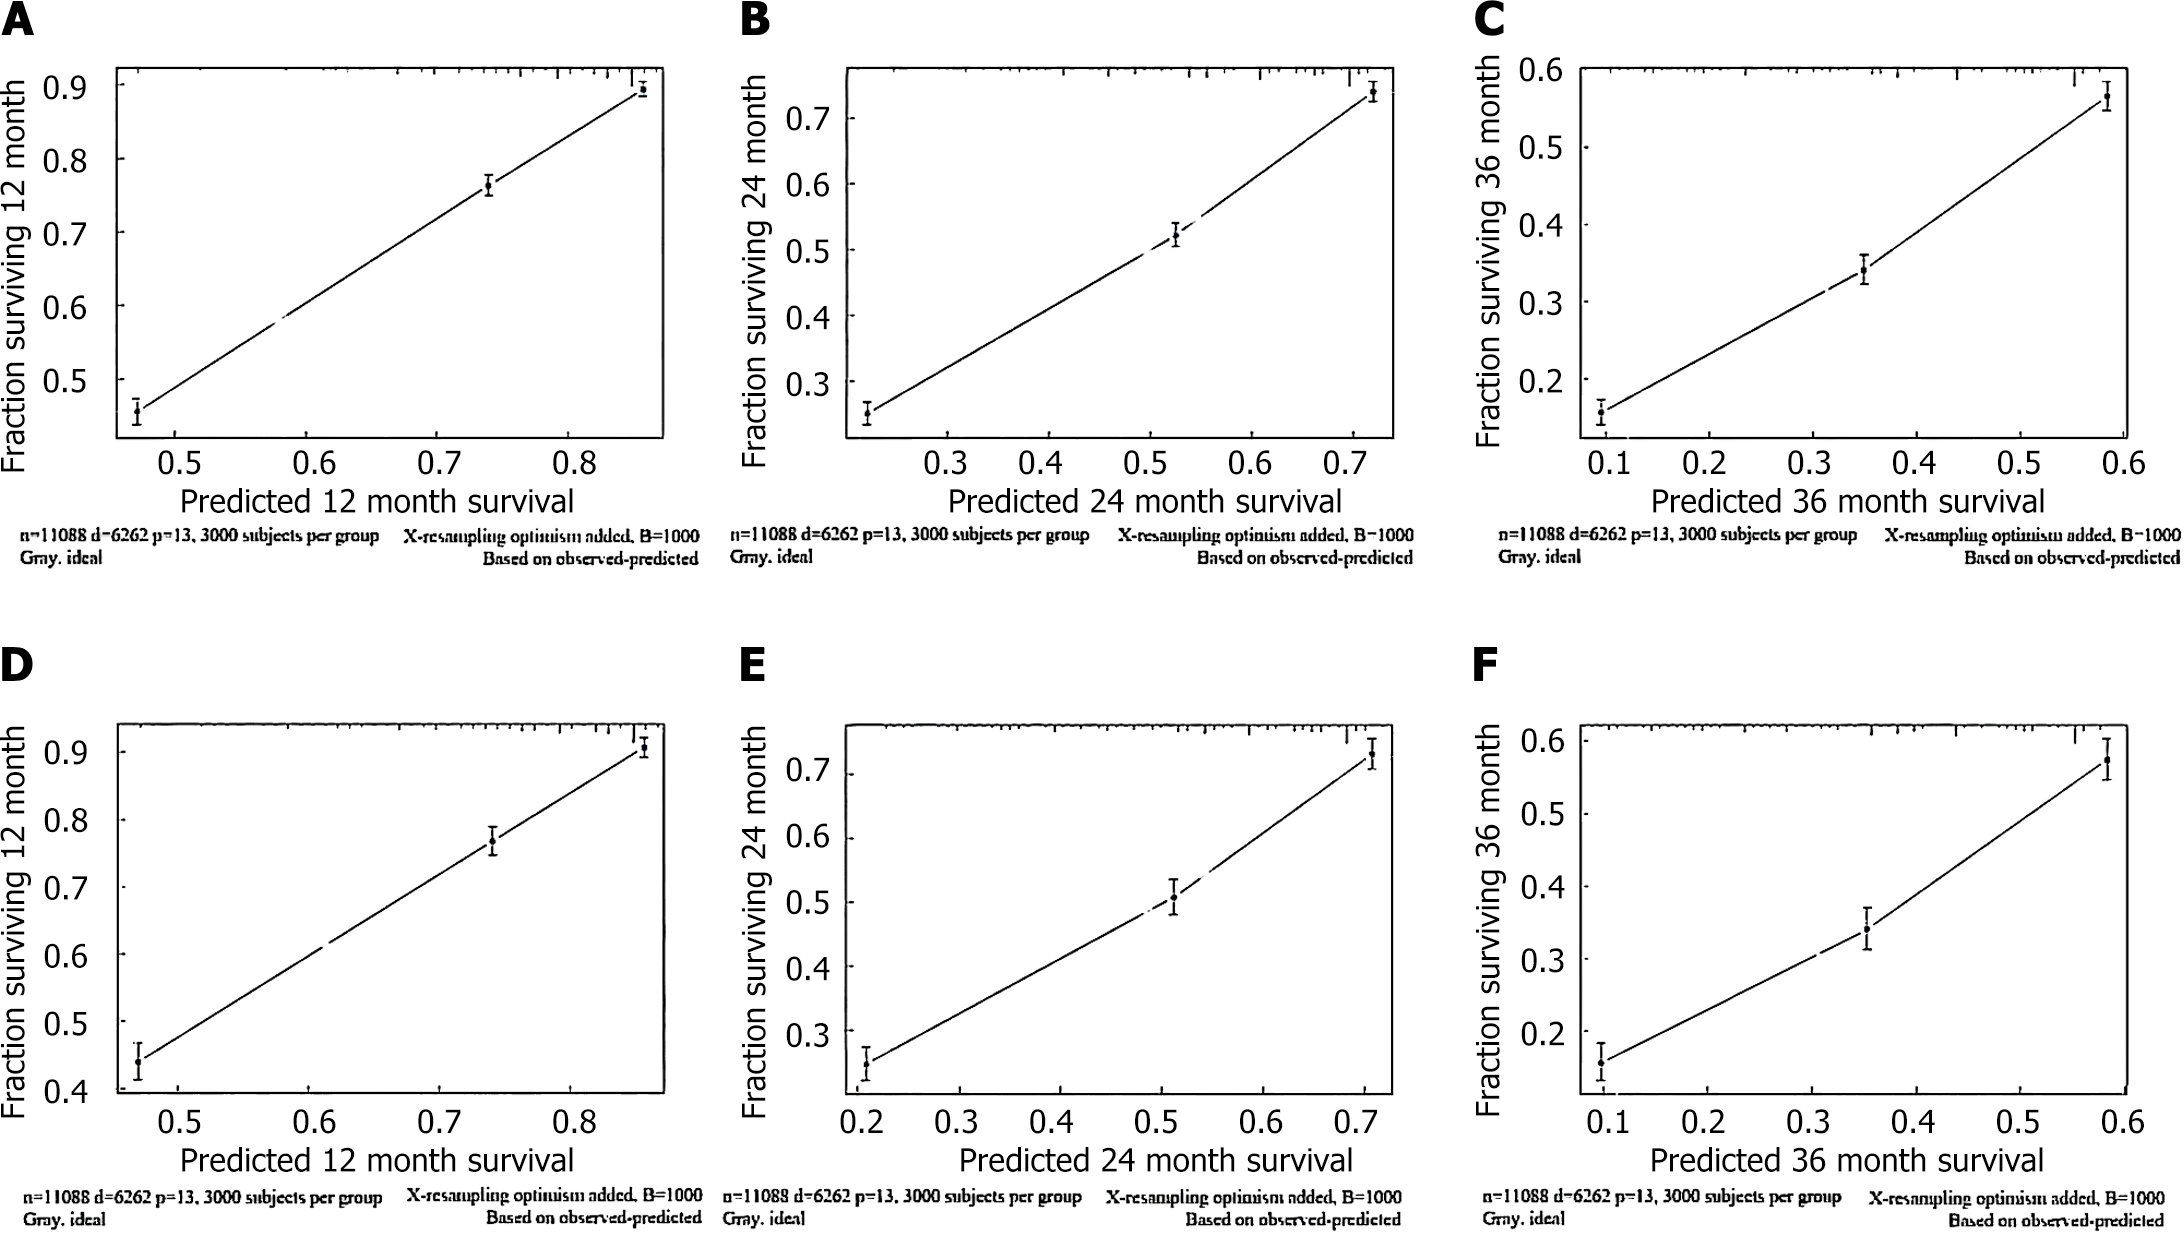
Figure 2 Calibration curves based on cancer-specific survival for metastatic colorectal cancer patients.
A-C: Calibration curves based on 1-, 2-, and 3-year cancer-specific survival (CSS) of the training cohort; D-F: Calibration curves based on 1-, 2-, and 3-year CSS of the validation cohort.
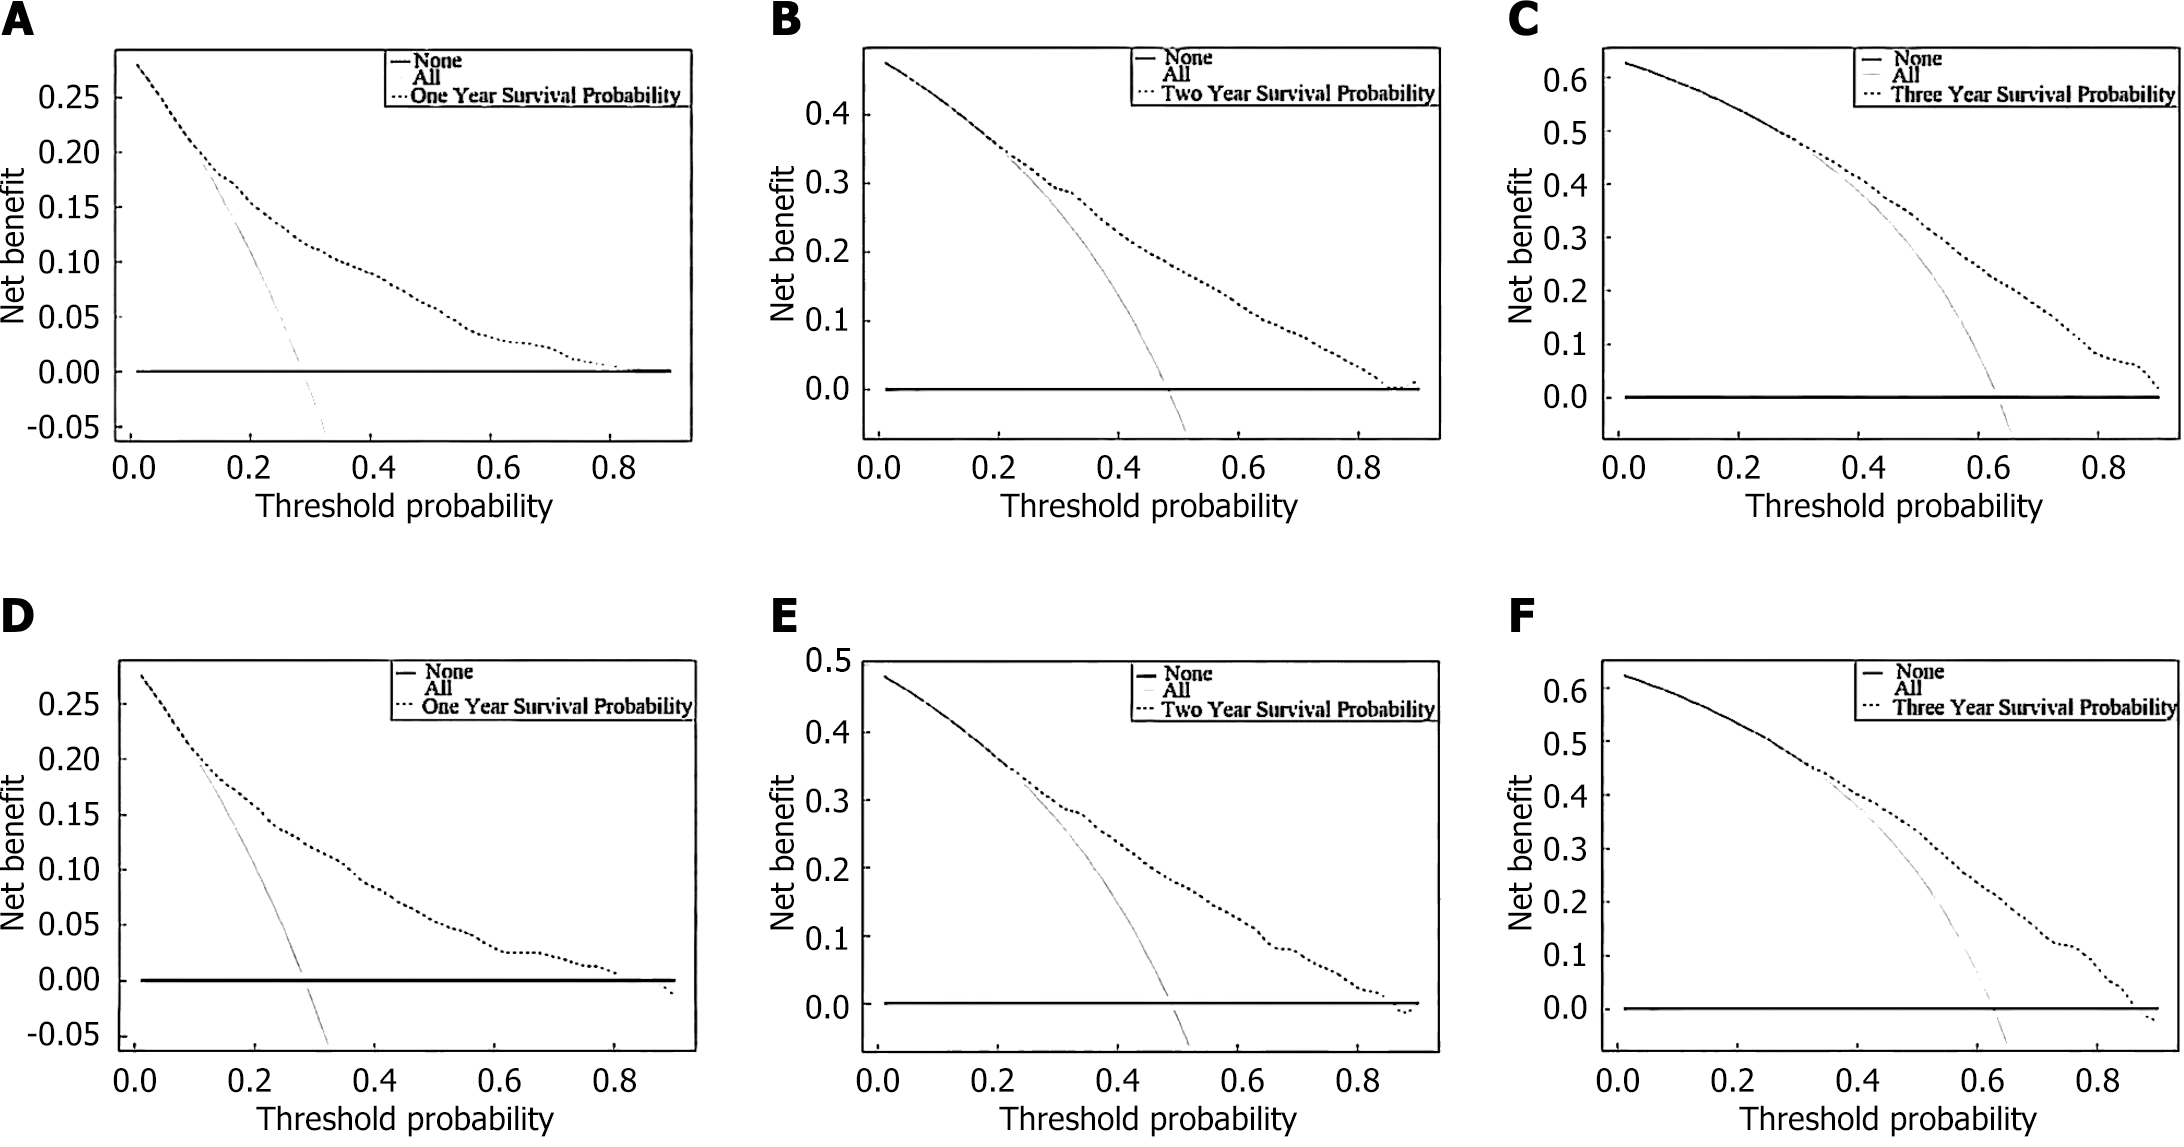
Figure 3 The nomogram model predicts the clinical decision curve of cancer-specific survival in metastatic colorectal cancer patients.
A-C: Clinical decision curves based on 1-, 2-, and 3-year cancer-specific survival (CSS) in the training cohort; D-F: Clinical decision curves based on 1-, 2-, and 3-year CSS in the validation cohort.
Figure 4 X-tile software was used to calculate the optimal truncation value and establish a risk classification system.
A and B: The optimal cutoff values of the predicted total scores, including the low-risk group (score: 0-164), medium-risk group (score: 165-247) and high-risk group (score: 248-480); C: Kaplan-Meier curves for different risk levels according to the cancer-specific survival of the training cohort.
Figure 5 Kaplan-Meier survival curves for patients with different risk levels were drawn according to their cancer-specific survival.
A: Platoon line; B: Training queue; C: Authentication queue.
- Citation: Zhou YJ, Tan ZE, Zhuang WD, Xu XH. Analysis of cancer-specific survival in patients with metastatic colorectal cancer: A evidence-based medicine study. World J Gastrointest Surg 2024; 16(6): 1791-1802
- URL: https://www.wjgnet.com/1948-9366/full/v16/i6/1791.htm
- DOI: https://dx.doi.org/10.4240/wjgs.v16.i6.1791


