Copyright
©The Author(s) 2024.
World J Gastrointest Surg. Jun 27, 2024; 16(6): 1717-1725
Published online Jun 27, 2024. doi: 10.4240/wjgs.v16.i6.1717
Published online Jun 27, 2024. doi: 10.4240/wjgs.v16.i6.1717
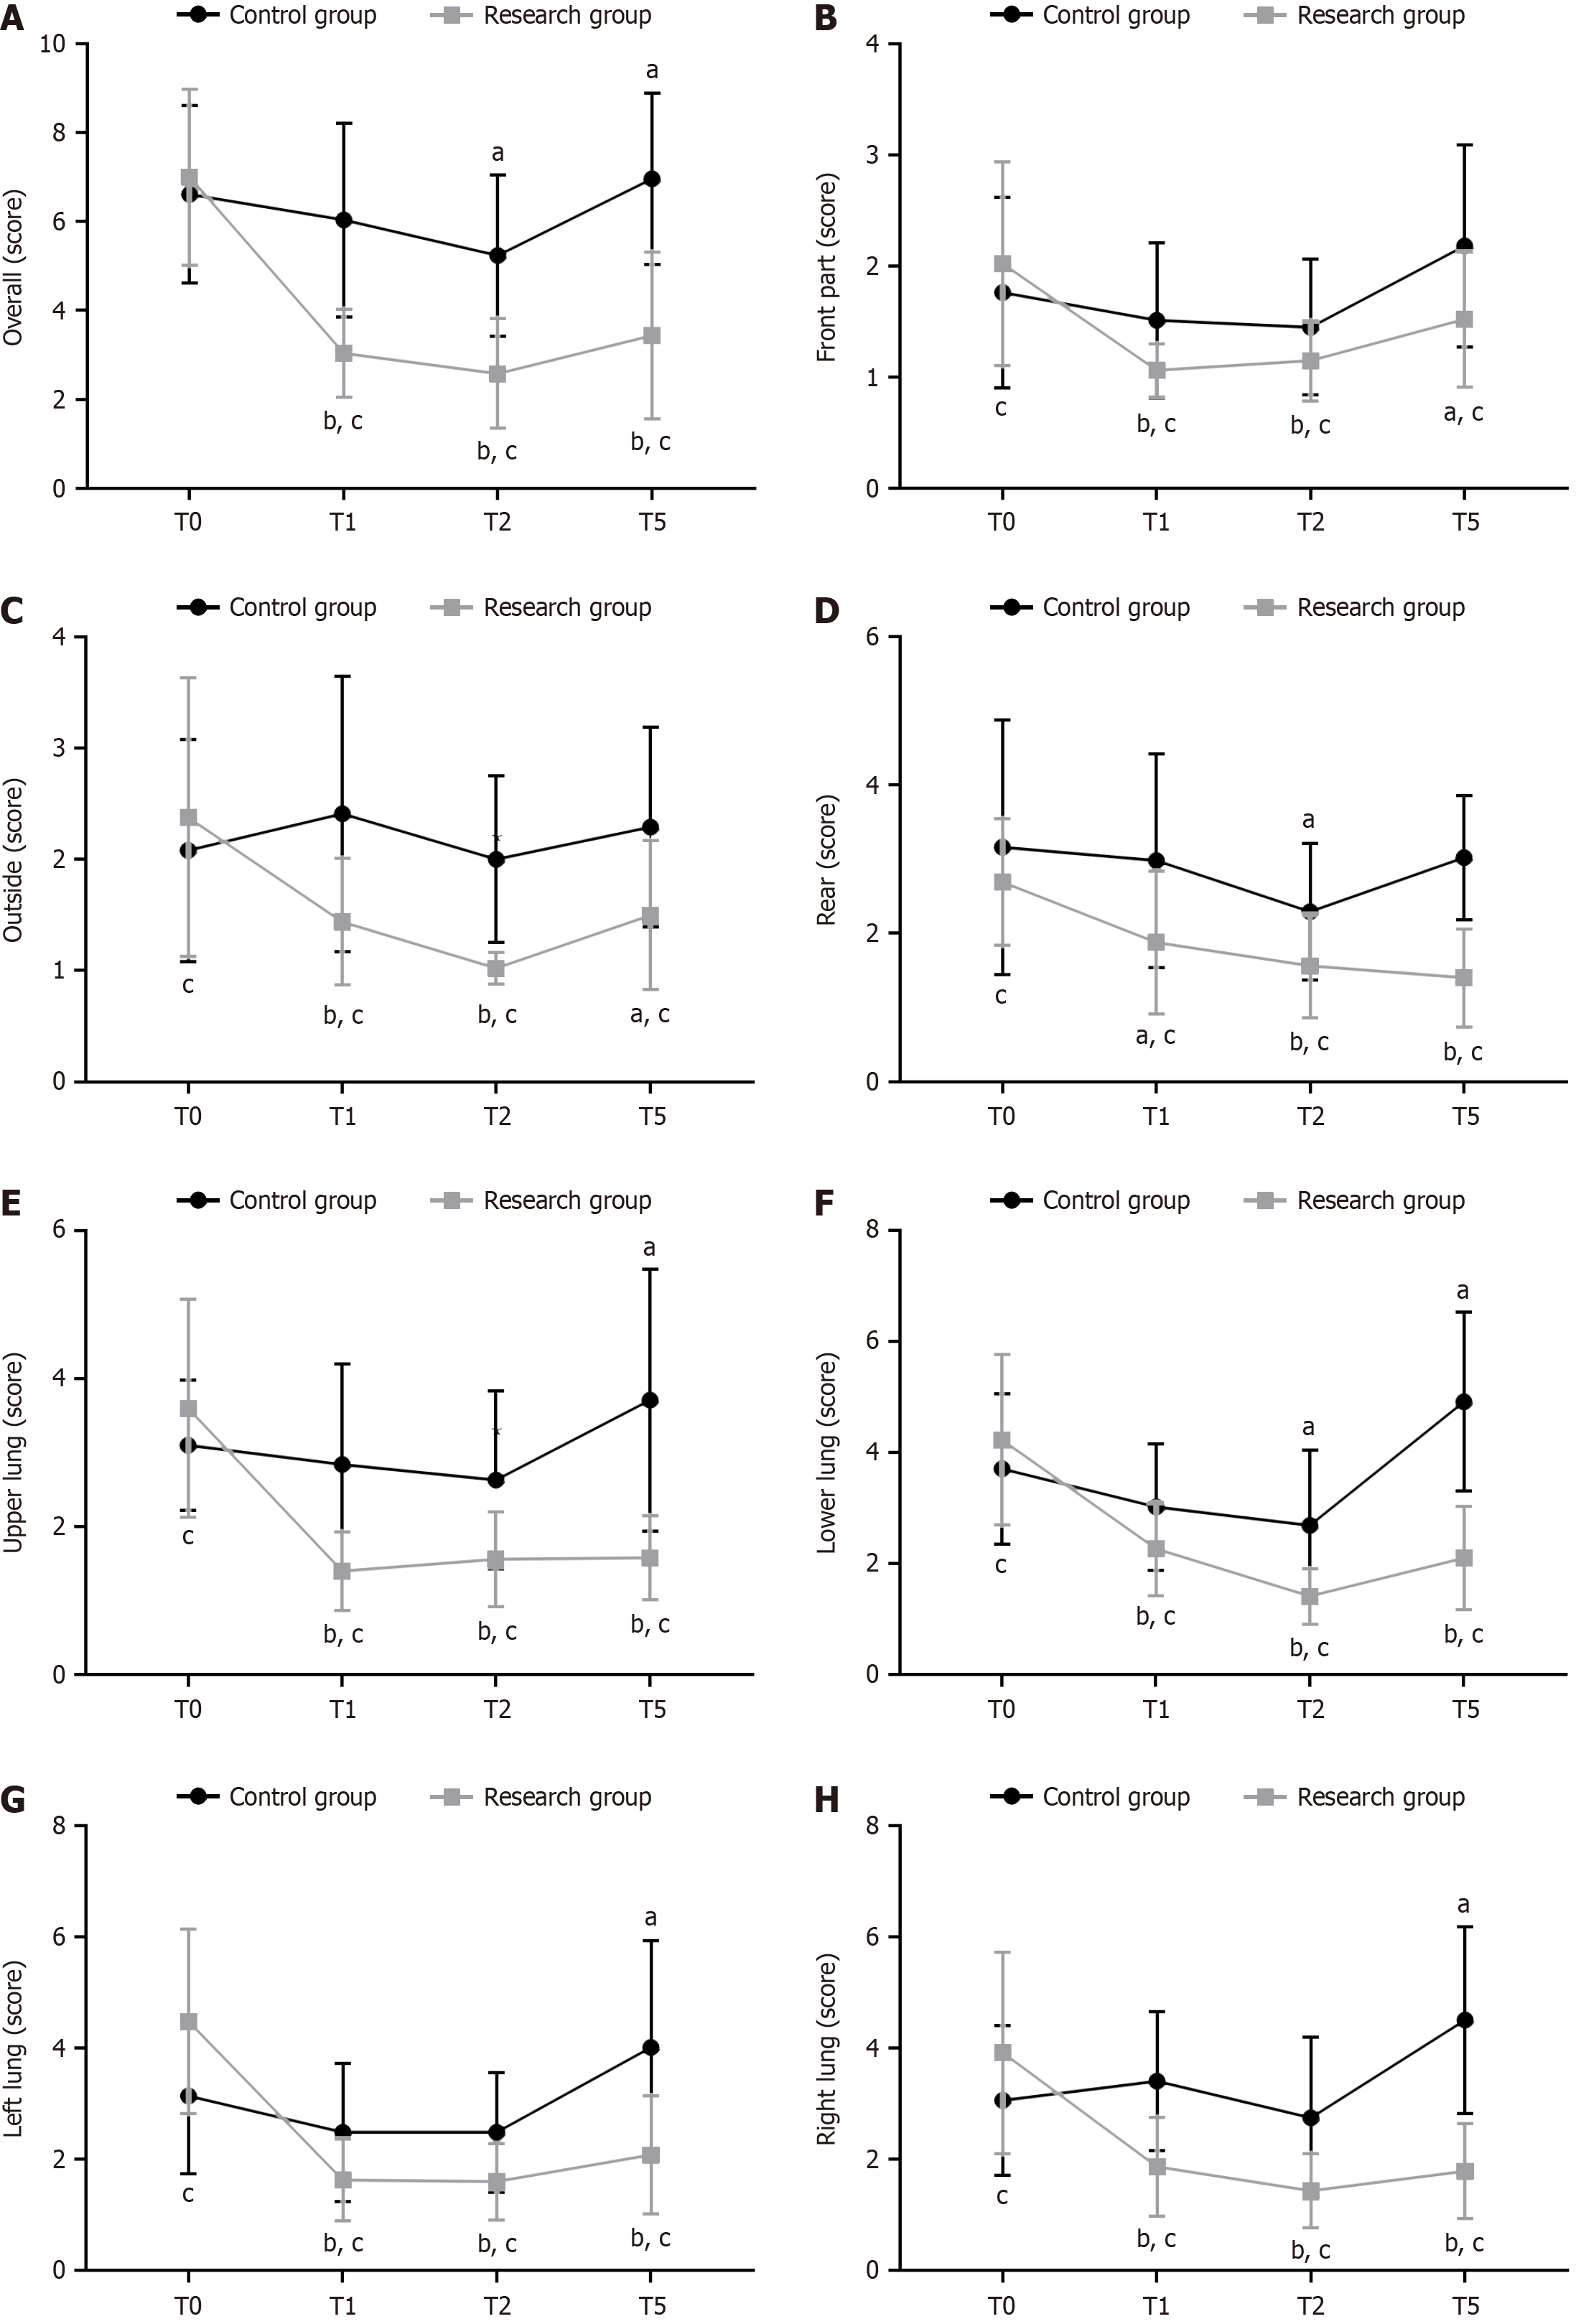
Figure 1 Comparison of lung ultrasound scores.
A-H: Changes in lung ultrasound scores of the (A) whole, (B) anterior, (C) lateral, (D) posterior, (E) upper, (F) lower, (G) left, and (H) right lung regions across time points. aP < 0.05 and bP < 0.01, compared with T0; cP < 0.05, vs control group.
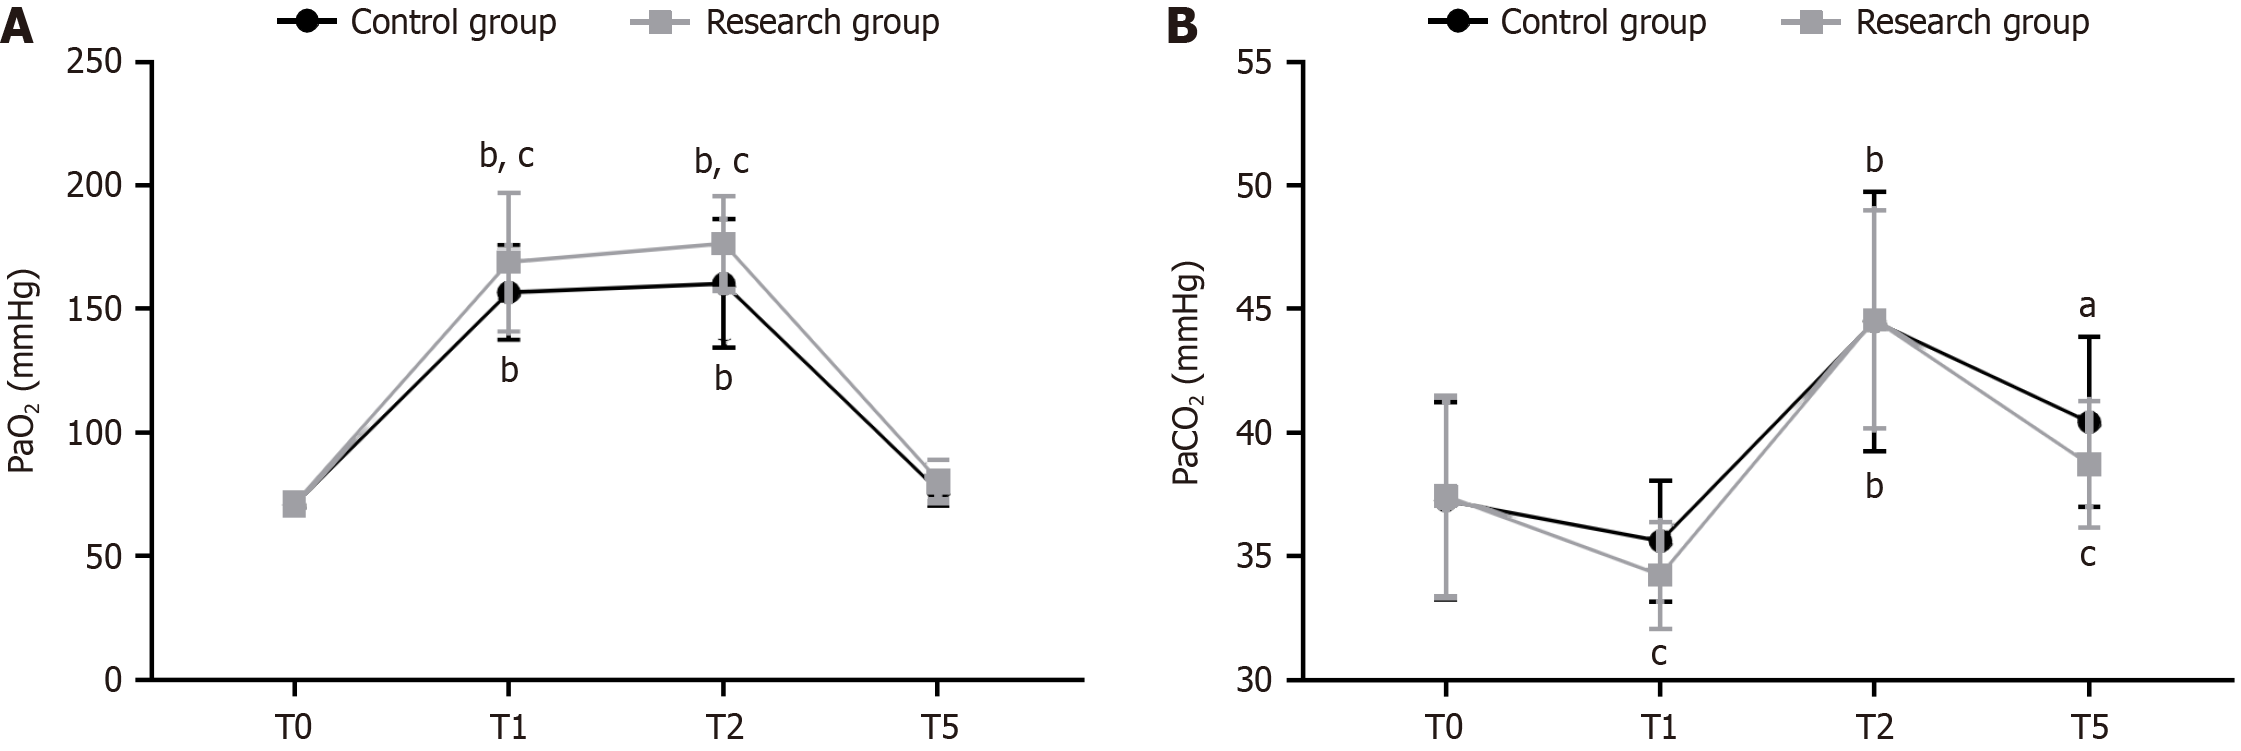
Figure 2 Comparison of (arterial partial pressure of oxygen) PaO2 and (partial pressure of carbon dioxide) PaCO2.
A and B: Changes in (A) PaO2 and (B) PaCO2 at various time points. aP < 0.05 and bP < 0.01, compared with T0; cP < 0.05 vs control group.
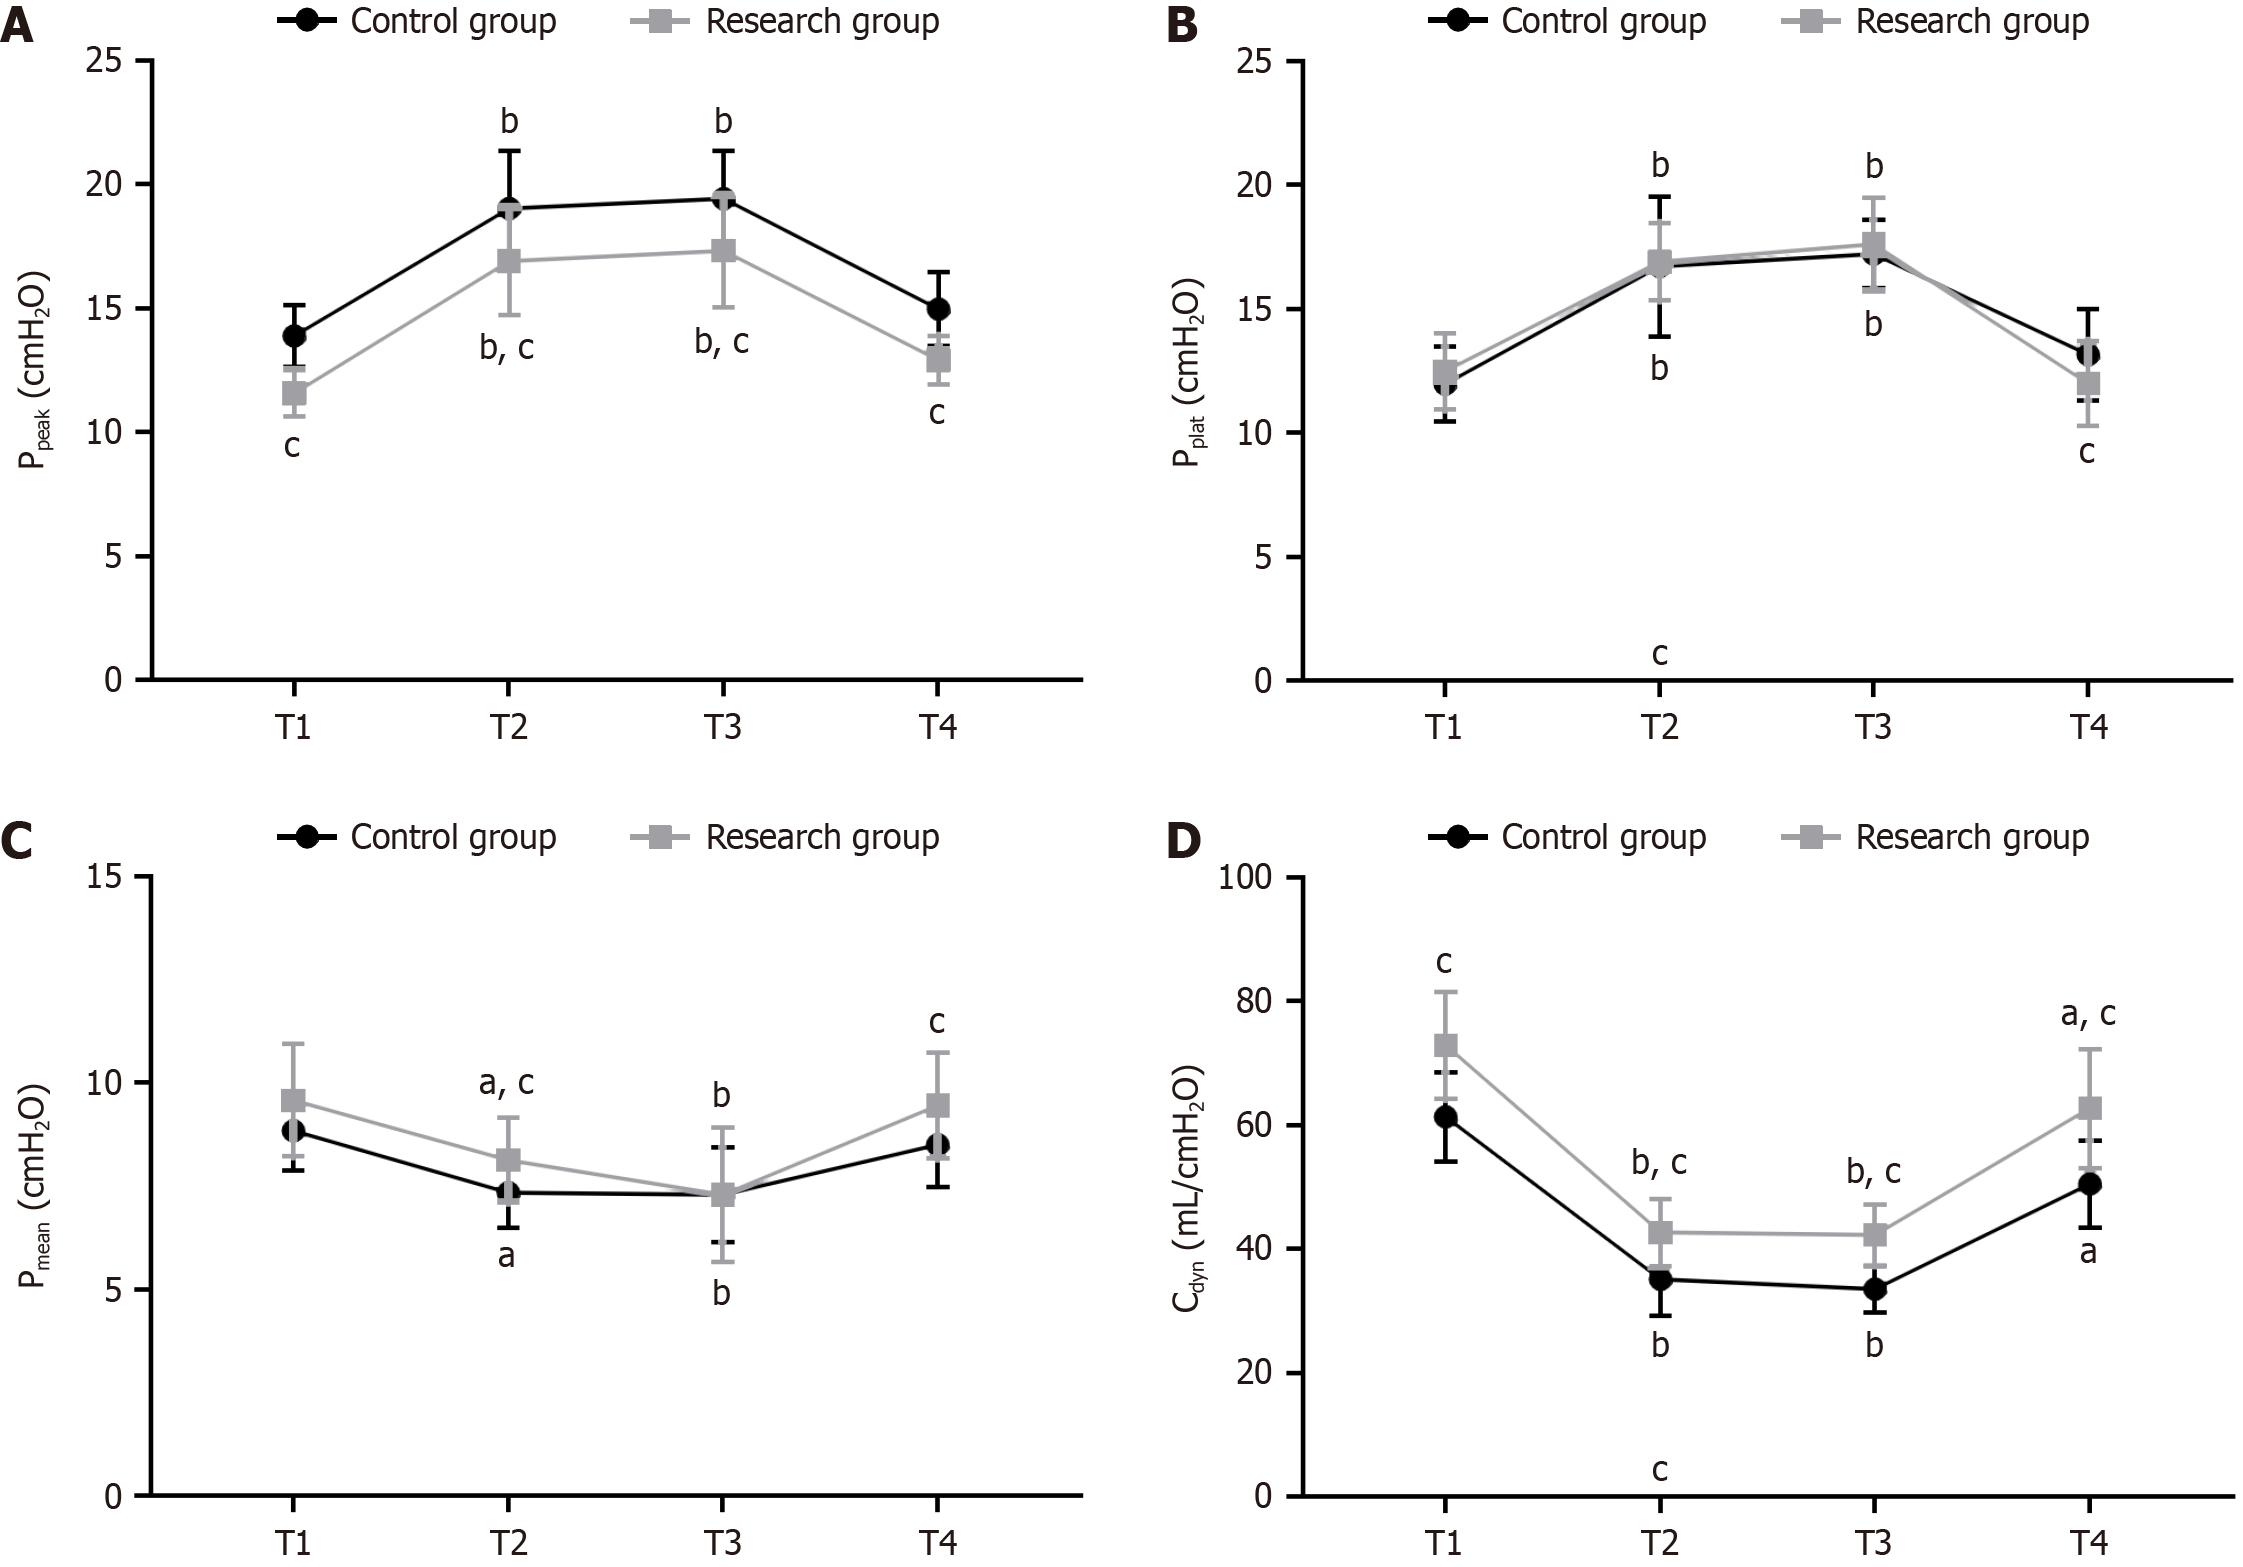
Figure 3 Comparisons of peak airway pressure (Ppeak), plateau pressure (Pplat), mean airway pressure (Pmean), and dynamic pulmonary compliance (Cdyn).
A-D: Changes in (A) Ppeak, (B) Pplat, (C) Pmean, and (D) Cdyn across time points. aP < 0.05 and bP < 0.01, compared with T1; cP < 0.05 vs control group.
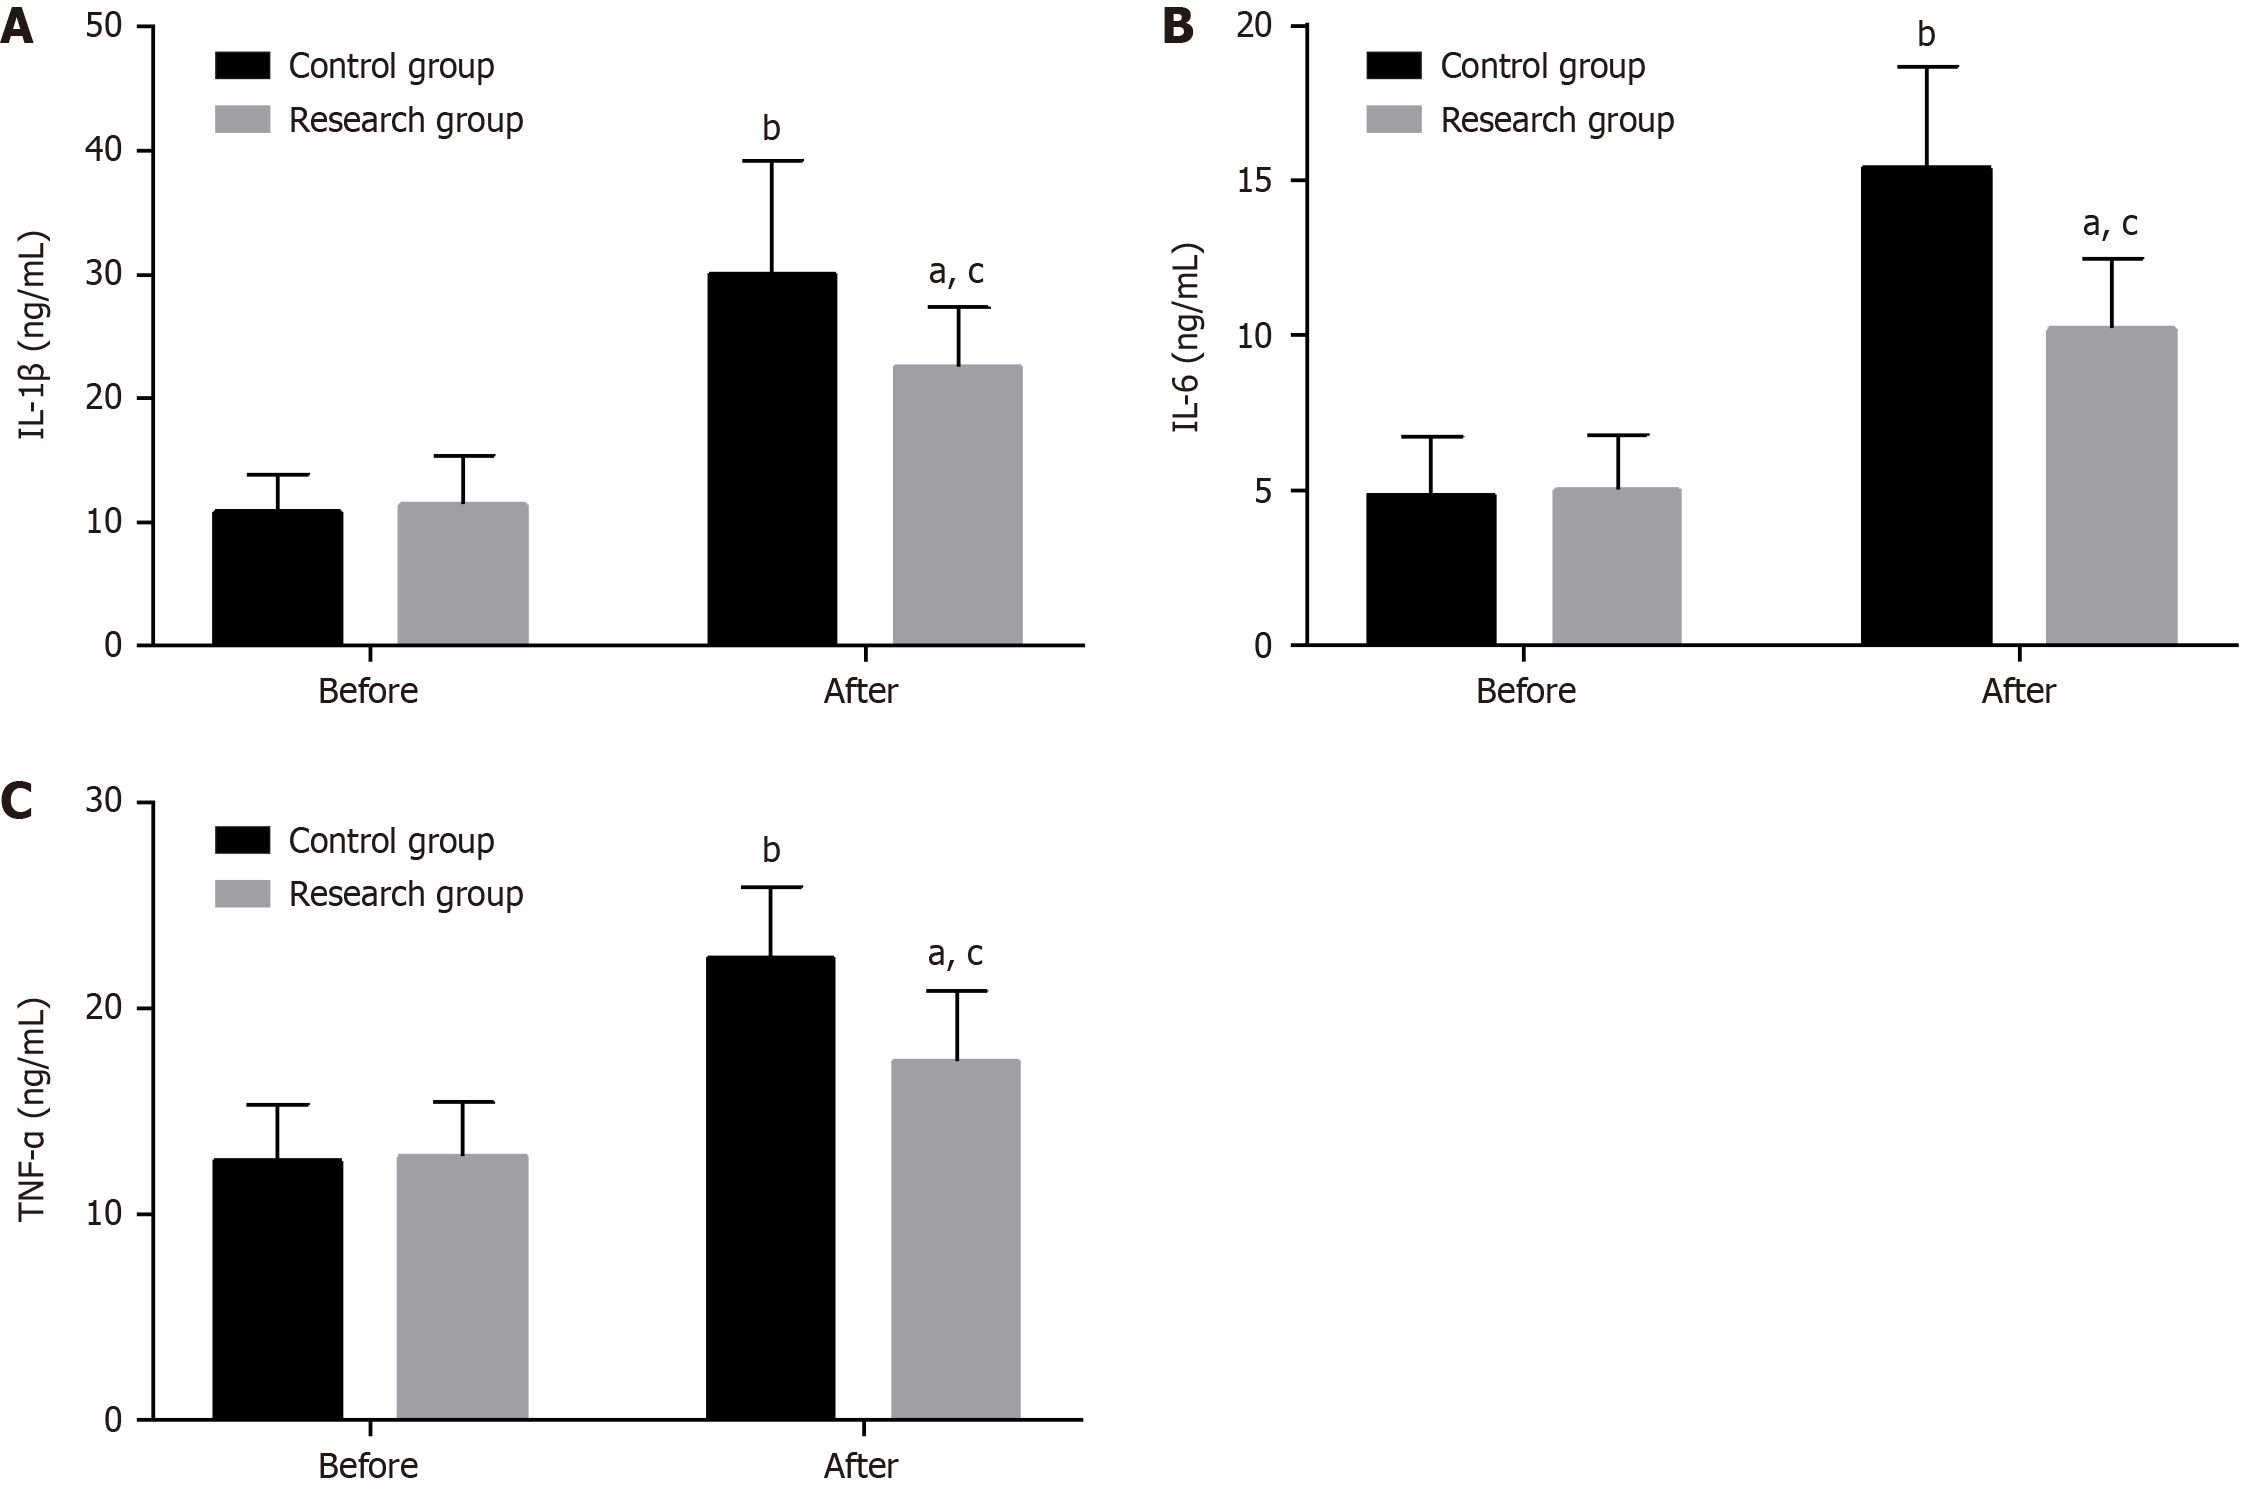
Figure 4 Comparison of interleukin-1β, interleukin-6 and tumor necrosis factor-α.
A-C: Pre- and post-treatment (A) IL-1β, (B) IL-6, and (C) TNF-α levels. aP < 0.05 and bP < 0.01, compared with T1; cP < 0.05 vs control group.
- Citation: Tan J, Bao CM, Chen XY. Lung ultrasound score evaluation of the effect of pressure-controlled ventilation volume-guaranteed on patients undergoing laparoscopic-assisted radical gastrectomy. World J Gastrointest Surg 2024; 16(6): 1717-1725
- URL: https://www.wjgnet.com/1948-9366/full/v16/i6/1717.htm
- DOI: https://dx.doi.org/10.4240/wjgs.v16.i6.1717


