Copyright
©The Author(s) 2024.
World J Gastrointest Surg. Jun 27, 2024; 16(6): 1670-1680
Published online Jun 27, 2024. doi: 10.4240/wjgs.v16.i6.1670
Published online Jun 27, 2024. doi: 10.4240/wjgs.v16.i6.1670
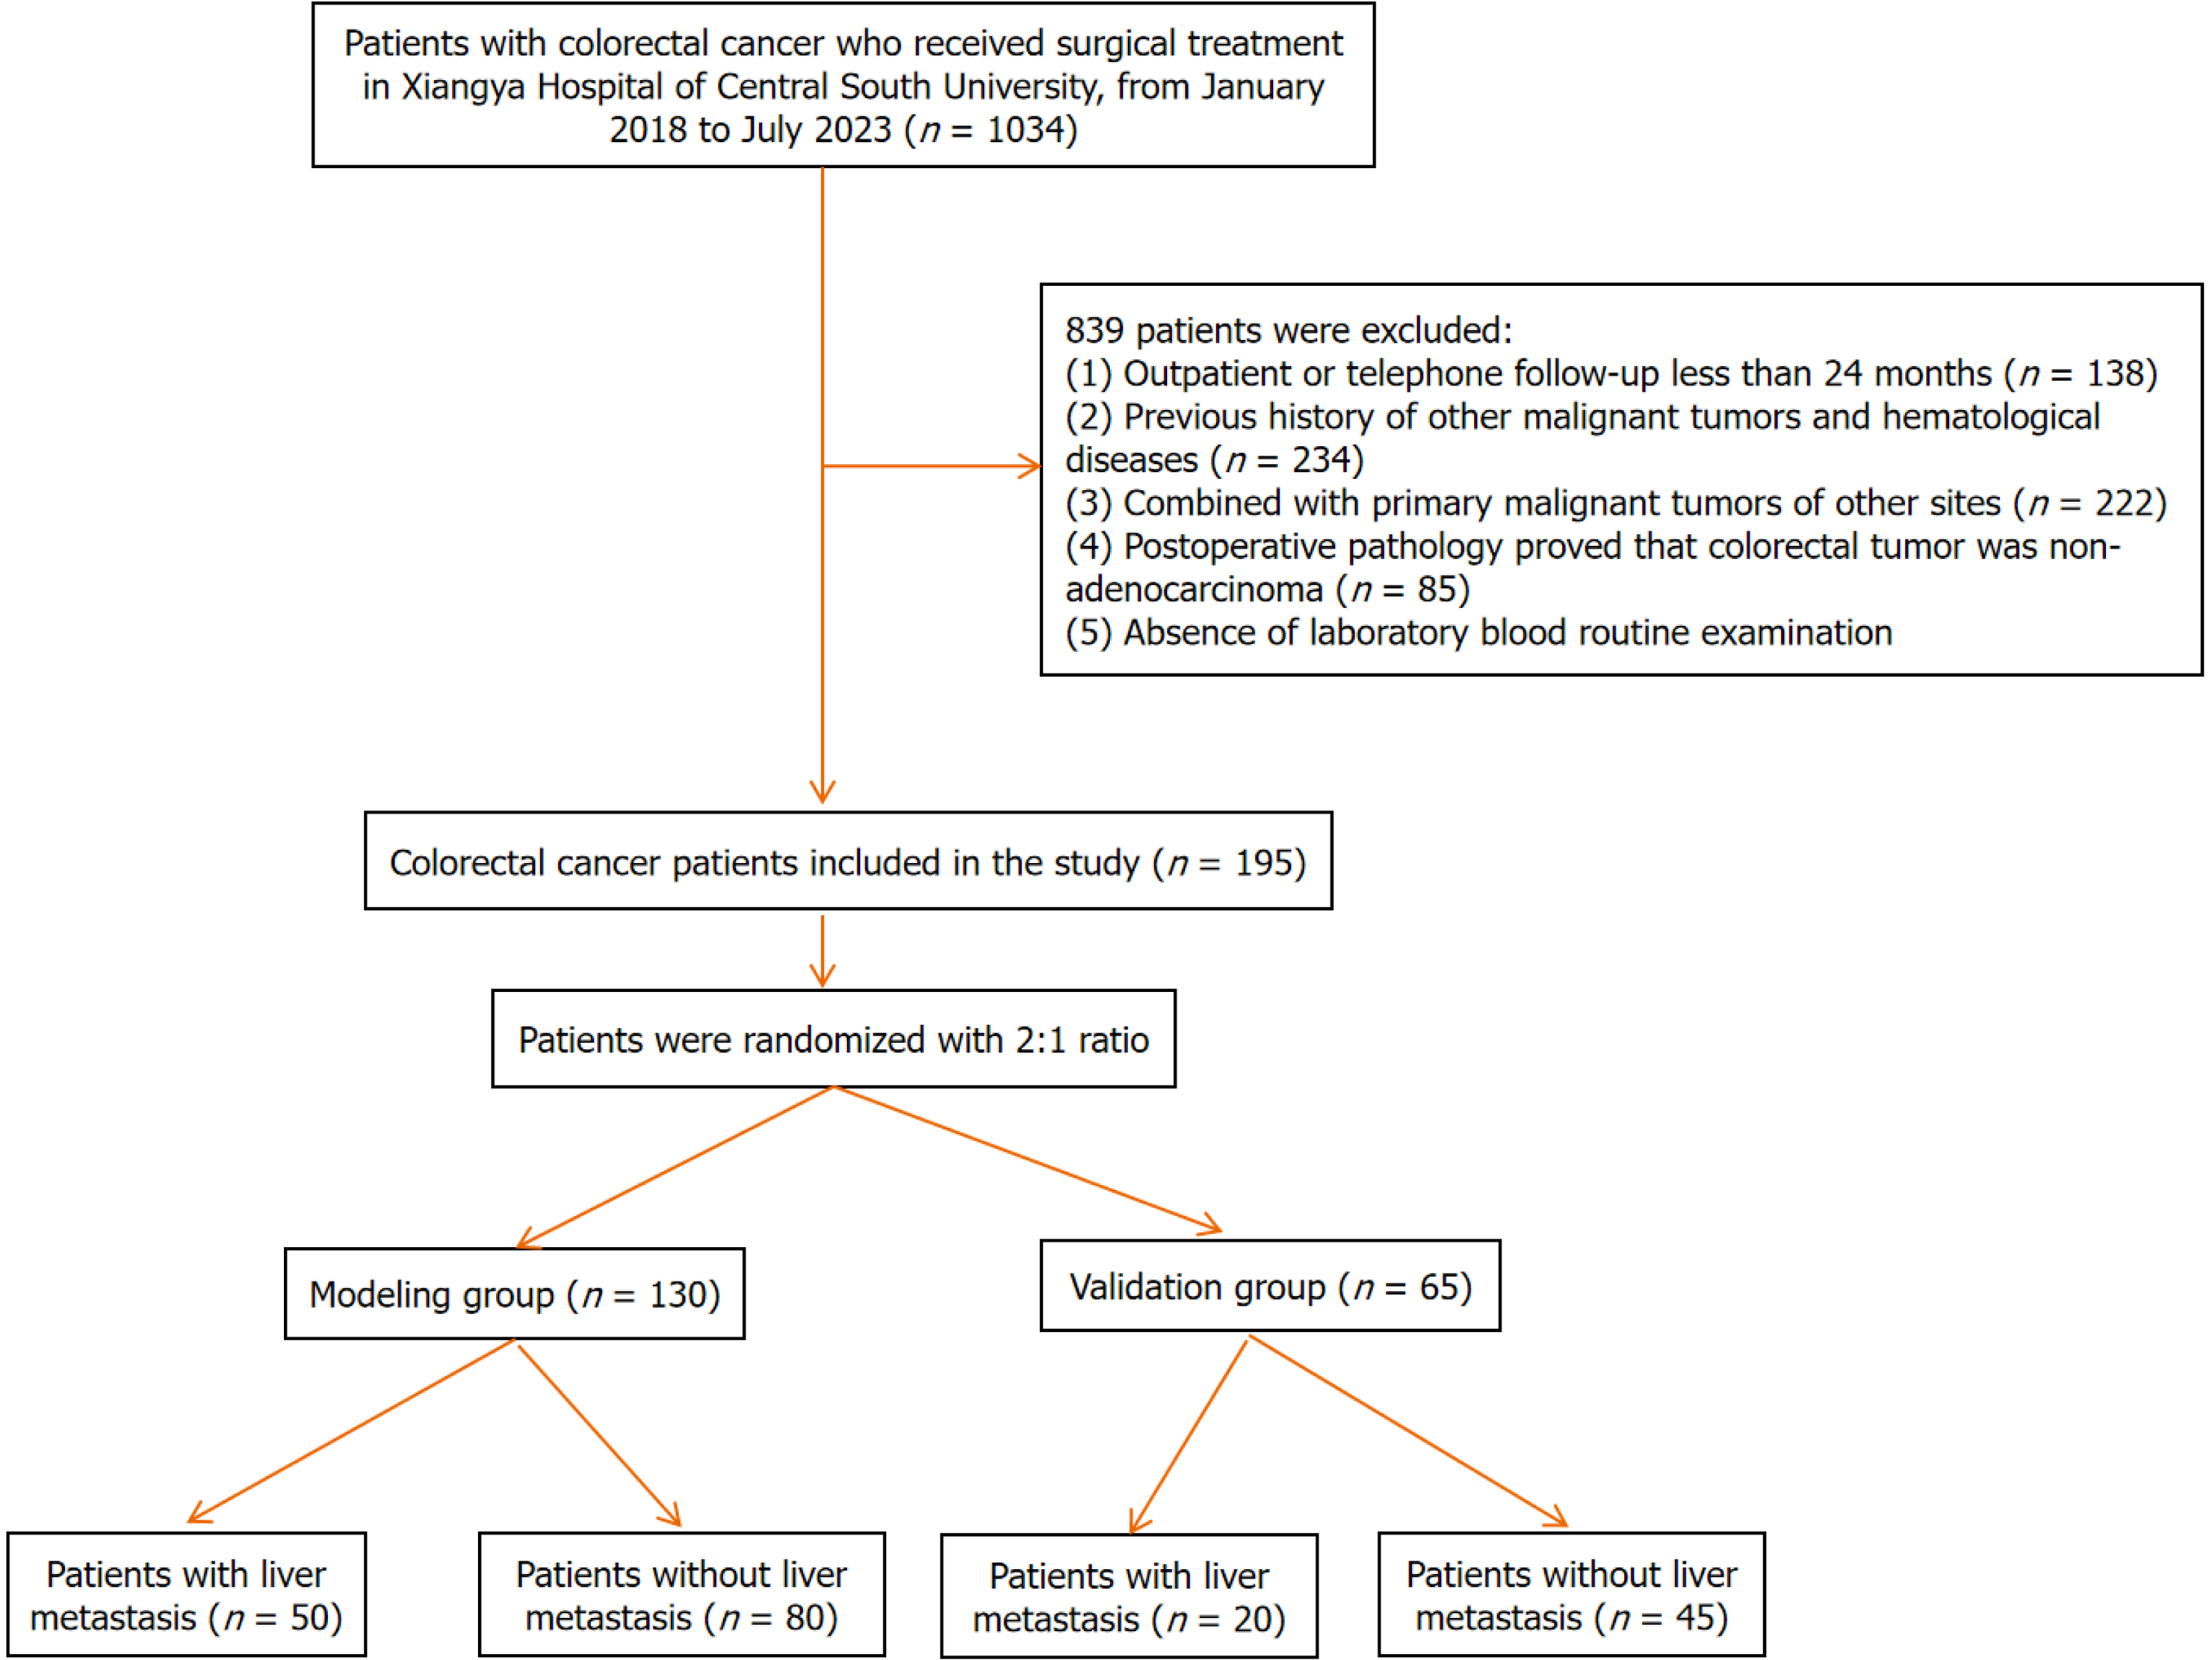
Figure 1 Patient inclusion and randomization flow charts.
Figure 2 Feature variable selection based on least absolute shrinkage and selection operator regression.
A: Tenfold cross-validation chart; B: Shrinkage coefficient chart.
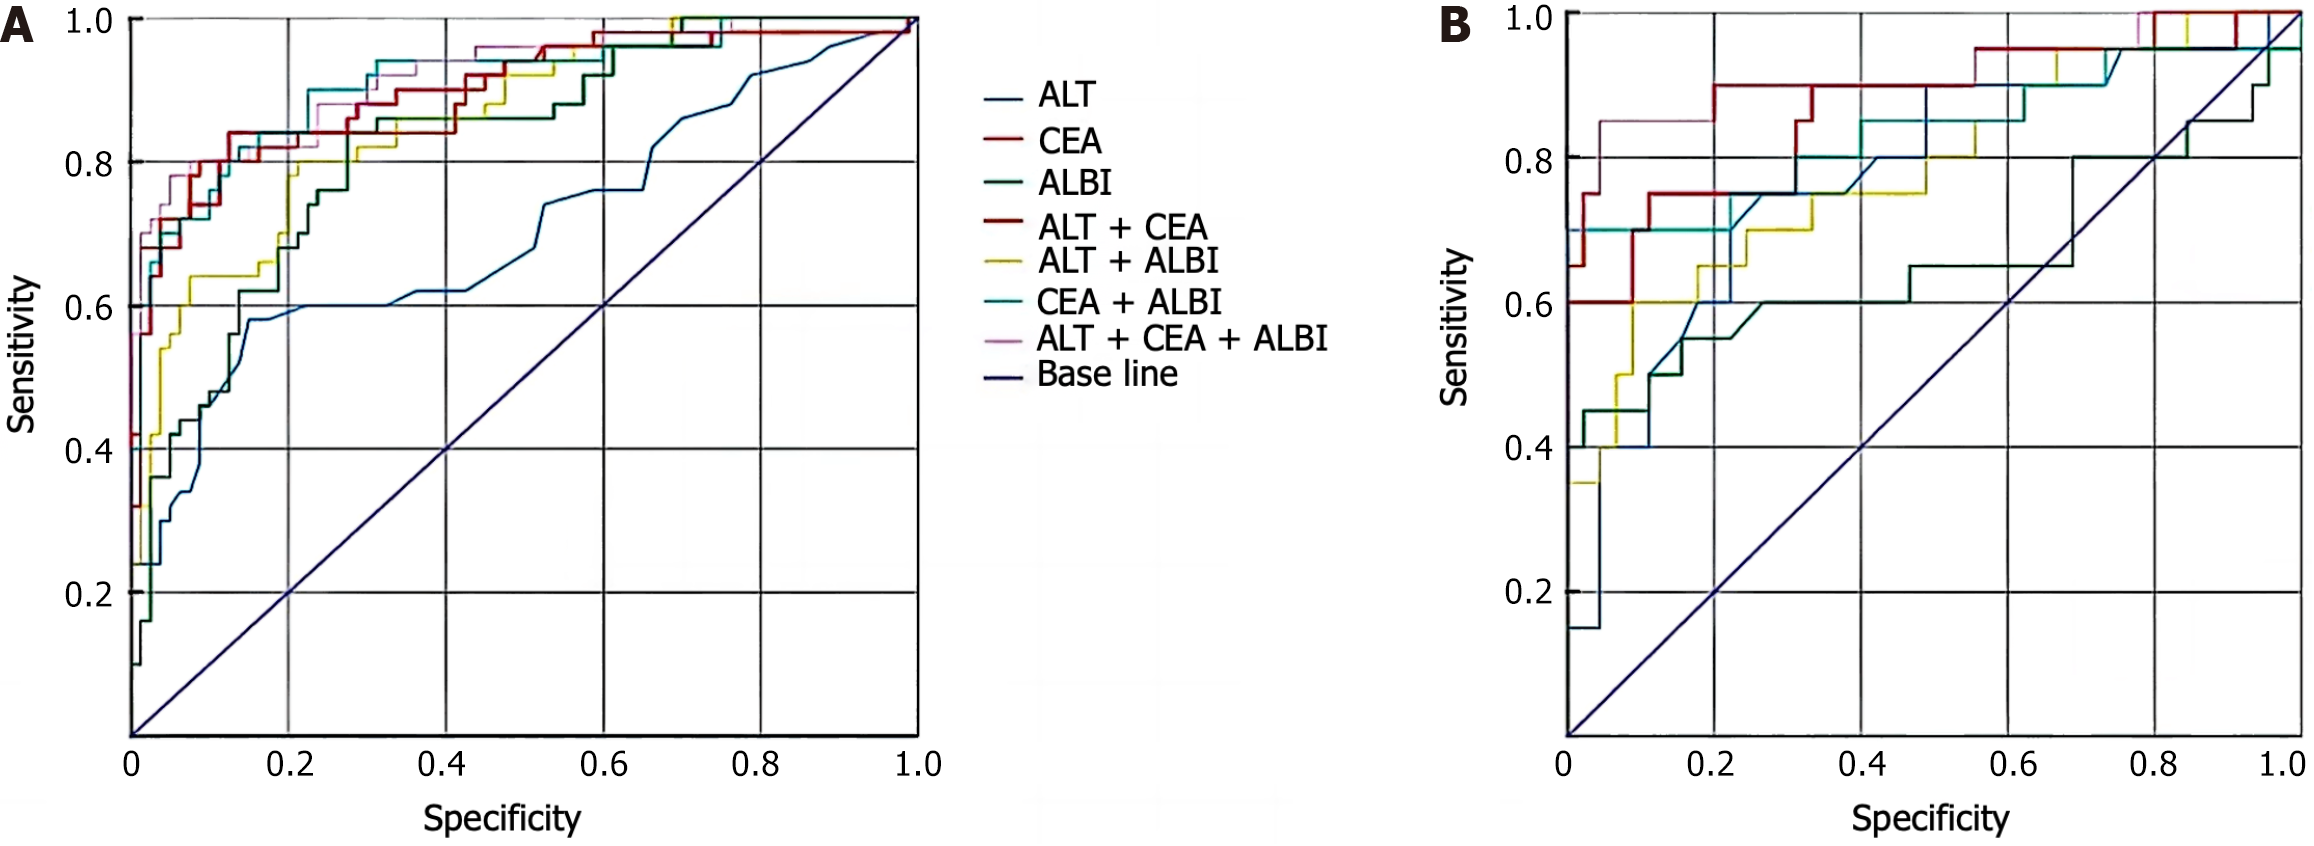
Figure 3 Receiver operating characteristic curve of the model for predicting liver metastasis in patients with colorectal cancer.
A: Modeling group; B: Verification group. ALT: Alanine aminotransferase; CEA: Carcinoembryonic antigen; ALBI: Albumin-bilirubin.
Figure 4 Calibration curves of the least absolute shrinkage and selection operator logistic regression model.
A: Modeling group; B: Verification group.
Figure 5 Decision curve analysis of the least absolute shrinkage and selection operator logistic regression model.
A: Modeling group; B: Verification group.
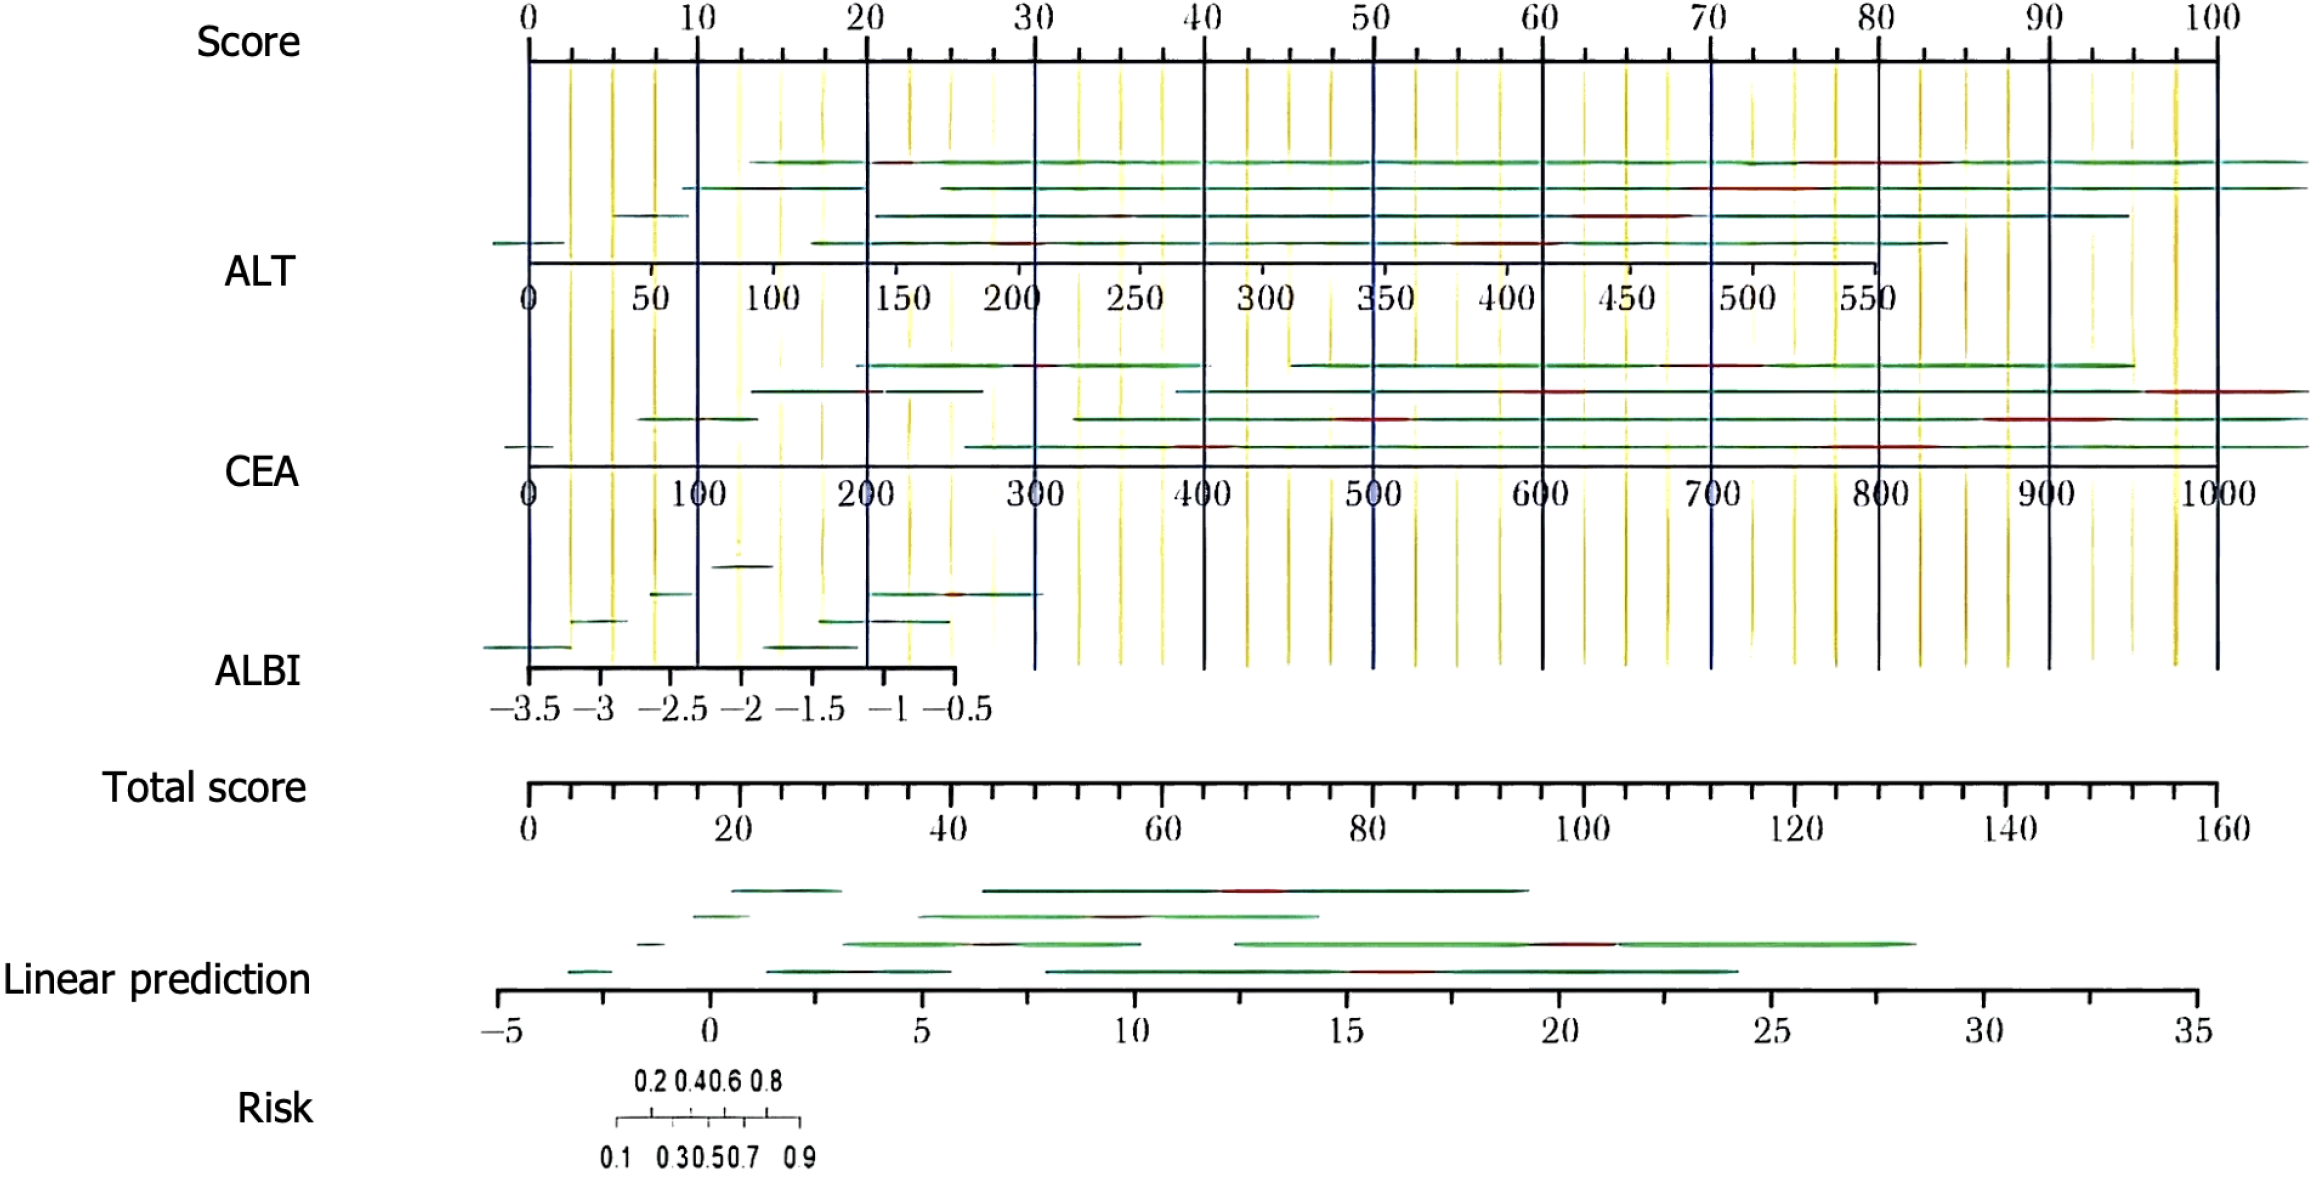
Figure 6 Nomogram prediction model for liver metastasis of colorectal cancer.
ALT: Alanine aminotransferase; CEA: Carcinoembryonic antigen; ALBI: Albumin-bilirubin.
- Citation: Wang ZM, Pan SP, Zhang JJ, Zhou J. Prediction and analysis of albumin-bilirubin score combined with liver function index and carcinoembryonic antigen on liver metastasis of colorectal cancer. World J Gastrointest Surg 2024; 16(6): 1670-1680
- URL: https://www.wjgnet.com/1948-9366/full/v16/i6/1670.htm
- DOI: https://dx.doi.org/10.4240/wjgs.v16.i6.1670


