Copyright
©The Author(s) 2024.
World J Gastrointest Surg. Jun 27, 2024; 16(6): 1571-1581
Published online Jun 27, 2024. doi: 10.4240/wjgs.v16.i6.1571
Published online Jun 27, 2024. doi: 10.4240/wjgs.v16.i6.1571
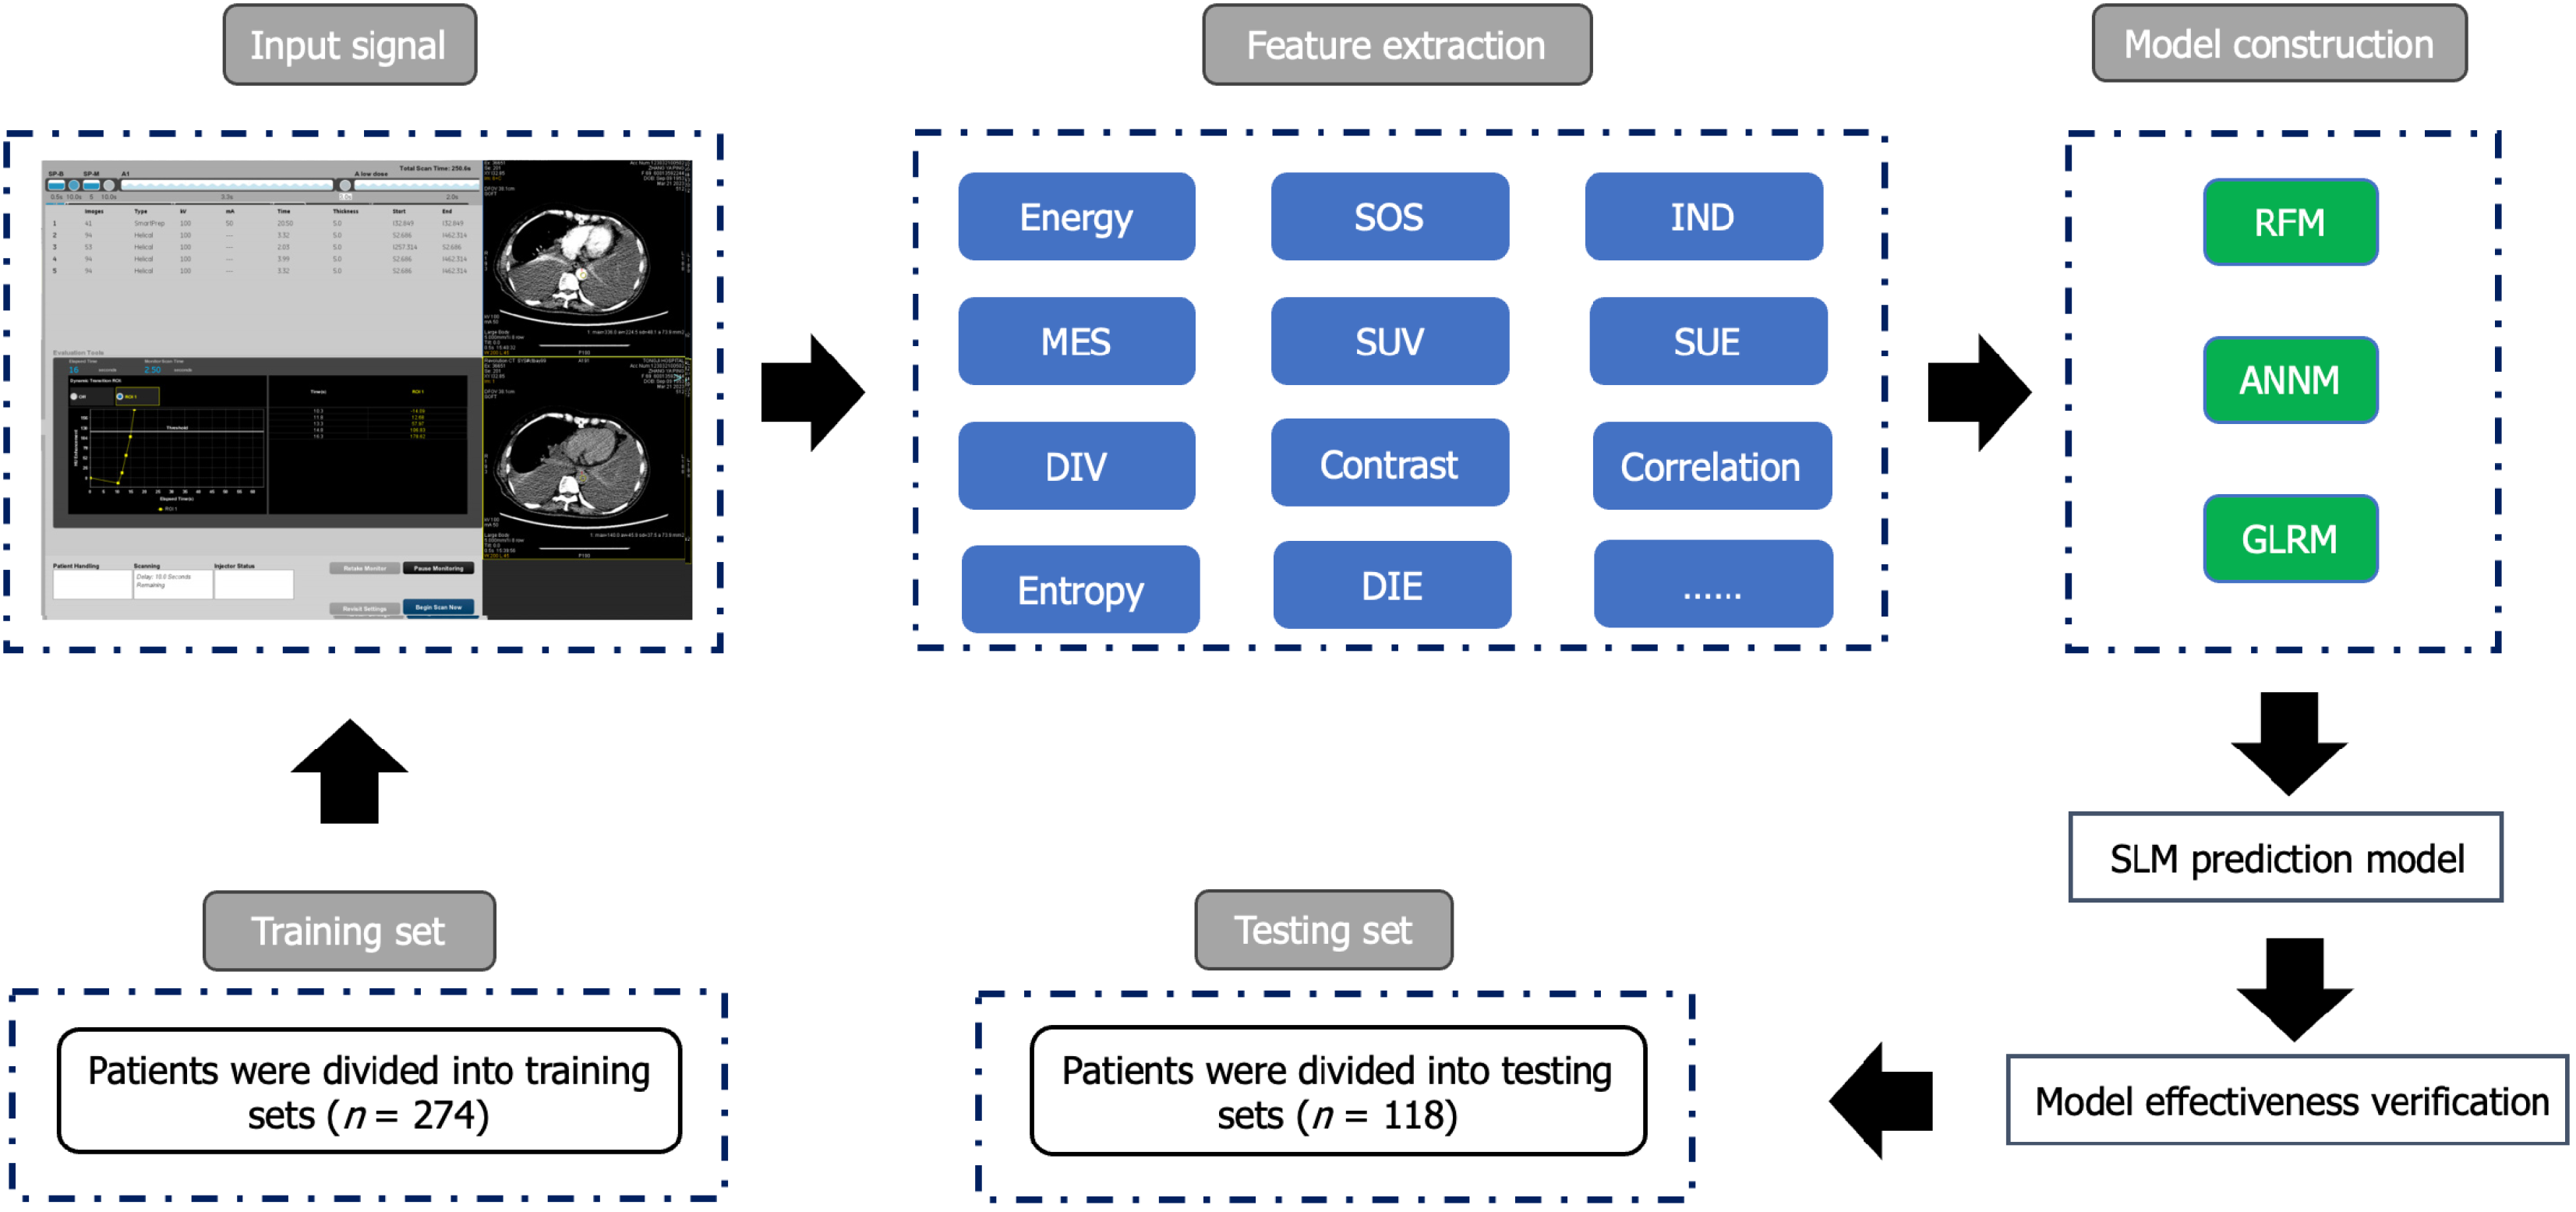
Figure 1 The flow chart of patient selection and data process.
SOS: Sum of squares; IND: Inverse difference; MES: Mean sum; SUV: Sum variance; SUE: Sum entropy; DIV: Difference variance; DIE: Difference entropy; RFM: Random forest model; ANNM: Artificial neural network model; GLRM: Generalized linear regression model; SLM: Synchronous liver metastasis.
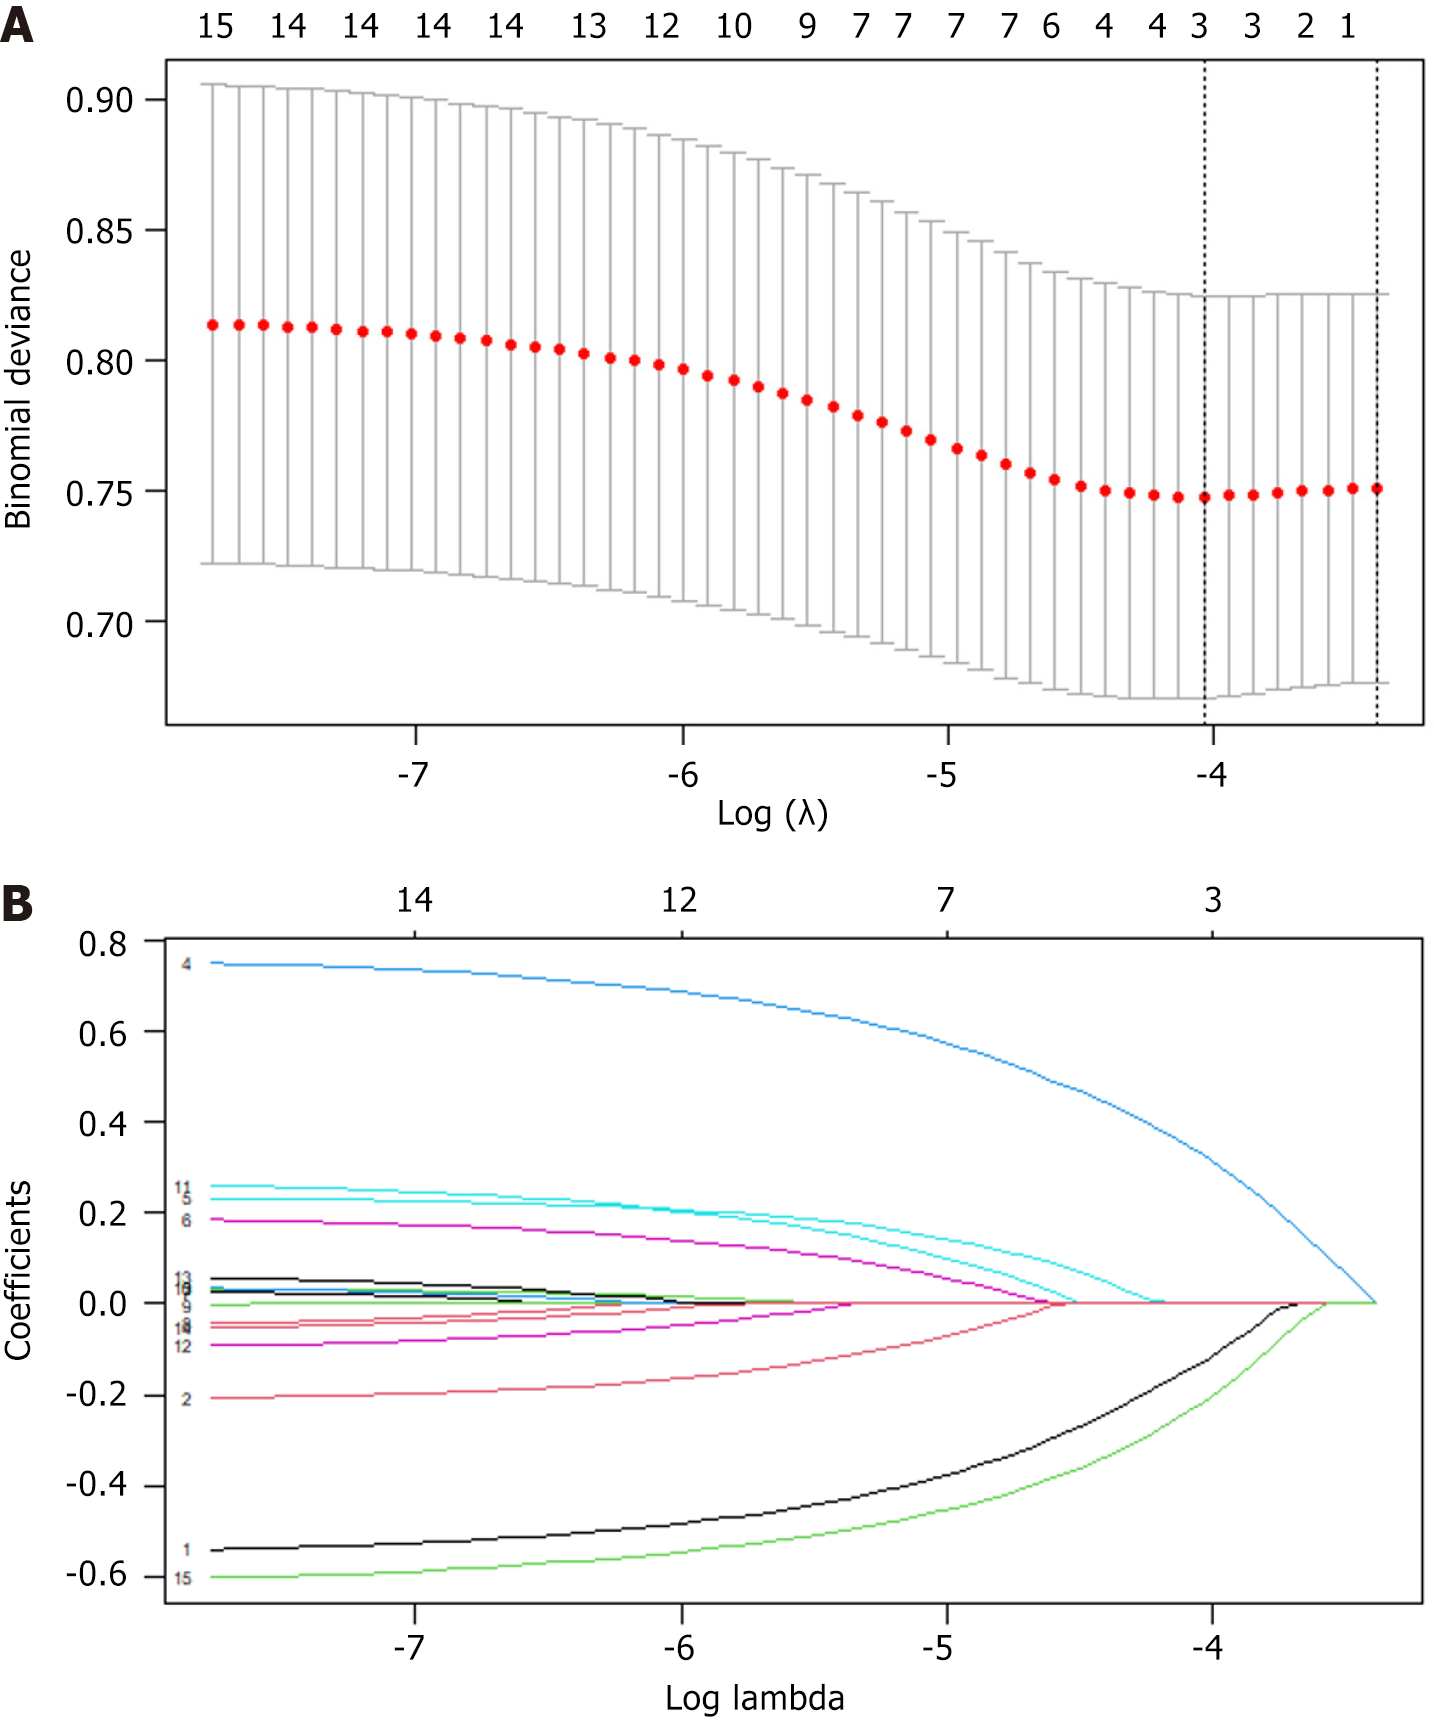
Figure 2 Predictor variable selection based on the least absolute shrinkage and selection operator regression method.
A: Optimal parameter (lambda) selection in the least absolute shrinkage and selection operator (LASSO) model; B: LASSO coefficient profiles of the candidate features.
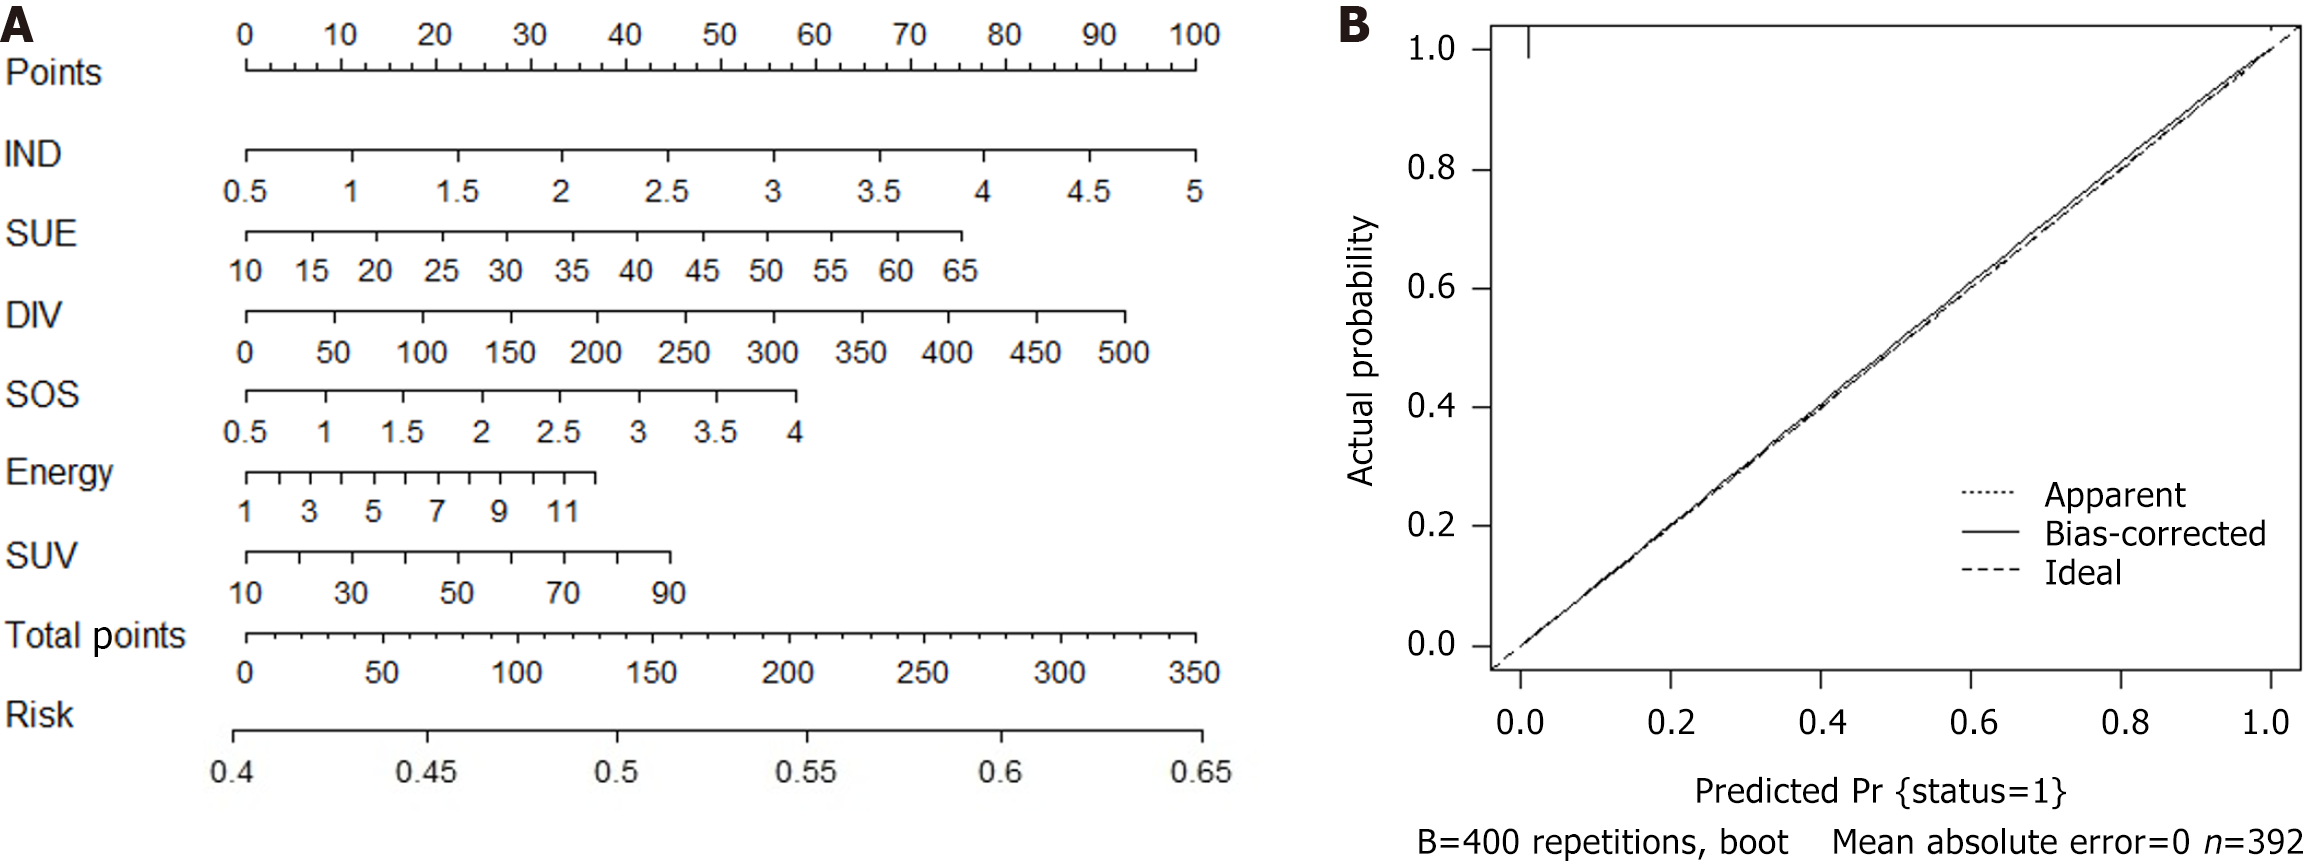
Figure 3 Nomogram prediction model for predicting synchronous liver metastasis in patients with colorectal cancer.
A: Nomogram predicts risk of synchronous liver metastasis; B: The calibration curves for the nomogram. IND: Inverse difference; SUE: Sum entropy; DIV: Difference variance; SOS: Sum of squares; SUV: Sum variance.
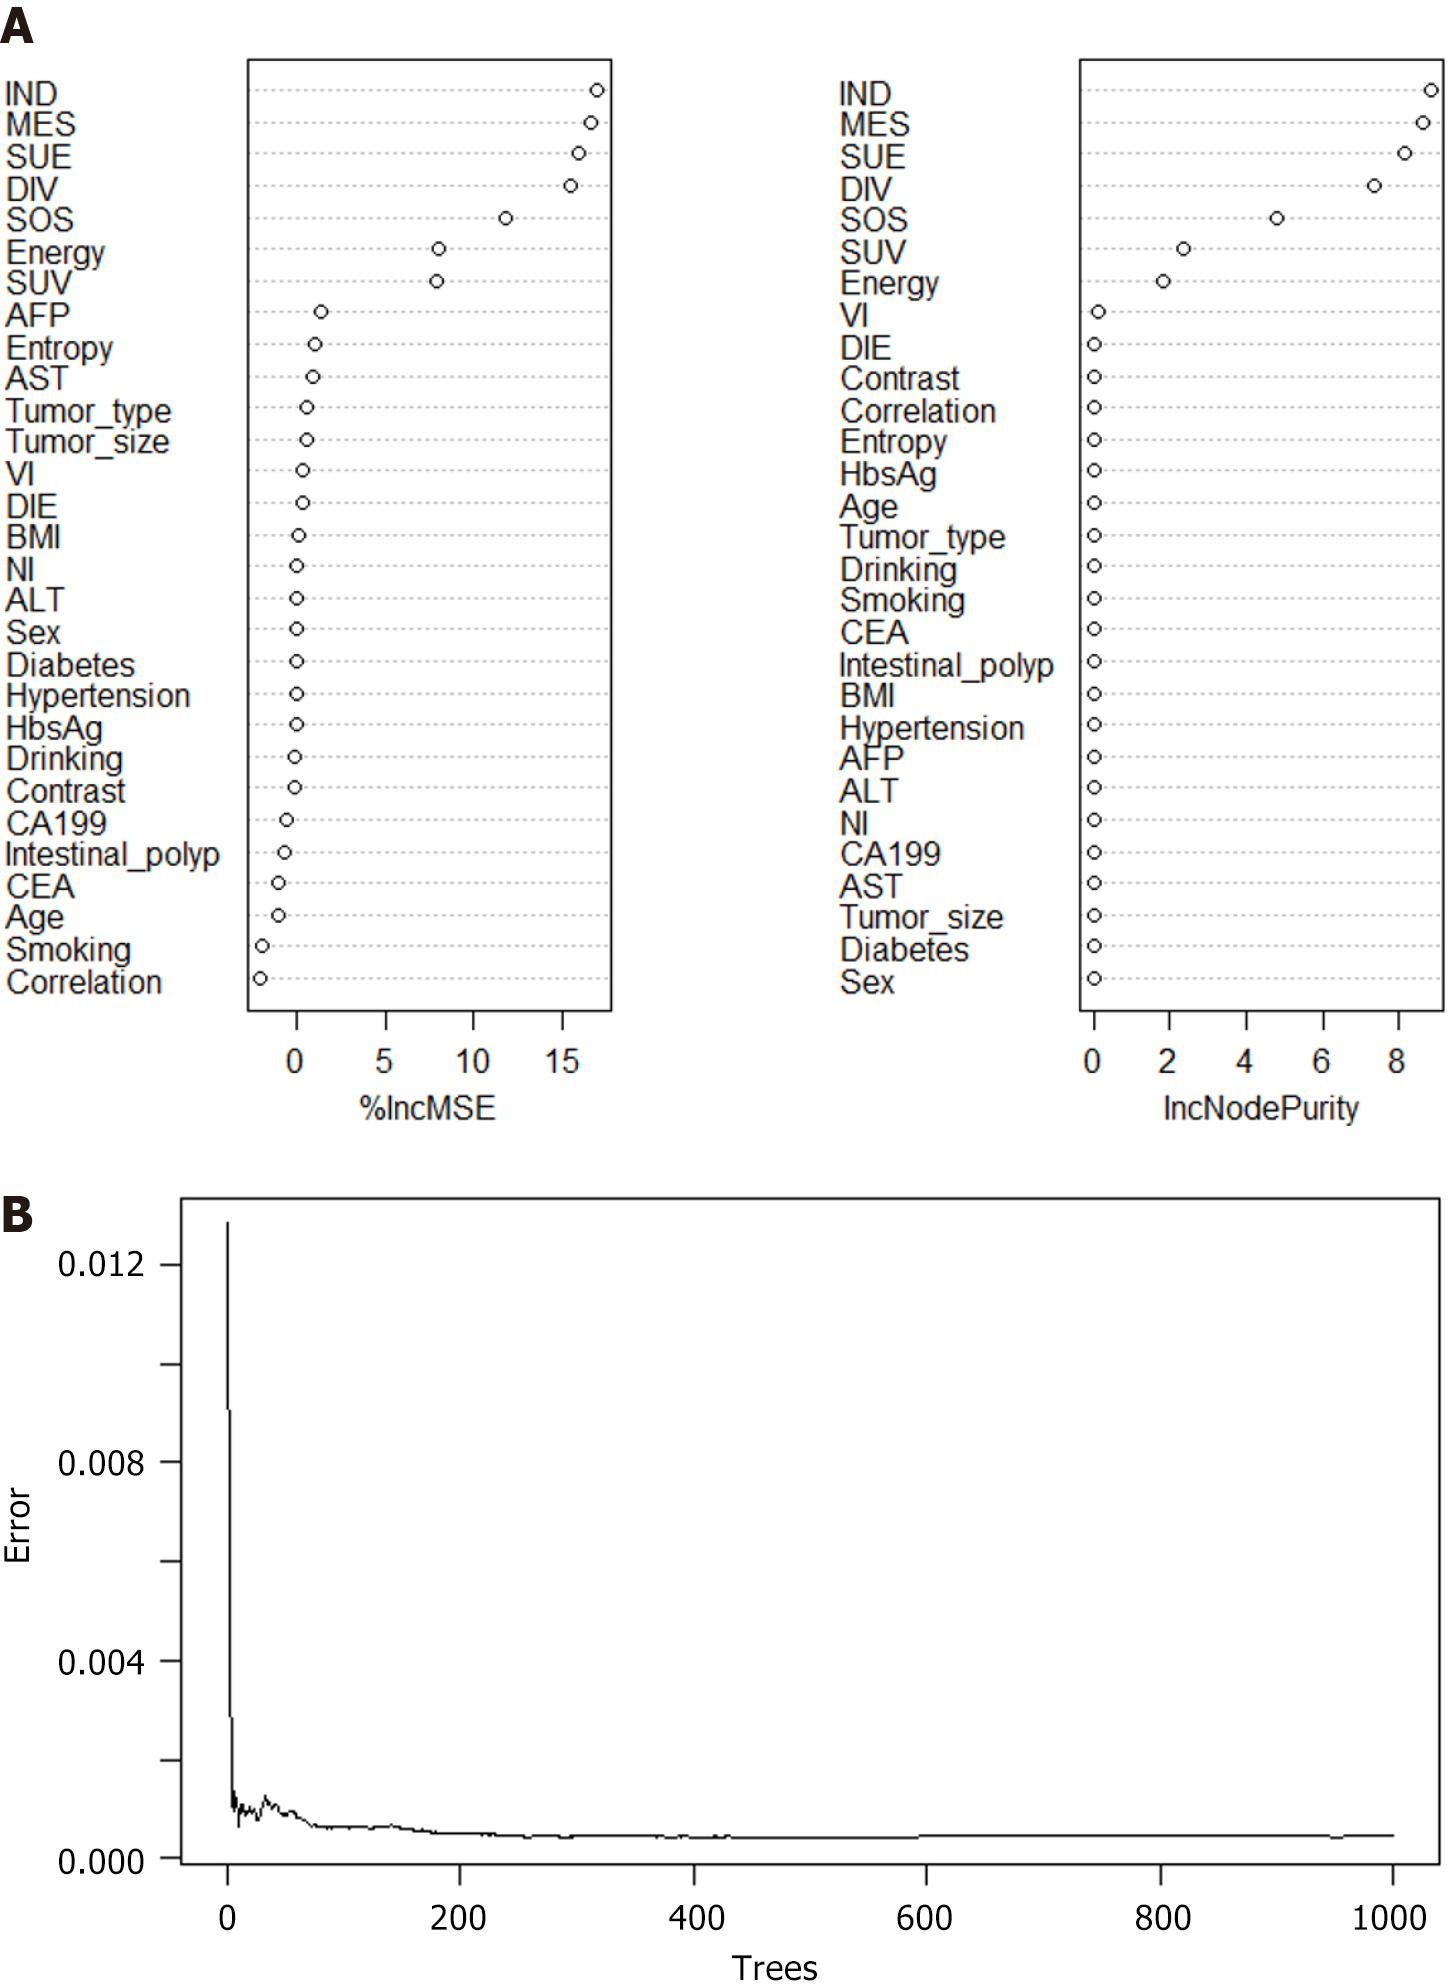
Figure 4 Construction of synchronous liver metastasis prediction model via random forest model.
A: The application prediction model formula of random forest model (RFM) is as follows: C = argmax (∑ (Ci)), where “Ci” represents the type of in prediction for the i-th tree, “C” is the final classification result, and “I” is the number of trees; B: The gravel plot indicates the robustness of the RFM prediction model. IND: Inverse difference; MES: Mean sum; SUV: Sum variance; SUE: Sum entropy; DIV: Difference variance; DIE: Difference entropy; RFM: Random forest model; ANNM: Artificial neural network model; GLRM: Generalized linear regression model; SLM: Synchronous liver metastasis; BMI: Body mass index; AST: Aspartate aminotransferase; ALT: Alanine aminotransferase; CEA: Carcinoembryonic antigen; CA199: Carbohydrate antigen 199; AFP: Alpha-fetoprotein; NI: Neural infiltration; VI: Vascular invasion; HbsAg: Hepatitis B surface antigen.
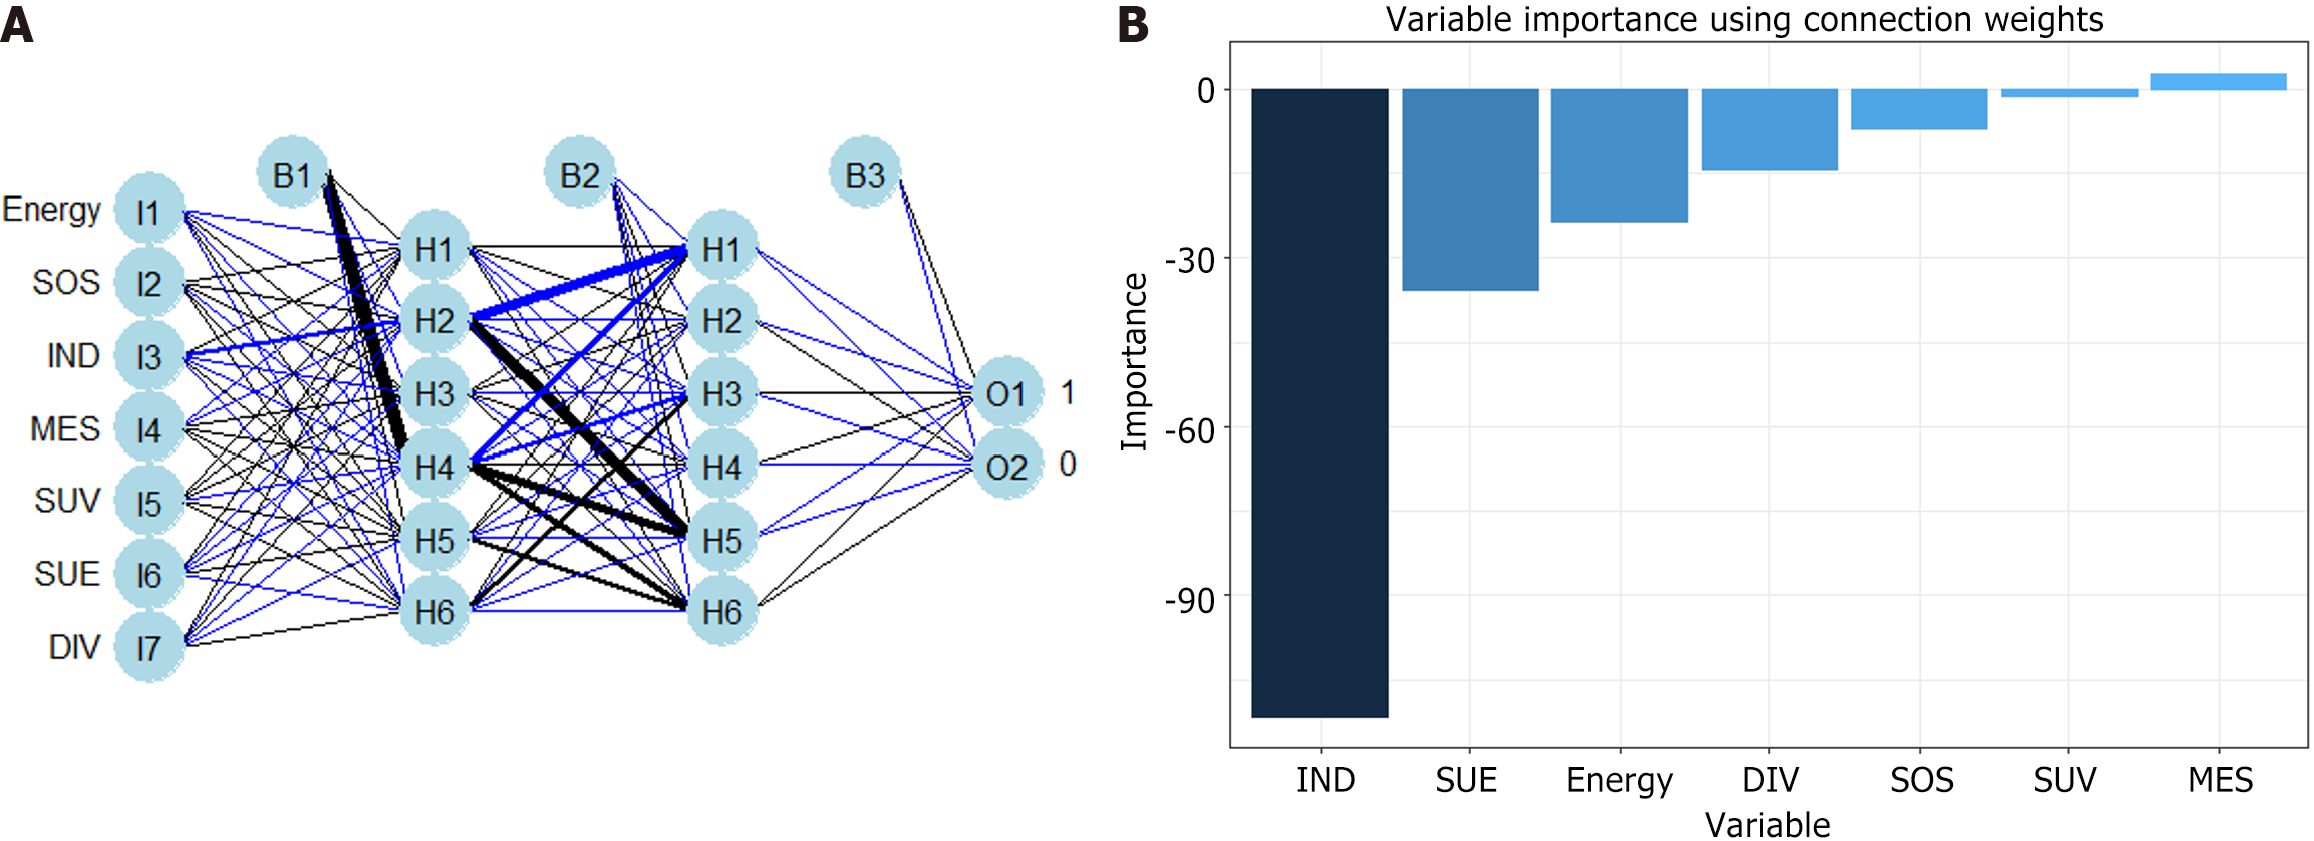
Figure 5 Construction of pulmonary infection prediction model via artificial neural network model.
A: The formula of artificial neural network model is as follows: θ = θ-η × ∇ (θ).J (θ). Among them “η” is the learning rate, “so (θ).J (θ)” represents the gradient change of the loss function [i.e., J(θ)]; B: Variable importance using connection weights for the artificial neural network model. IND: Inverse difference; SUV: Sum variance; SUE: Sum entropy; DIV: Difference variance; SOS: Sum of squares; MES: Mean sum.
Figure 6 Prediction performance of synchronous liver metastasis risk based on different supervised algorithm.
A: Decision curve analysis (DCA) for three prediction models in the training set; B: DCA for three prediction models in the testing set. RFM: Random forest model; ANNM: Artificial neural network model; GLRM: Generalized linear regression model.
- Citation: Yang KF, Li SJ, Xu J, Zheng YB. Machine learning prediction model for gray-level co-occurrence matrix features of synchronous liver metastasis in colorectal cancer. World J Gastrointest Surg 2024; 16(6): 1571-1581
- URL: https://www.wjgnet.com/1948-9366/full/v16/i6/1571.htm
- DOI: https://dx.doi.org/10.4240/wjgs.v16.i6.1571


