Copyright
©The Author(s) 2024.
World J Gastrointest Surg. May 27, 2024; 16(5): 1320-1327
Published online May 27, 2024. doi: 10.4240/wjgs.v16.i5.1320
Published online May 27, 2024. doi: 10.4240/wjgs.v16.i5.1320
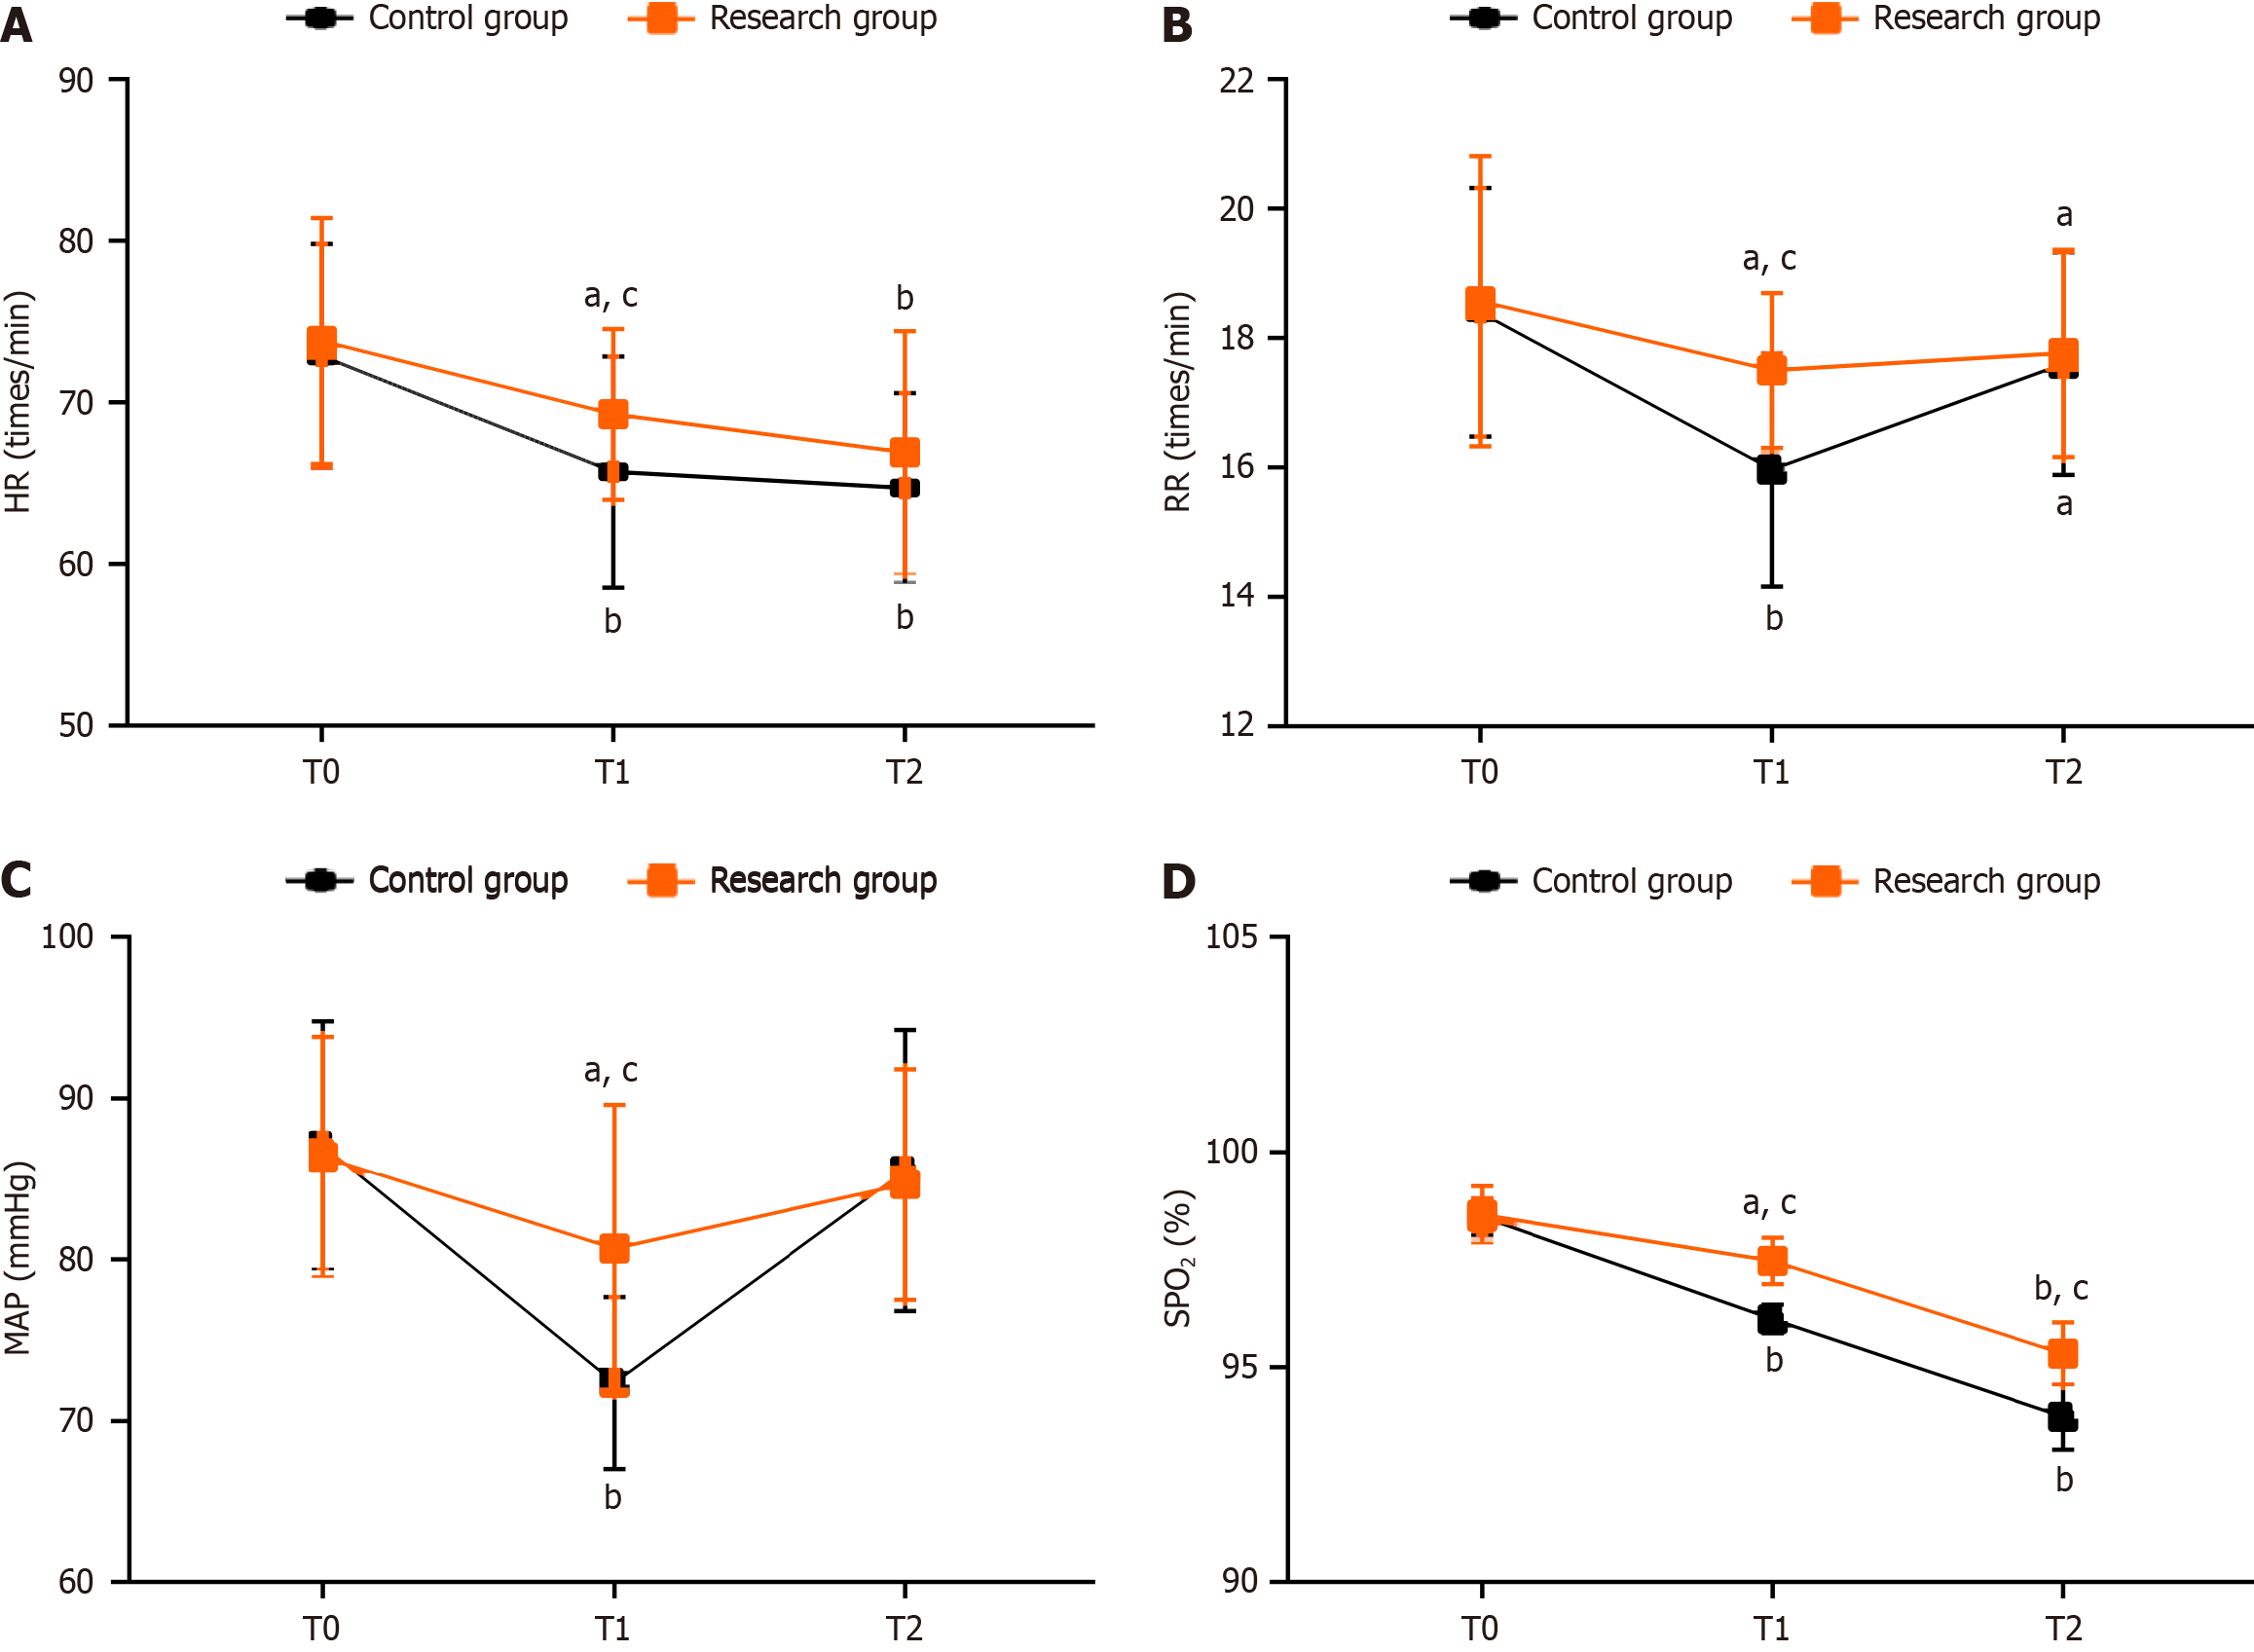
Figure 1 Vital signs of two groups of obese patients undergoing gastrointestinal surgery.
A: Heart rate at different time points in the two groups; B: Respiratory rate at different time points in the two groups; C: Mean arterial pressure at different time points in the two groups; D: Blood oxygen saturation at different time points in the two groups. HR: Heart rate; RR: Respiratory rate; MAP: Mean arterial pressure; SpO2: Blood oxygen saturation. aP < 0.05, bP < 0.01 vs T0; cP < 0.05 vs Con.
Figure 2 Anesthesia indices of the two groups of obese patients undergoing gastrointestinal surgery.
A: The research group showed a markedly shorter anesthesia induction time than the control group; B: The research group showed a significantly shorter anesthesia recovery time than the control group; C: The research group showed an obviously shorter postanesthesia care unit discharge time than the control group. aP < 0.05, bP < 0.01 vs T0.
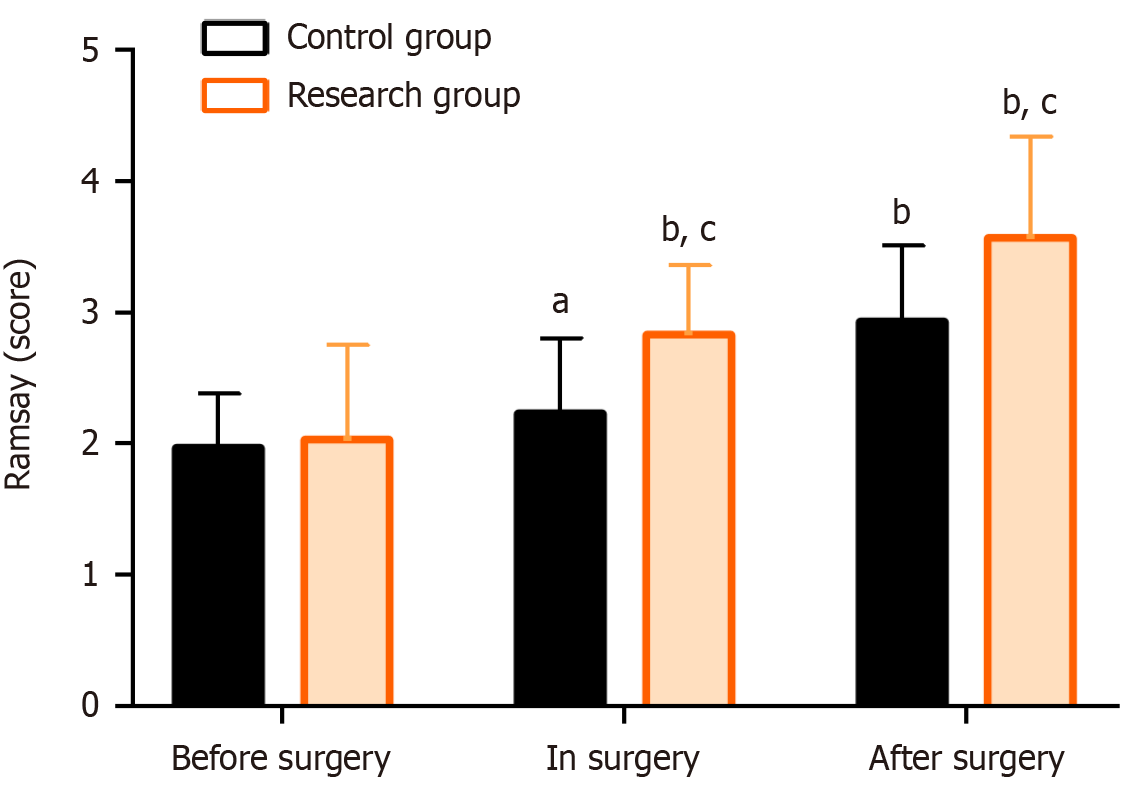
Figure 3 Sedative effects on the two groups of obese patients undergoing gastrointestinal surgery.
aP < 0.05, bP < 0.01 vs T0; cP < 0.05 vs Con.
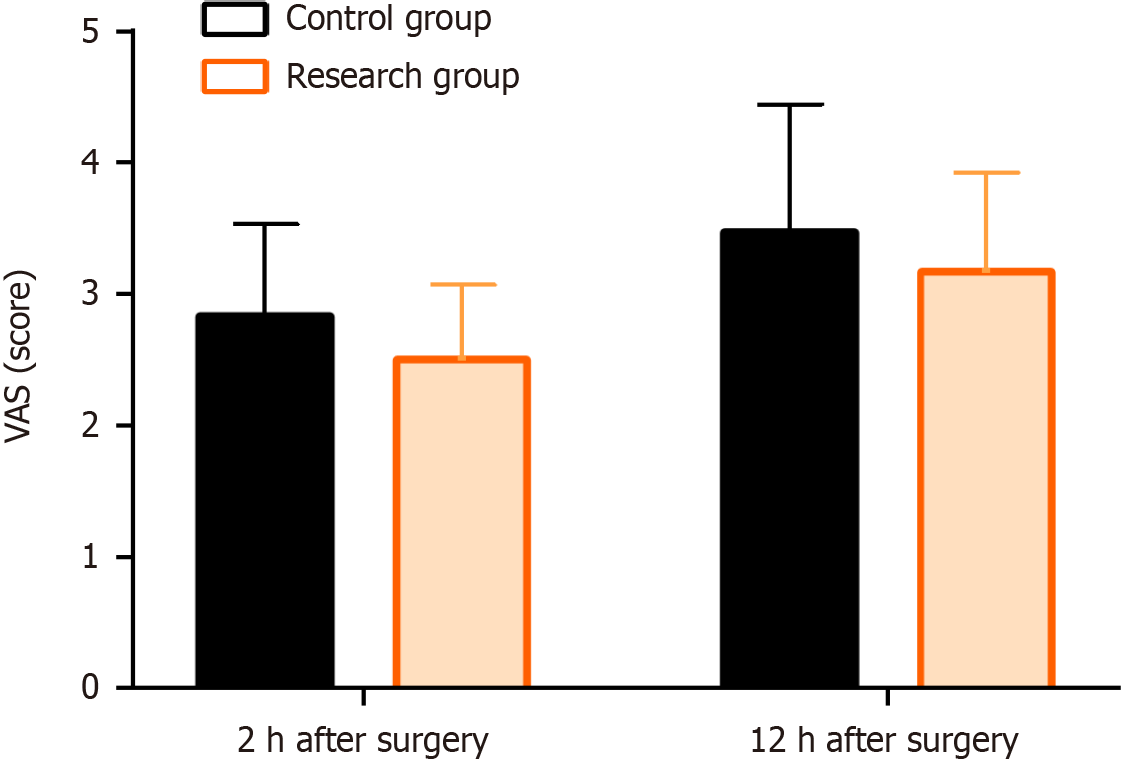
Figure 4 Postoperative pain visual analog scale scores of the two groups of obese patients undergoing gastrointestinal surgery.
VAS: Visual analog scale.
- Citation: Deng YF, Jiang XR, Feng ZG. Comparative observation of the effectiveness and safety of remimazolam besylate versus dexmedetomidine in gastrointestinal surgery in obese patients. World J Gastrointest Surg 2024; 16(5): 1320-1327
- URL: https://www.wjgnet.com/1948-9366/full/v16/i5/1320.htm
- DOI: https://dx.doi.org/10.4240/wjgs.v16.i5.1320


