Copyright
©The Author(s) 2024.
World J Gastrointest Surg. May 27, 2024; 16(5): 1301-1310
Published online May 27, 2024. doi: 10.4240/wjgs.v16.i5.1301
Published online May 27, 2024. doi: 10.4240/wjgs.v16.i5.1301
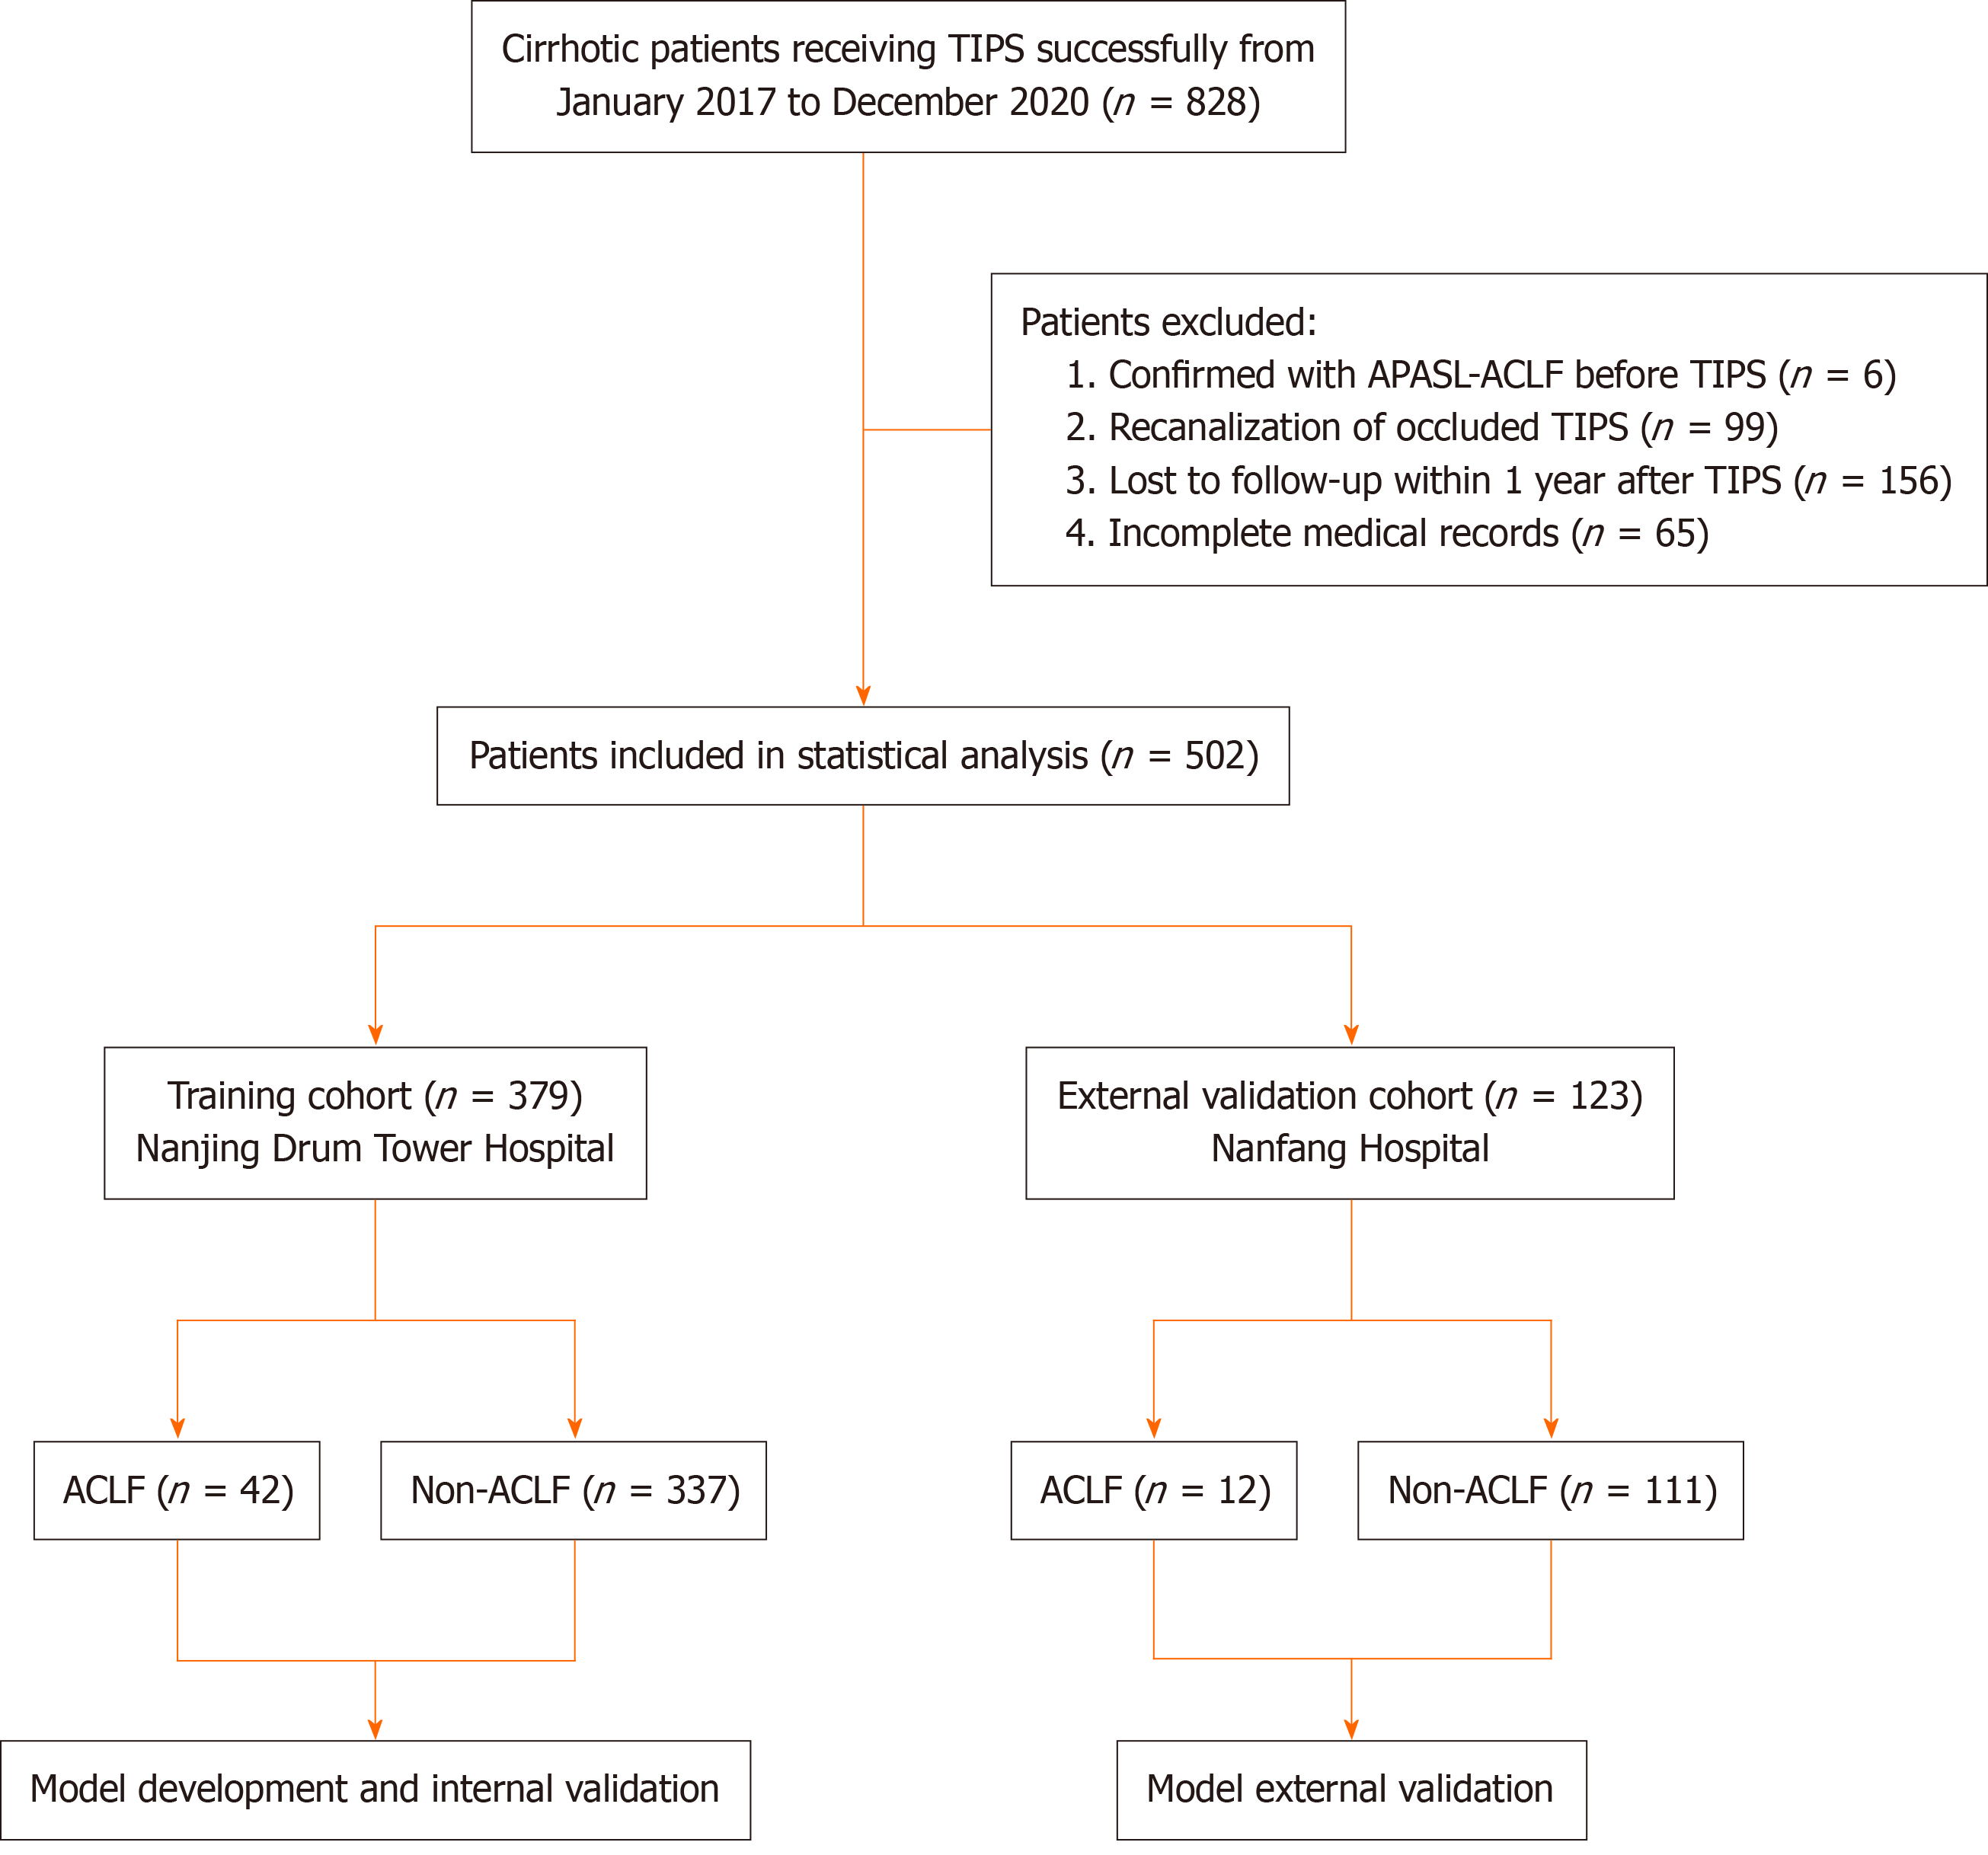
Figure 1 Patients’ flowchart.
TIPS: Transjugular intrahepatic portosystemic shunt; APASL: Asian Pacific Association for the Study of the Liver; ACLF: Acute-on-chronic liver failure.
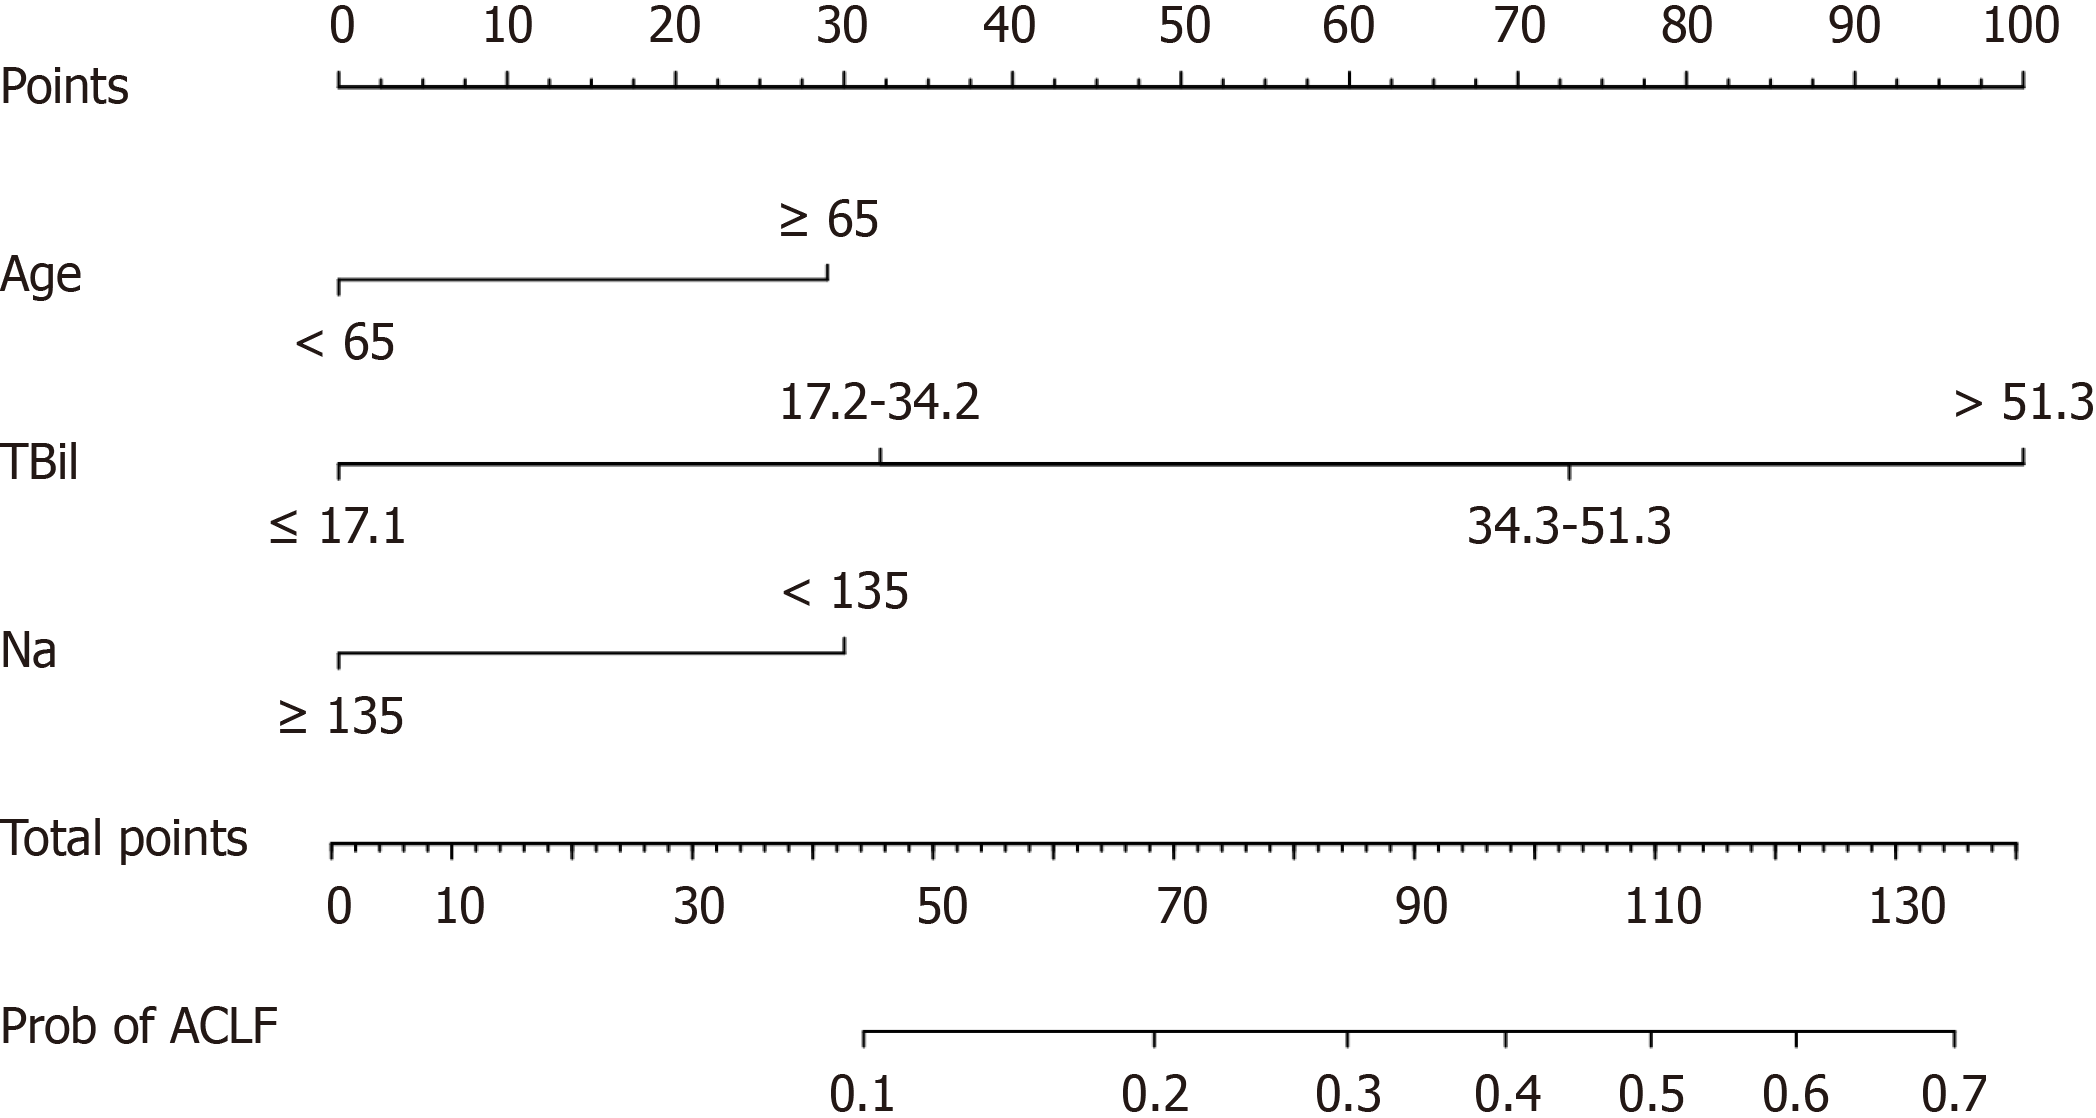
Figure 2 The nomogram model for predicting the incidence of acute-on-chronic liver failure within 1 year after transjugular intrahepatic portosystemic shunt.
ACLF: Acute-on-chronic liver failure; TBil: Total bilirubin; Na: Sodium.
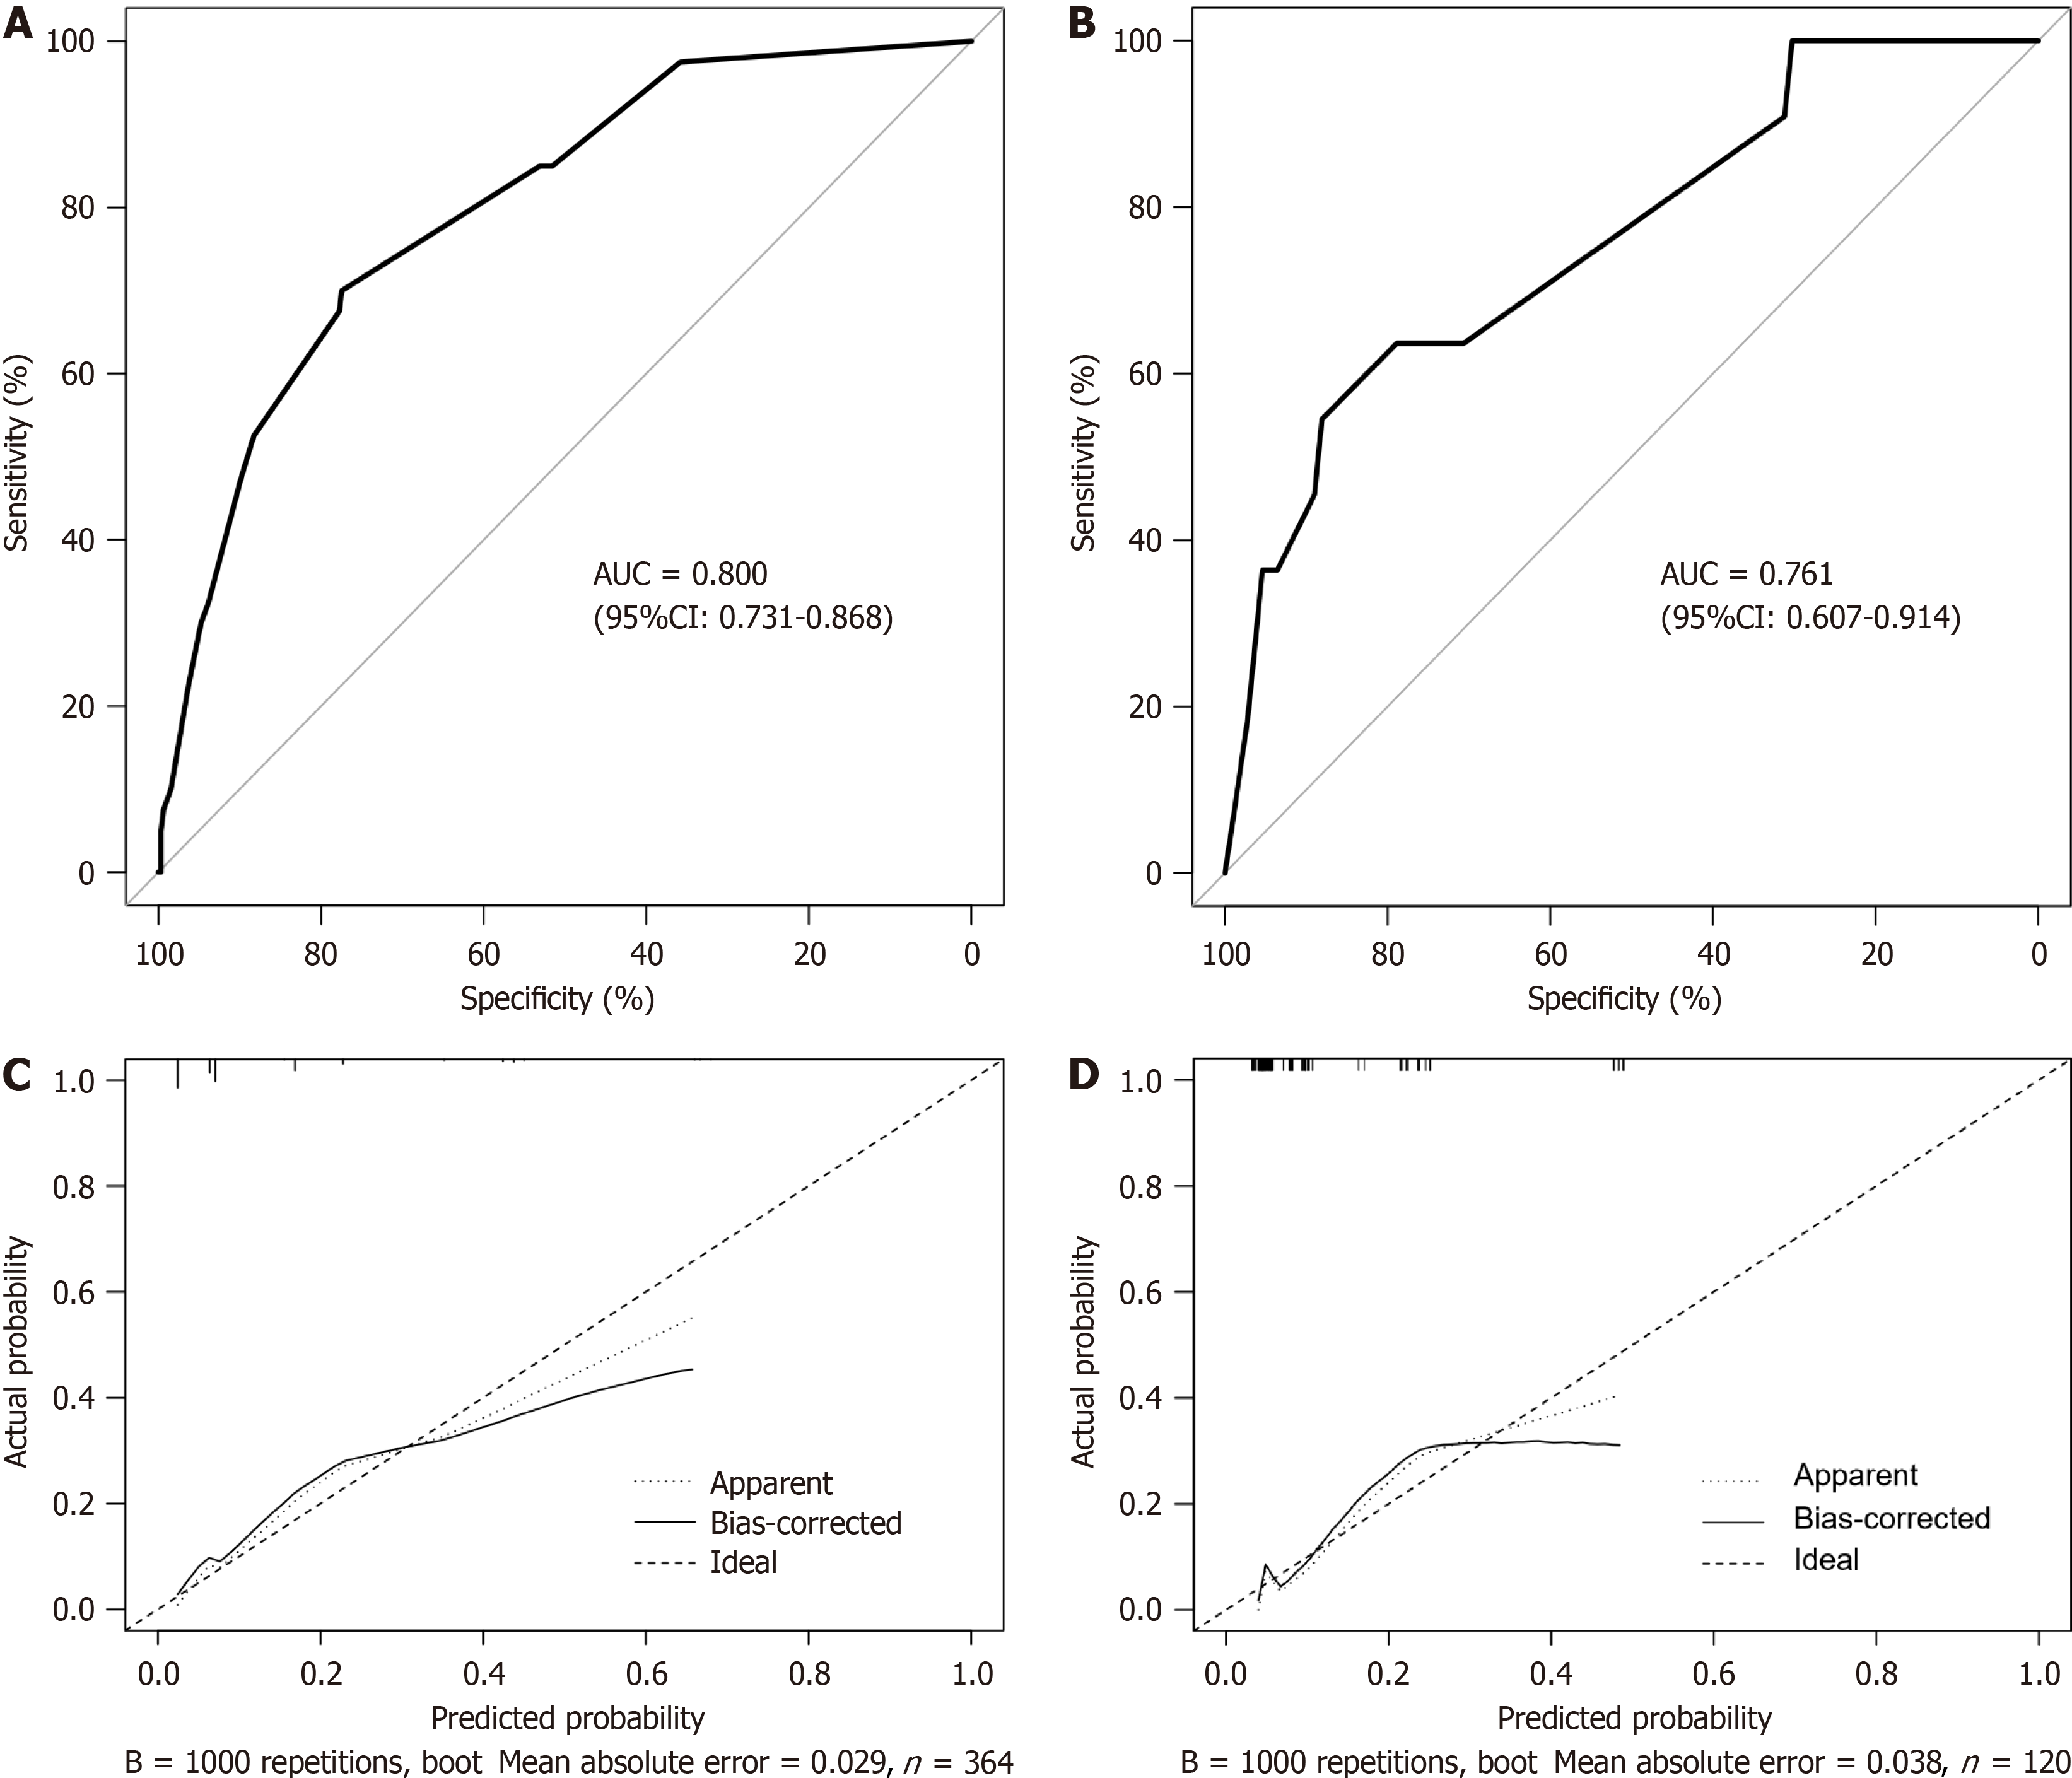
Figure 3 Receiver operating characteristic curves and the calibration plots of the model for predicting the incidence of acute-on-chronic liver failure within 1 year after transjugular intrahepatic portosystemic shunt.
A: In the training cohort, the area under the receiver operating characteristic curve (AUC) of the model was 0.800 [95% confidence interval (95%CI): 0.731-0.868]; B: In the validation cohort, the AUC of the model was 0.761 (95%CI: 0.607-0.914); C and D: The calibration plots in the training and validation cohorts. The predicted probability of the model was plotted on the x-axis; the actual probability was plotted on the y-axis. An ideal calibration plot is indicated by a 45° diagonal line. AUC: Area under the receiver operating characteristic curve; 95%CI: 95% confidence interval.
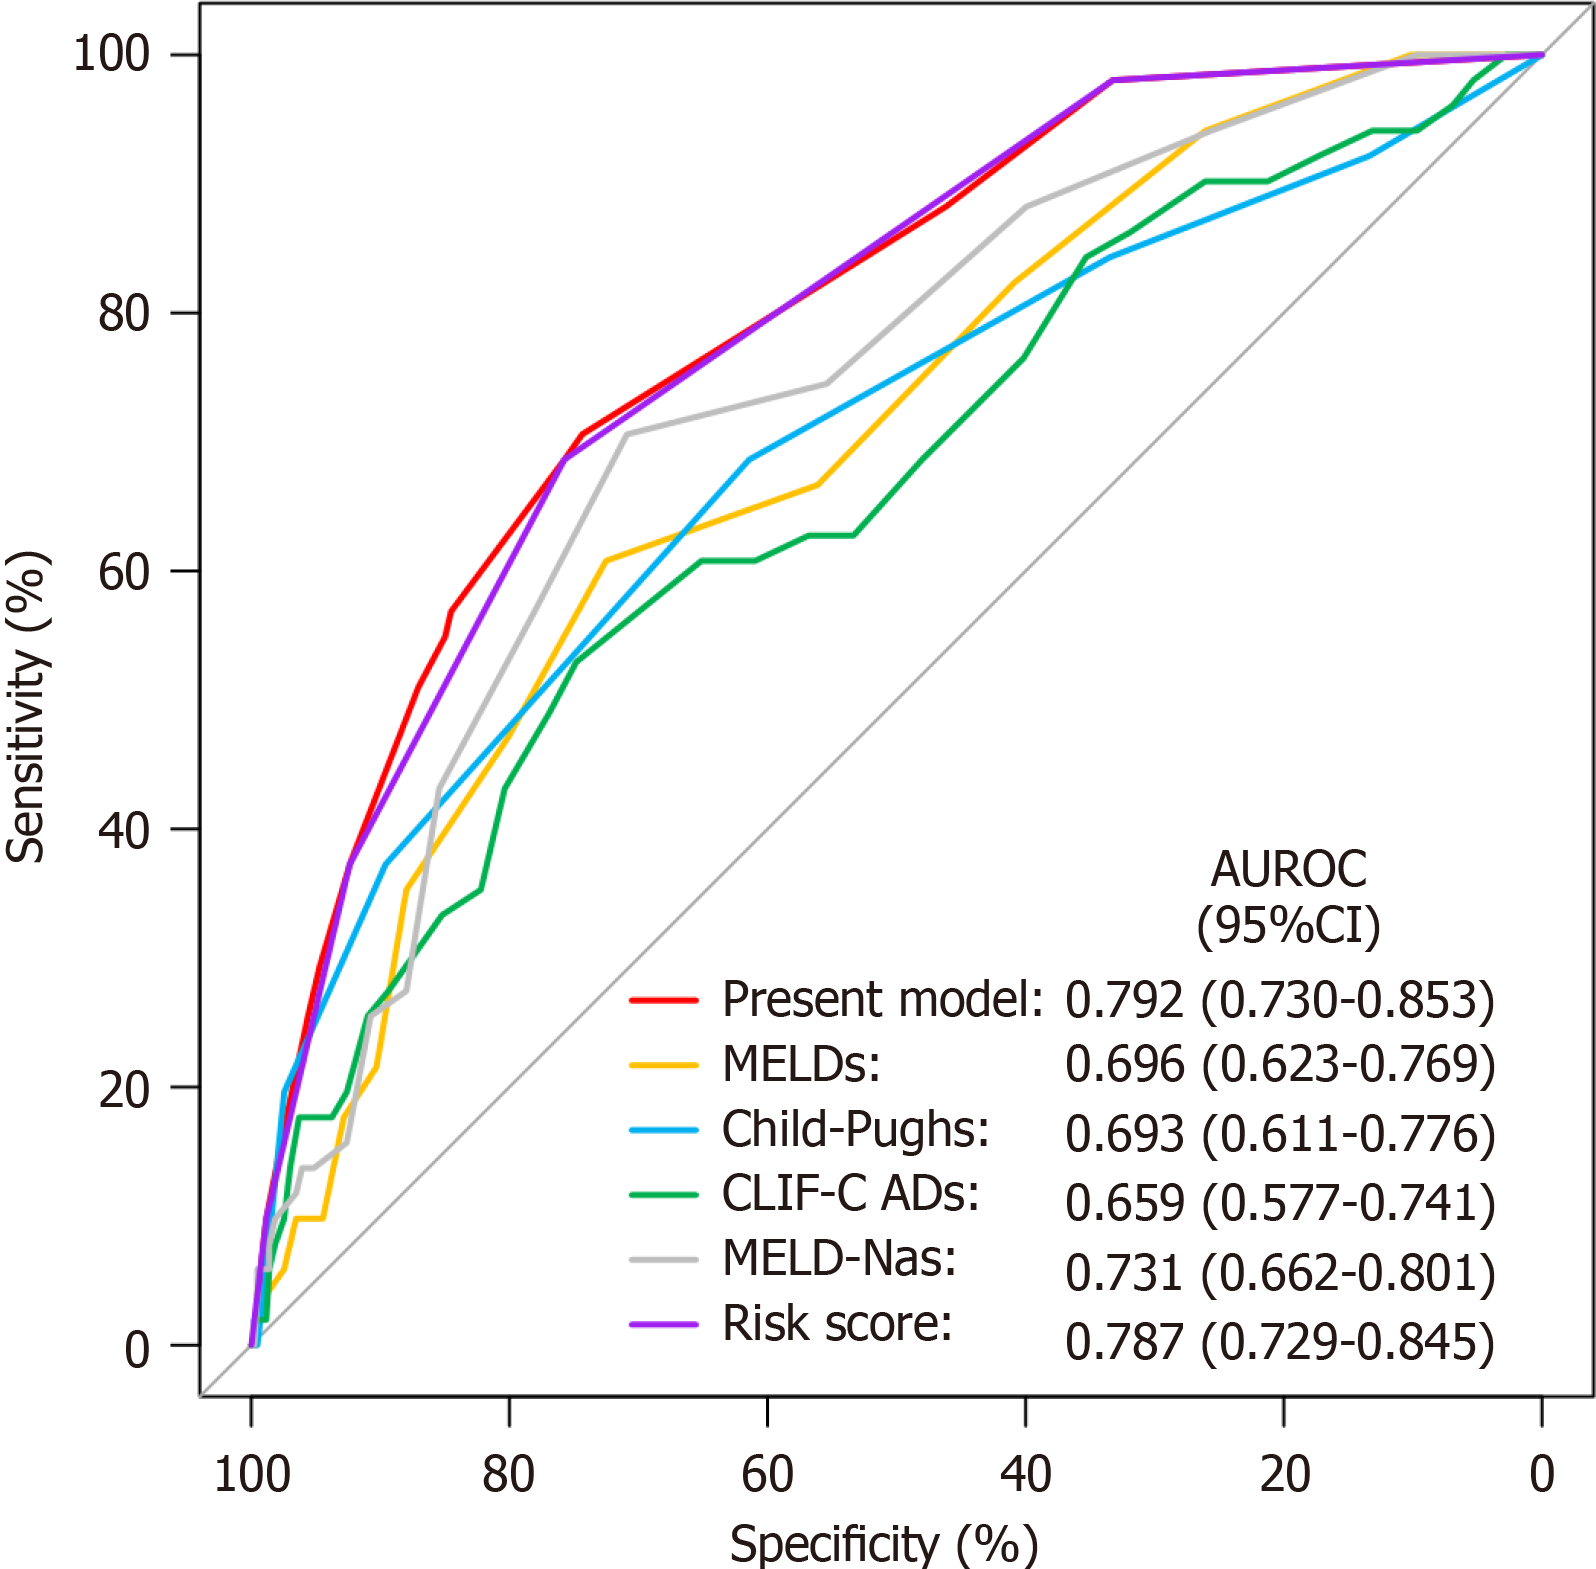
Figure 4 Receiver operating characteristic curves of the prediction model, risk score, and four liver function scoring systems for the prediction of the incidence of acute-on-chronic liver failure within 1 year after transjugular intrahepatic portosystemic shunt in the entire cohort.
MELDs: Model for end-stage liver disease score; Child-Pughs: Child-Pugh score; CLIF-C ADs: Chronic Liver Failure Consortium acute decompensation score; MELD-Nas: MELD-Na score; AUROC: Area under the receiver operating characteristic curve; 95%CI: 95% confidence interval.
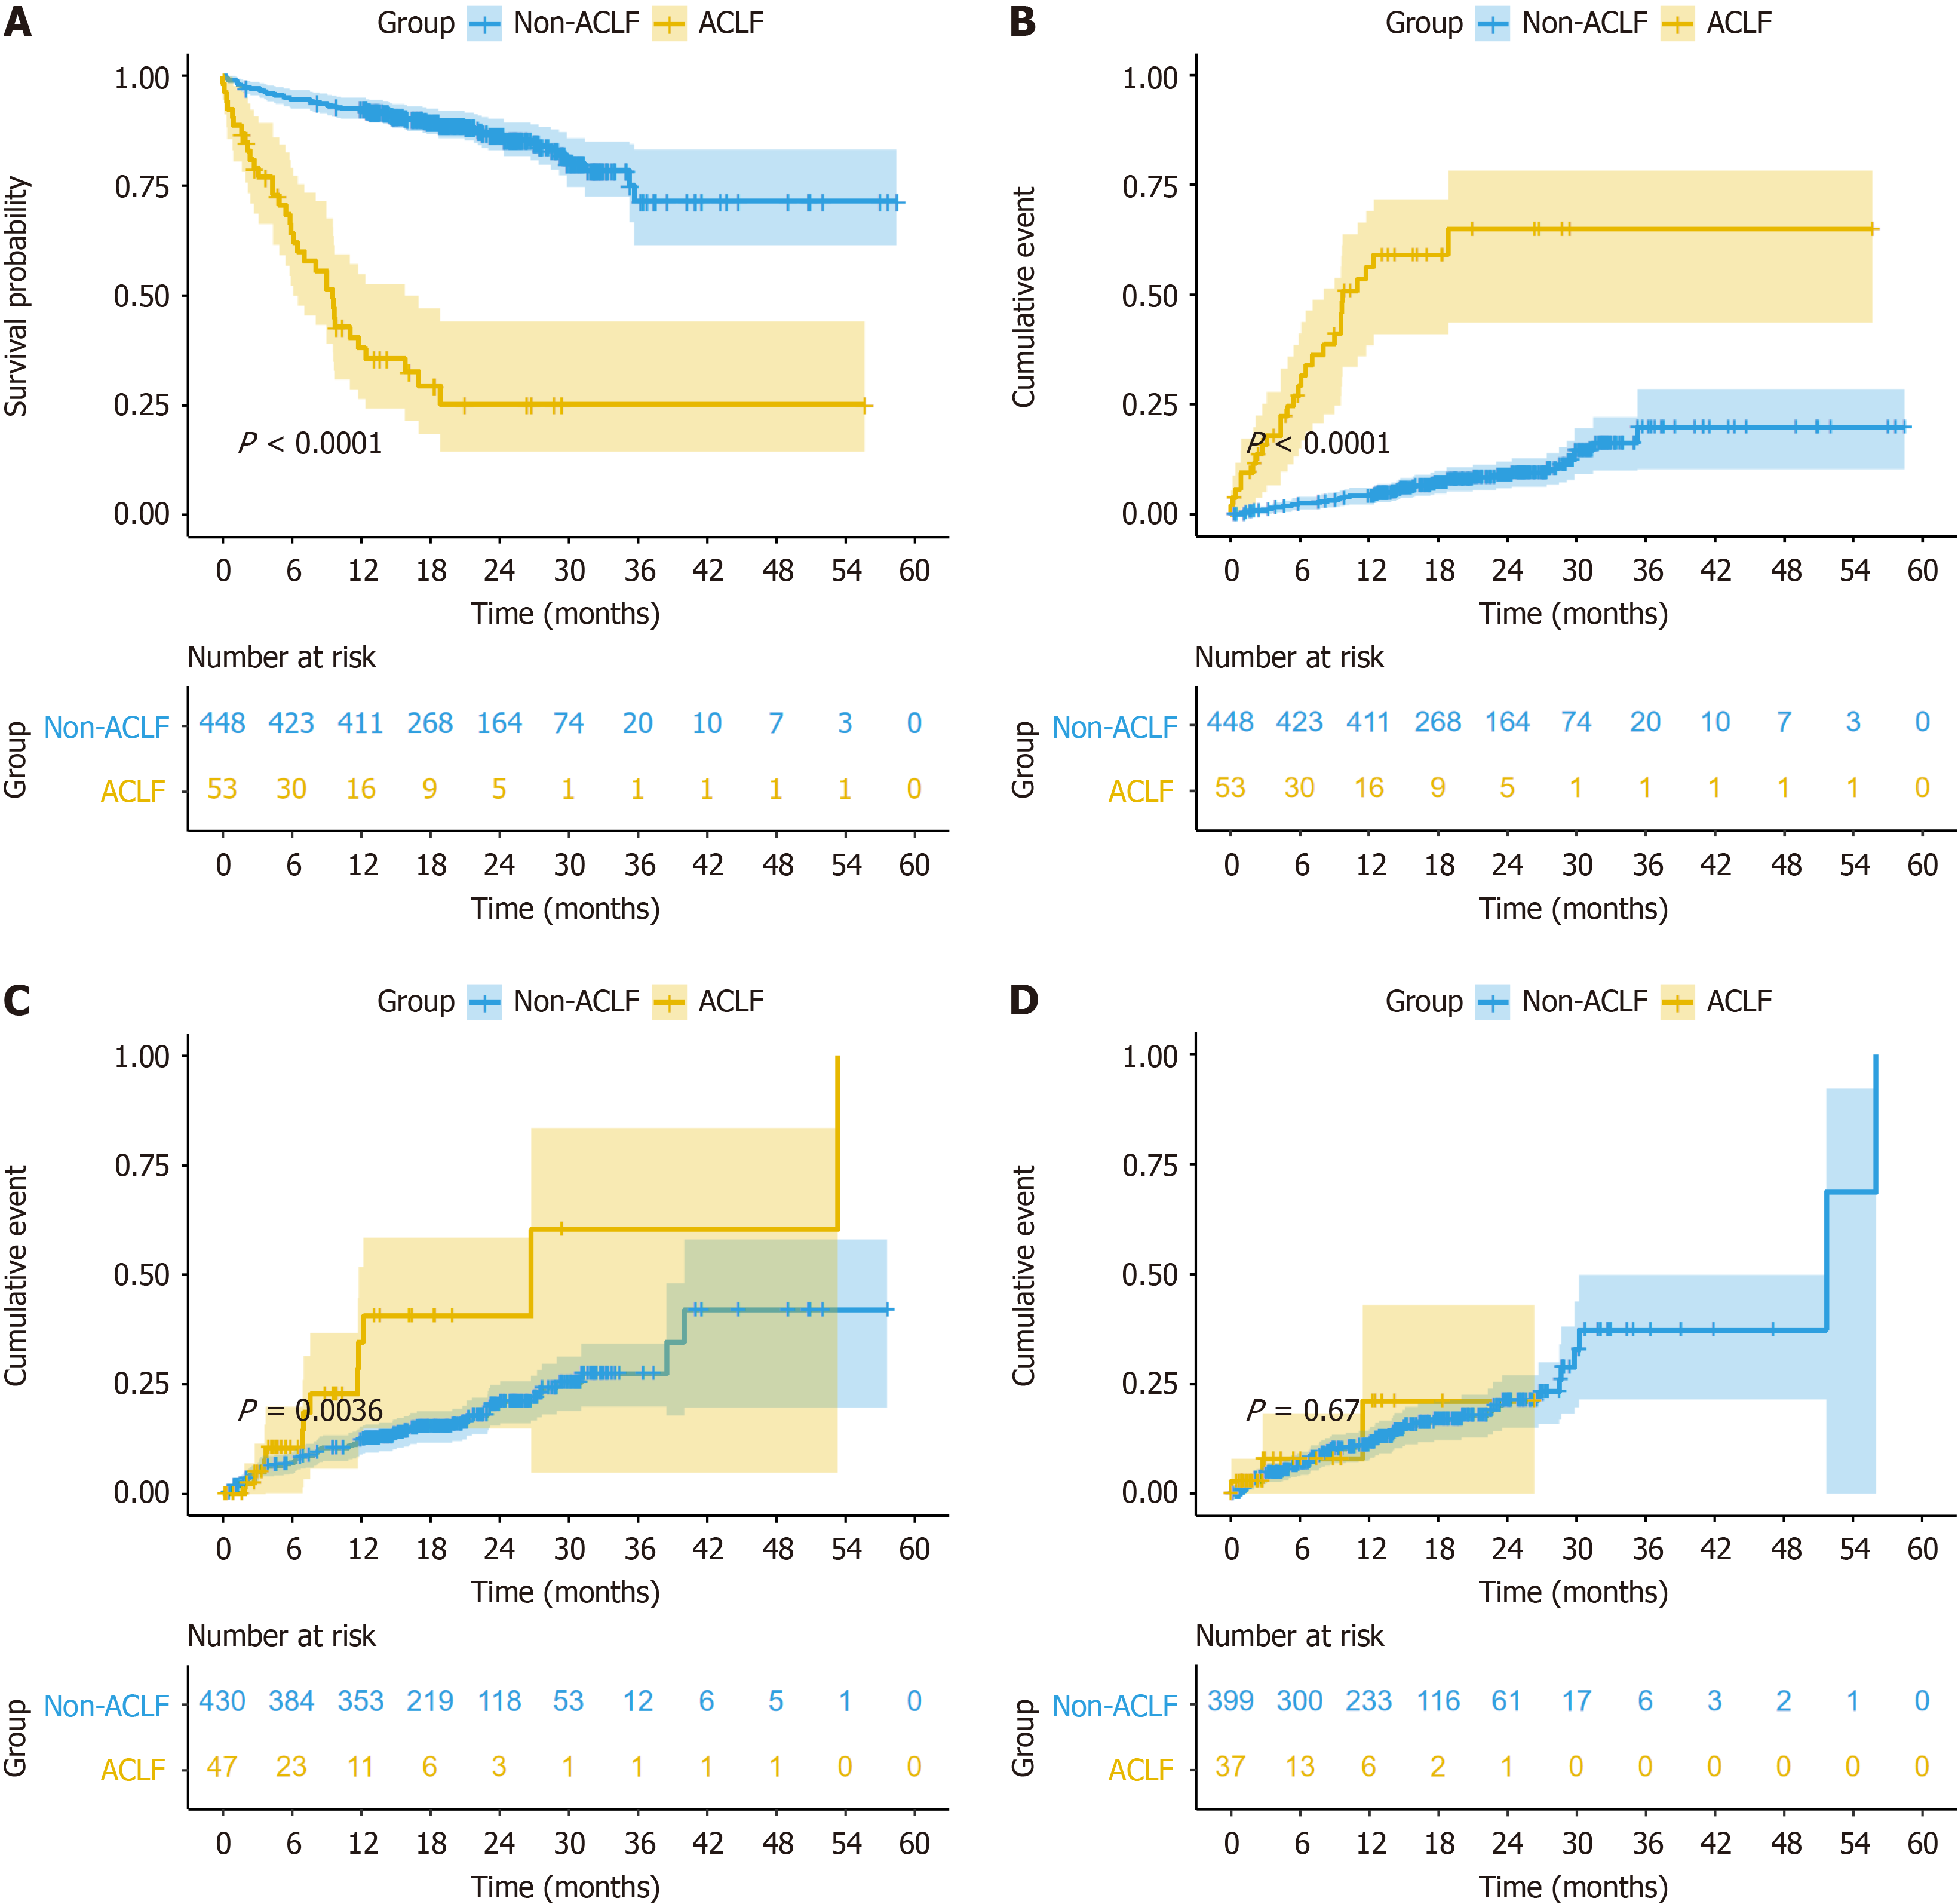
Figure 5 The prognosis between the acute-on-chronic liver failure group and the non-acute-on-chronic liver failure group.
A: The Kaplan-Meier curve shows the probability of survival; B: The Kaplan-Meier curve shows the liver disease-related mortality rates; C: The Kaplan-Meier curve shows the rebleeding rates; D: The Kaplan-Meier curve shows the probability of stent stenosis. ACLF: Acute-on-chronic liver failure.
- Citation: Zhang W, Jin YN, Sun C, Zhang XF, Li RQ, Yin Q, Chen JJ, Zhuge YZ. Development and validation of a predictive model for acute-on-chronic liver failure after transjugular intrahepatic portosystemic shunt. World J Gastrointest Surg 2024; 16(5): 1301-1310
- URL: https://www.wjgnet.com/1948-9366/full/v16/i5/1301.htm
- DOI: https://dx.doi.org/10.4240/wjgs.v16.i5.1301


