Copyright
©The Author(s) 2024.
World J Gastrointest Surg. May 27, 2024; 16(5): 1259-1270
Published online May 27, 2024. doi: 10.4240/wjgs.v16.i5.1259
Published online May 27, 2024. doi: 10.4240/wjgs.v16.i5.1259
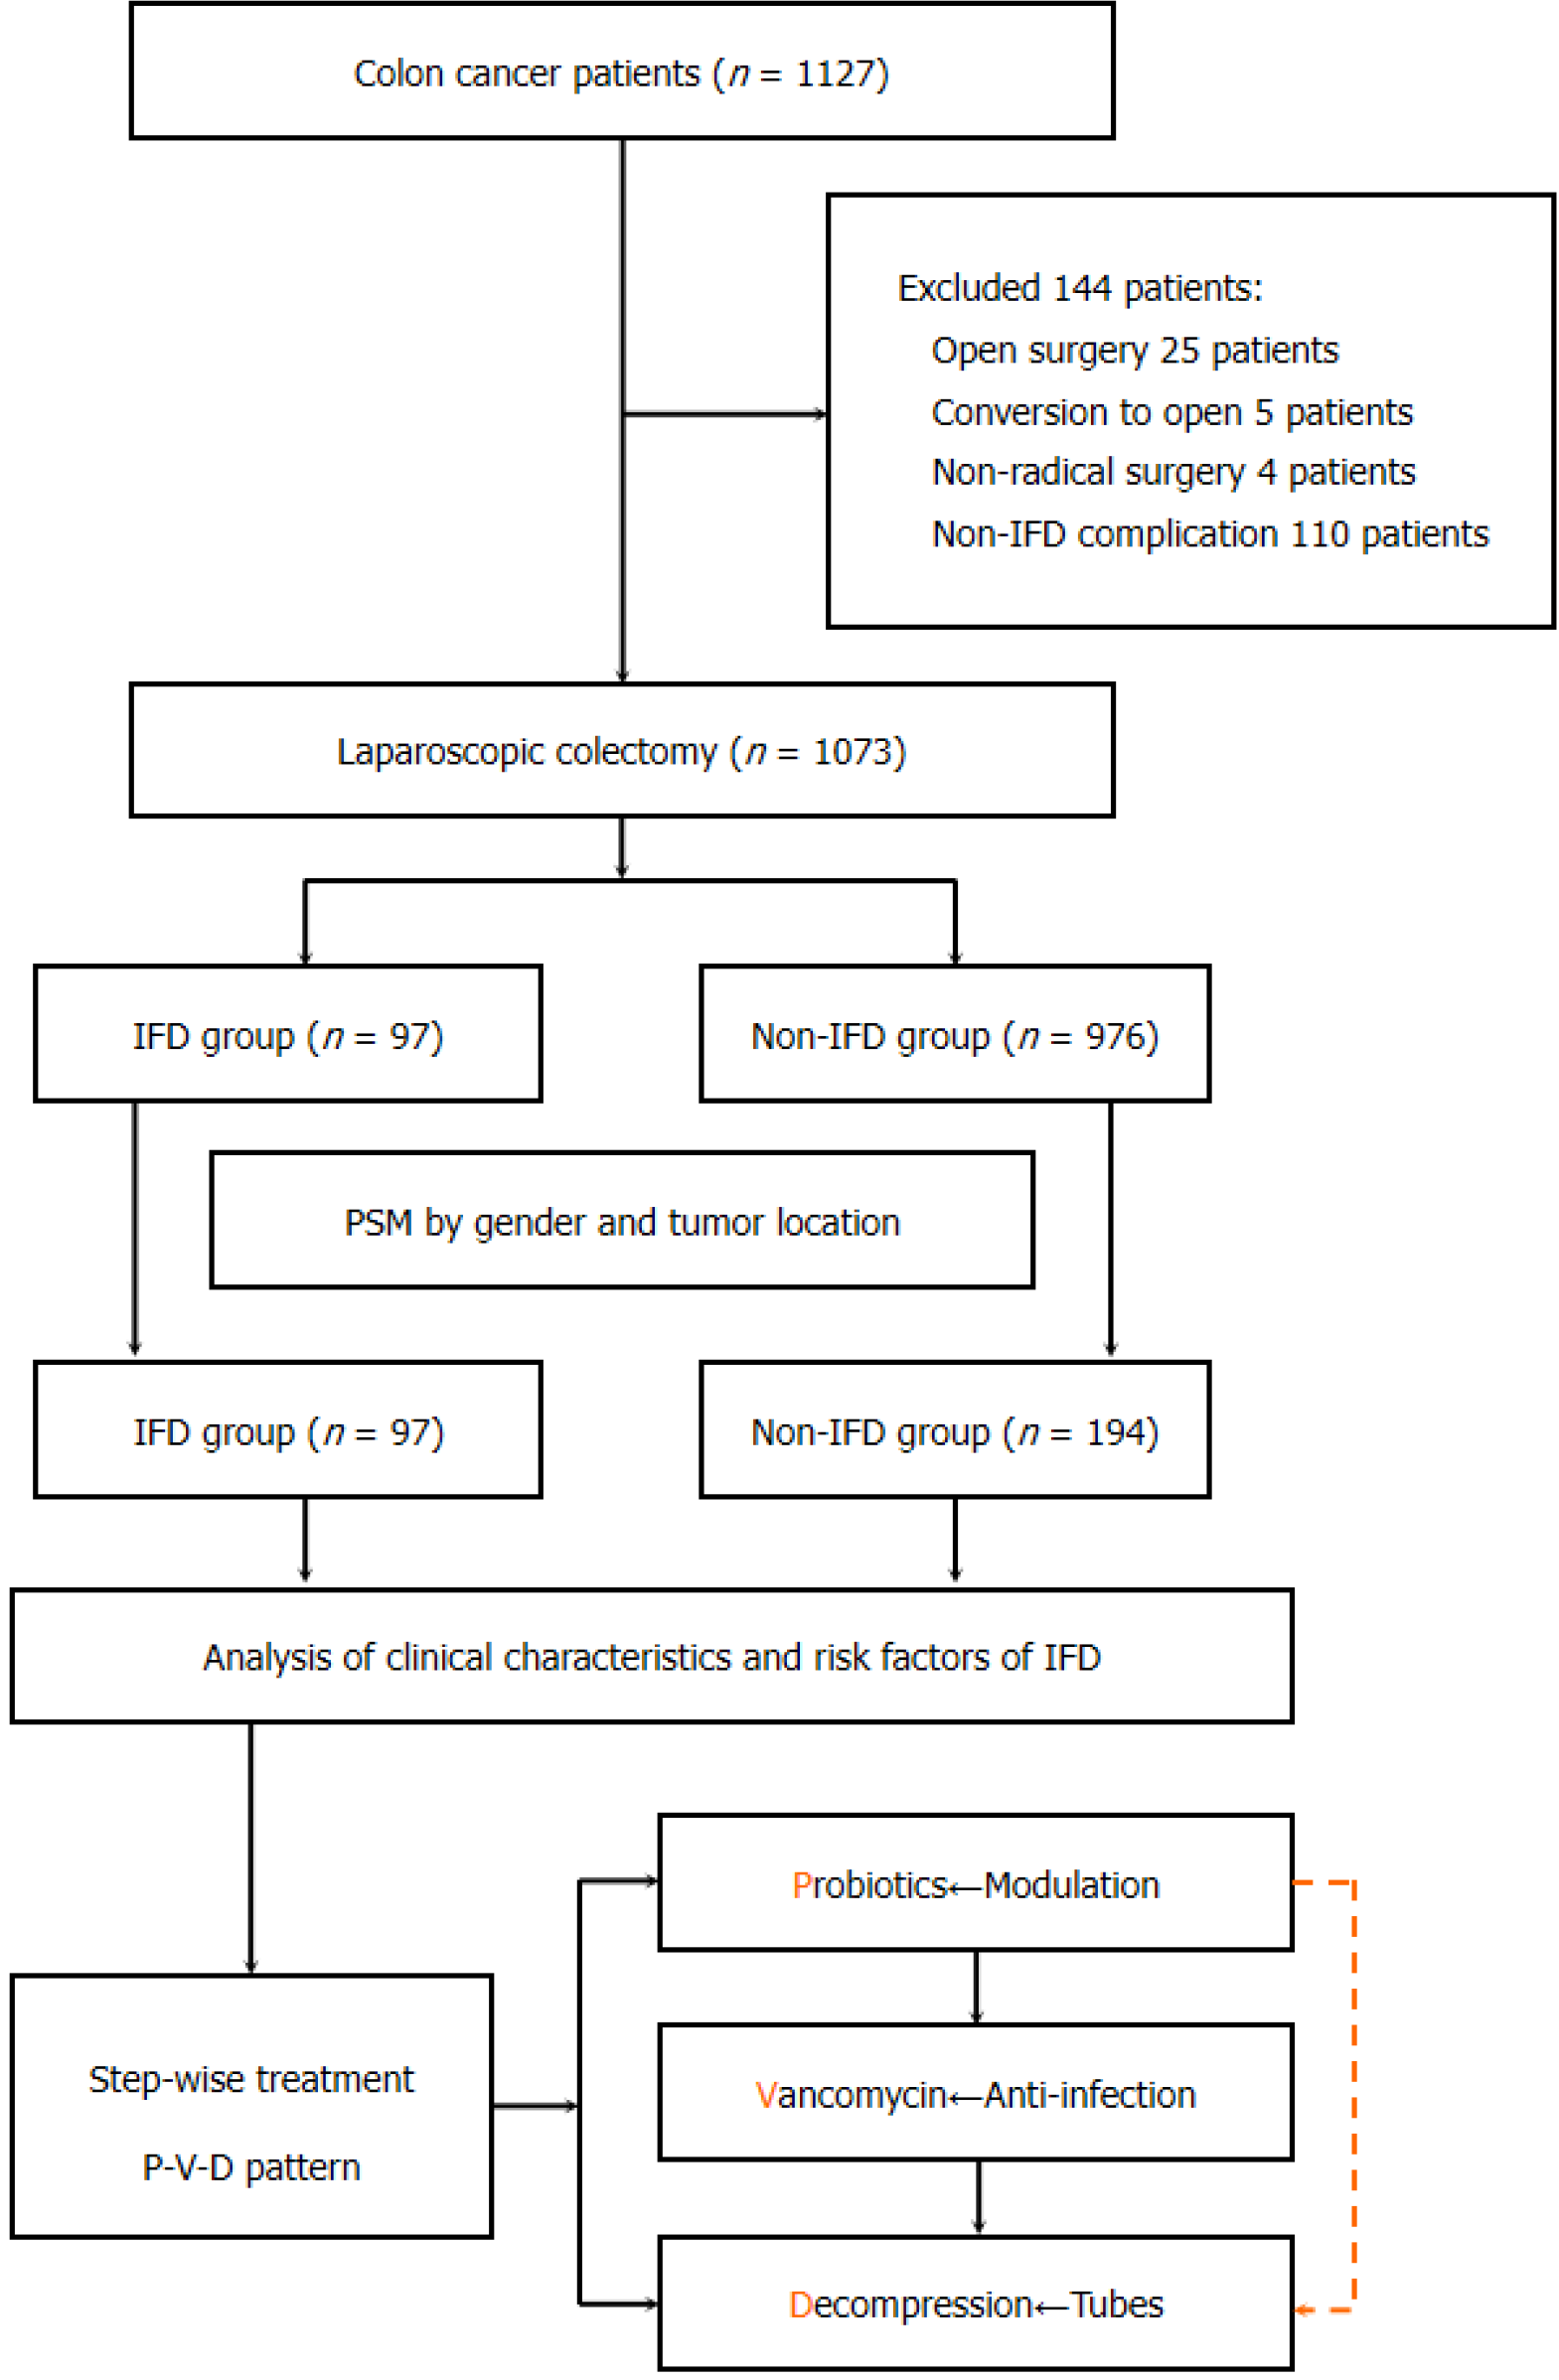
Figure 1 The flowchart of this study.
P-V-D: Probiotics-Vancomycin-Decompression; PSM: Propensity score matching; IFD: Intestinal flora disorder.
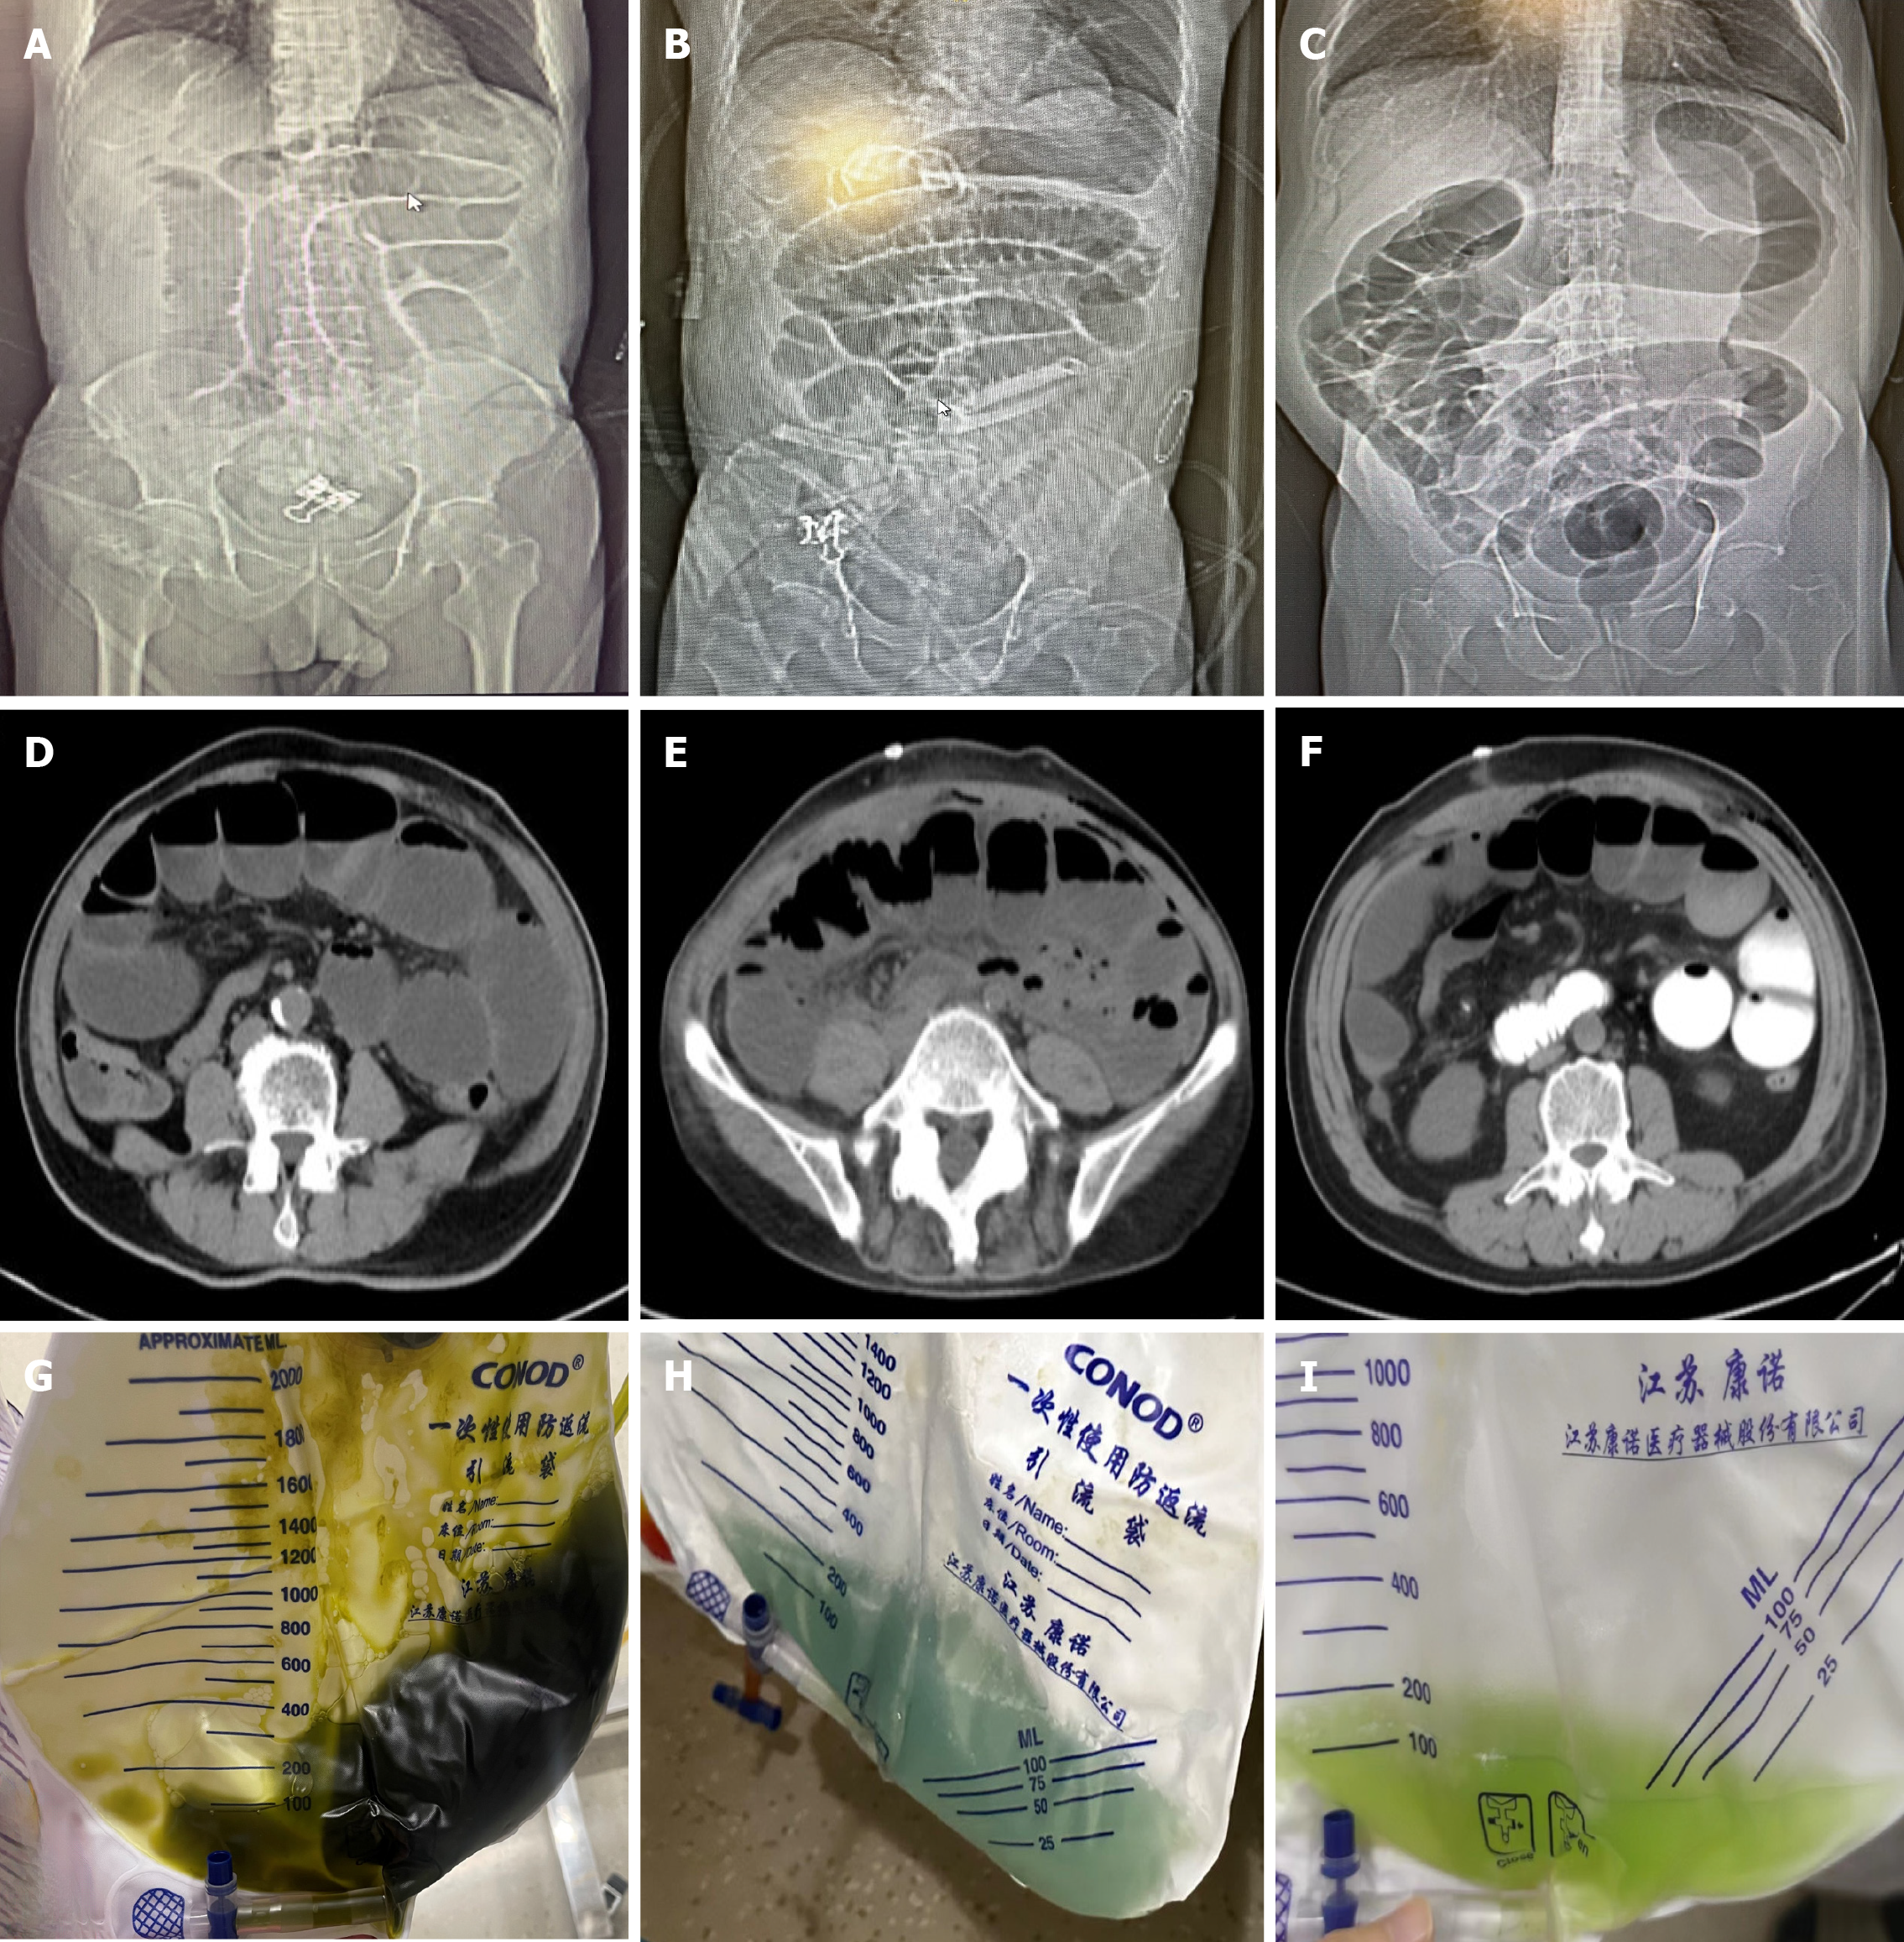
Figure 2 The typical images of patients with intestinal flora disorder.
A-C: Depict typical abdominal X-ray findings of intestinal flora disorder patients, with extremely enlarged intestine; D-F: Represent classic computed tomography images, extensive intestinal gas and fluid accumulation are evident within the small bowel, accompanied by the presence of an air-fluid level; G-I: Represent the typical colour of the tube drainage, that are dark brown, cerulean blue and grass green.
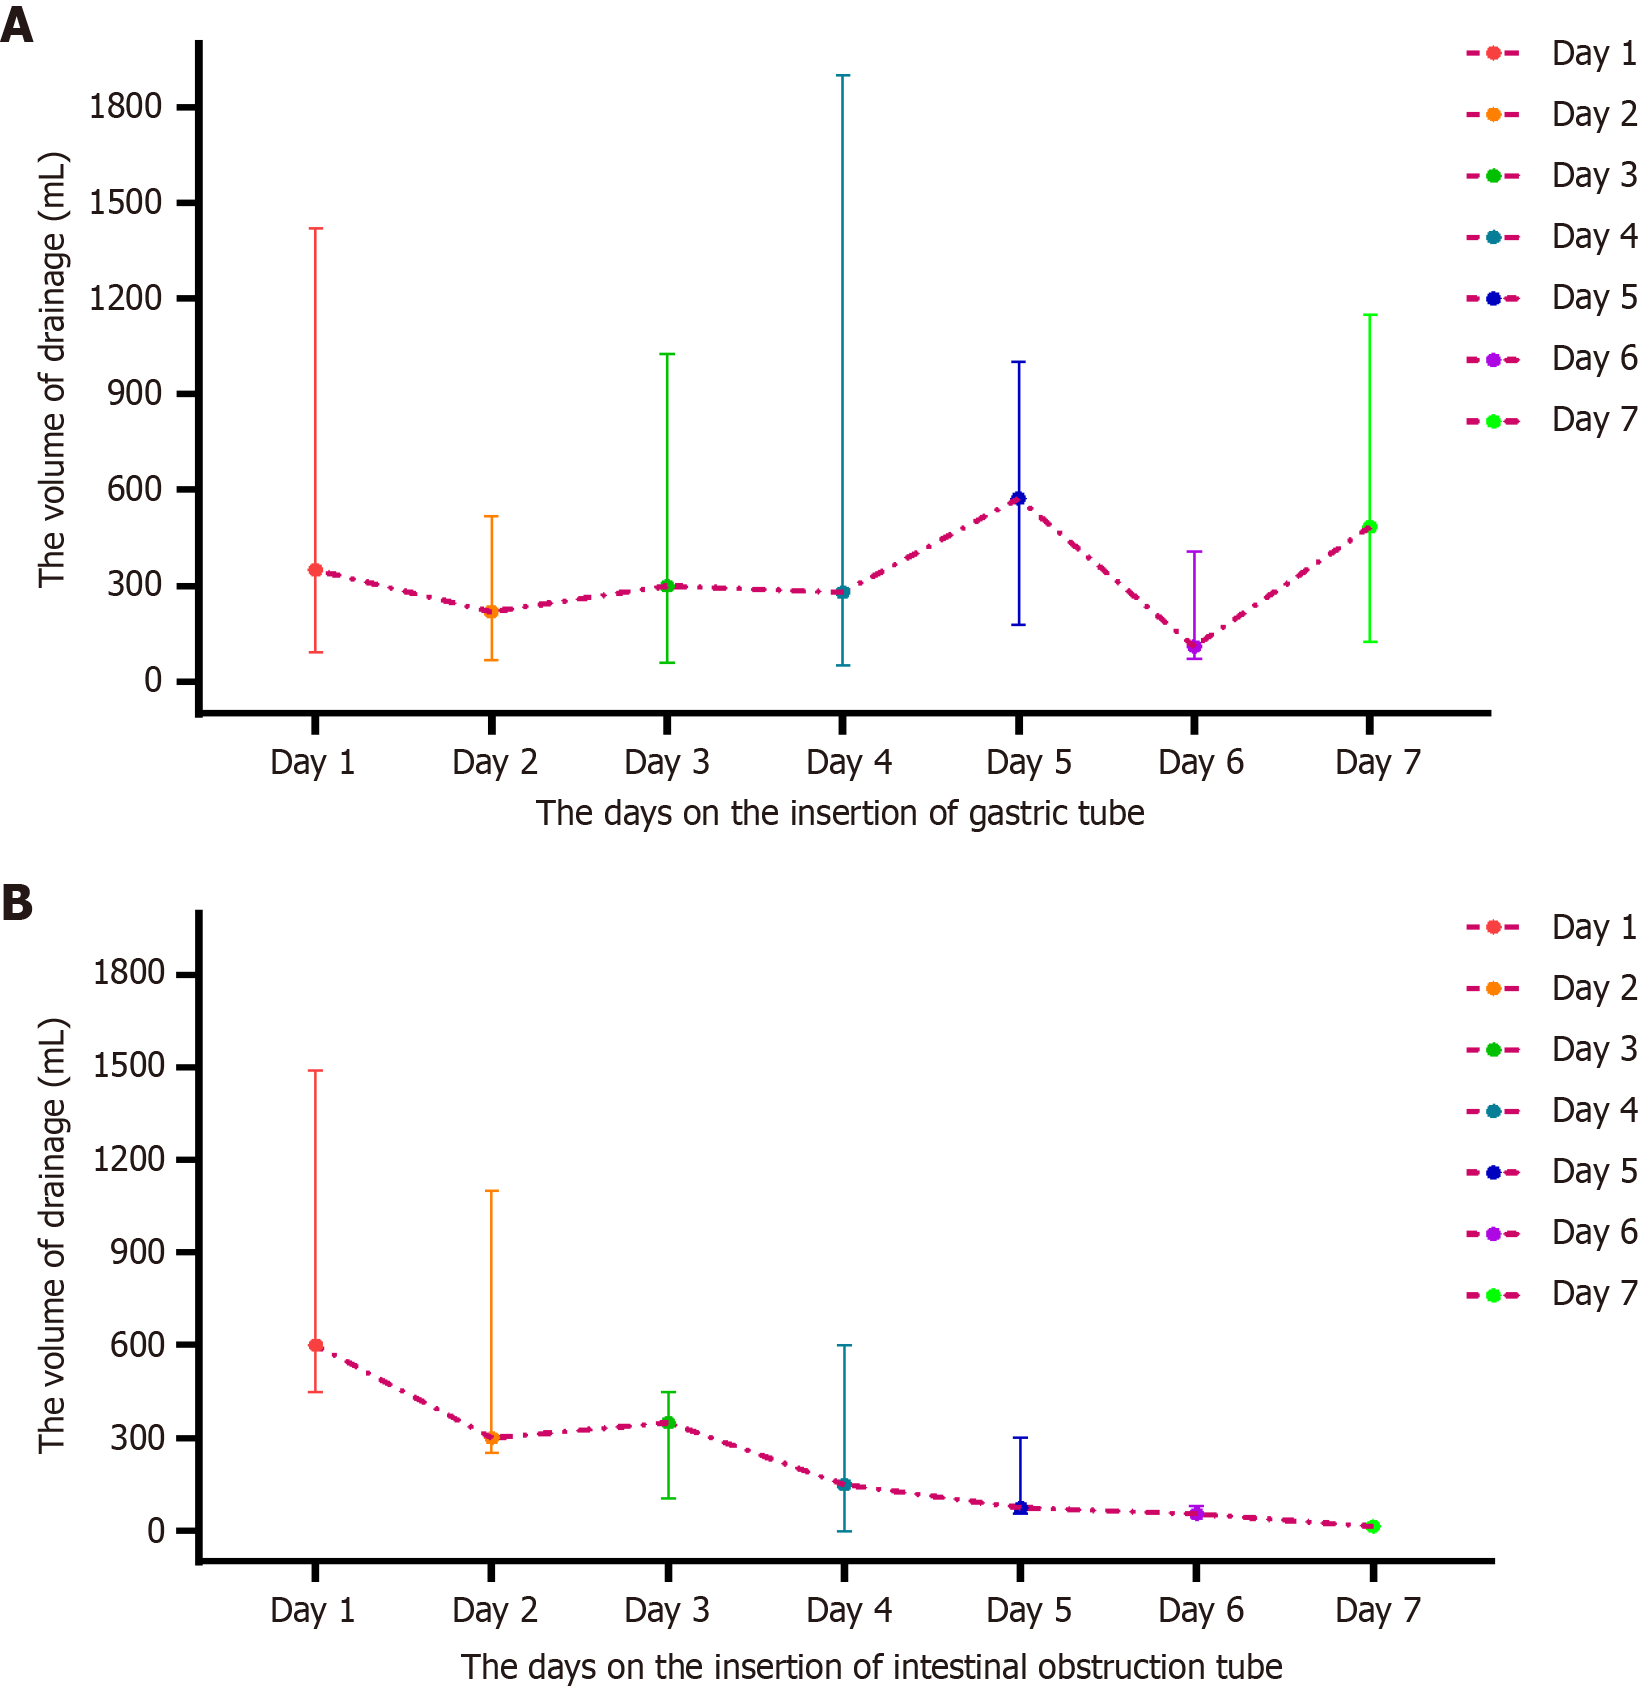
Figure 3 The overall drainage volume of patients receiving decompression.
A: Gastric tube; B: The intestinal obstruction tube.
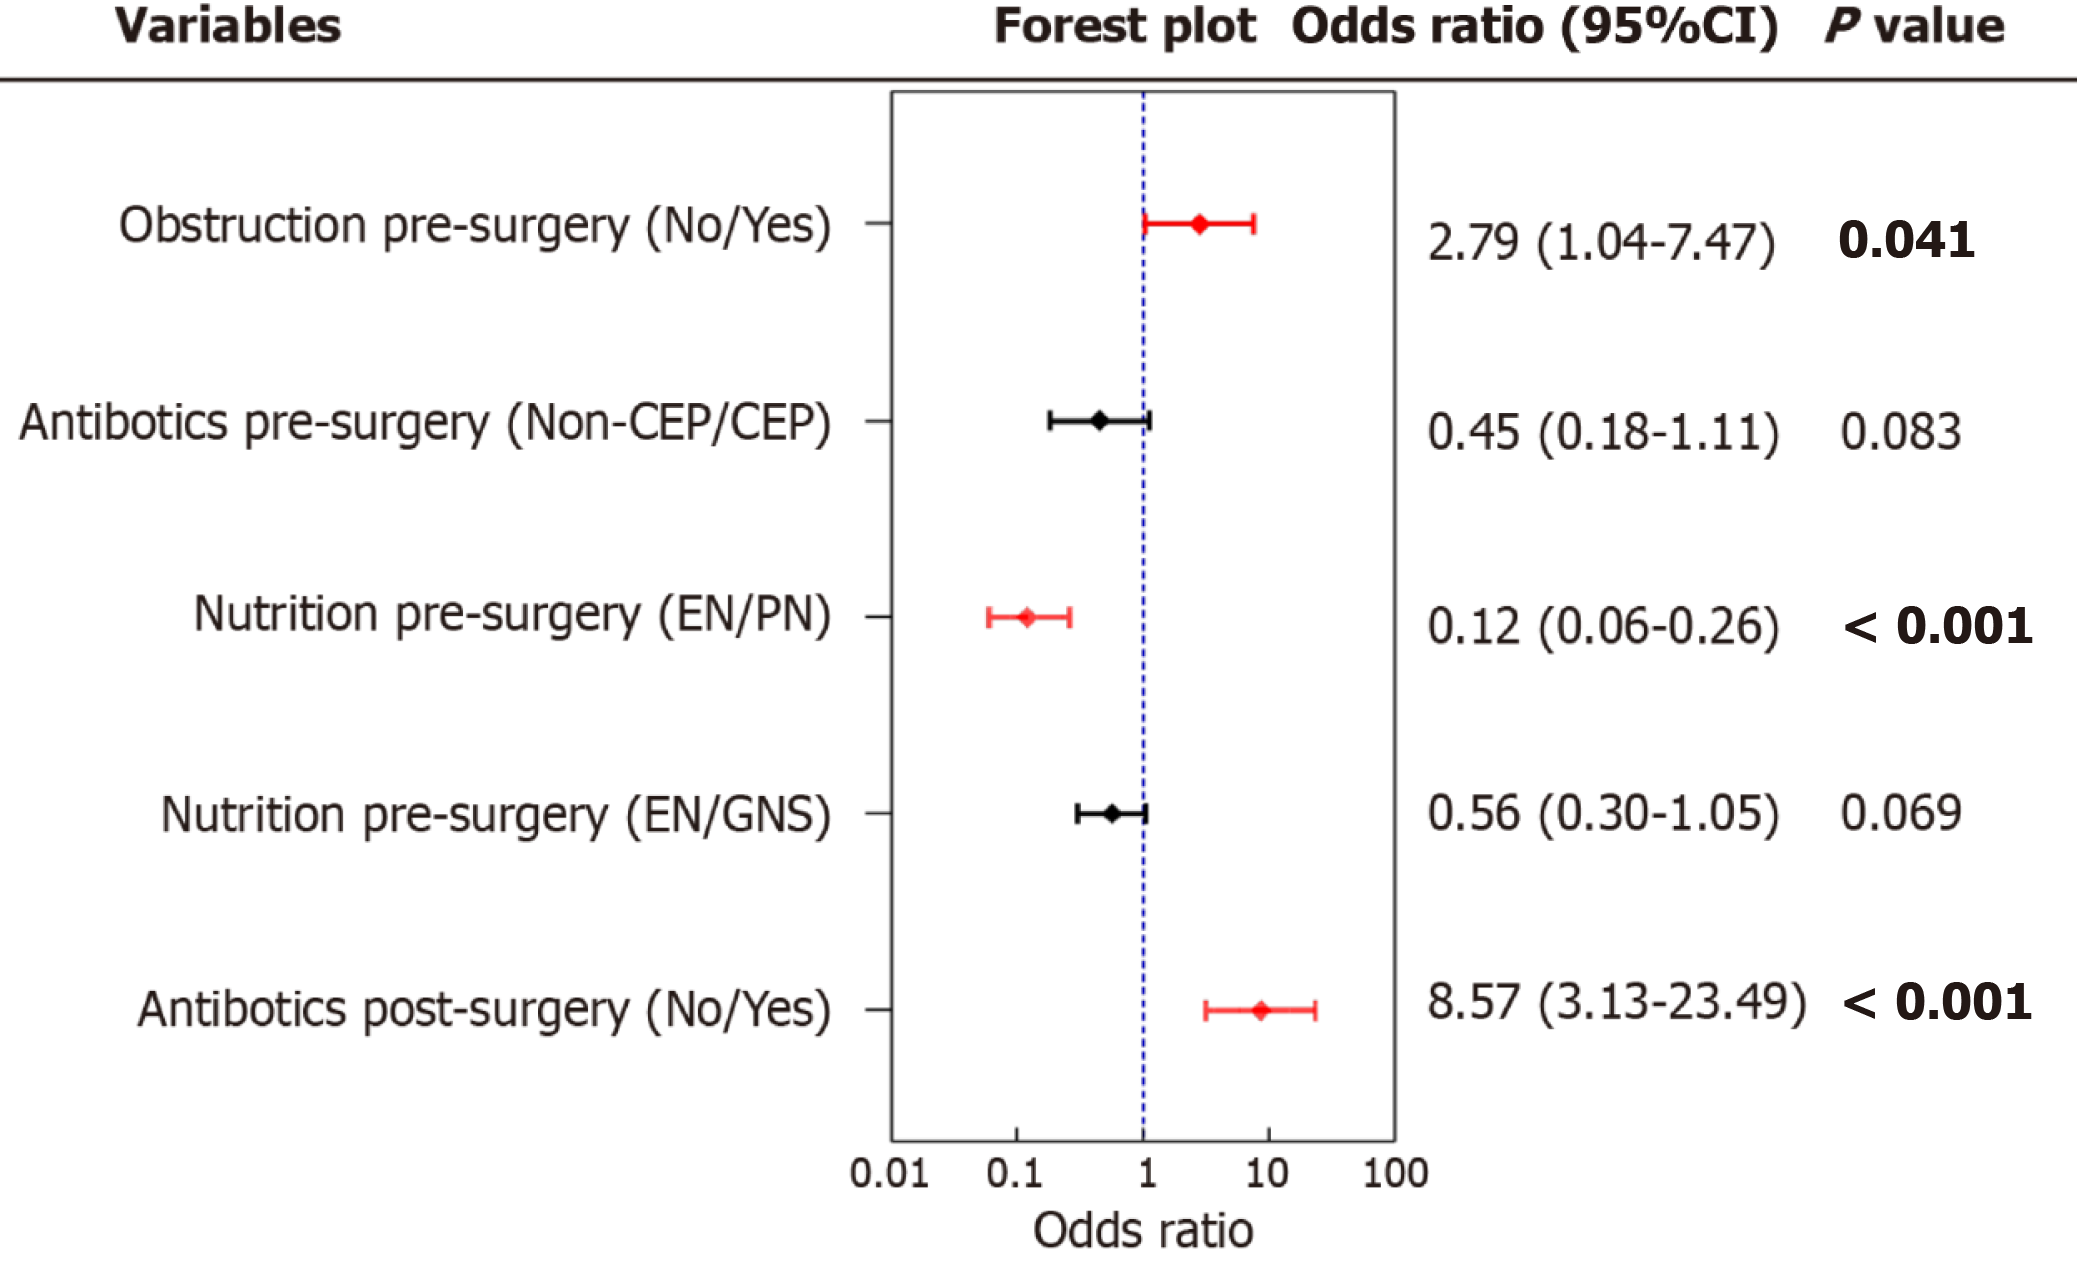
Figure 4 The multivariate analysis of factor affecting the incidence of intestinal flora disorder.
CEP: Cephalosporin; EN: Enteral nutrition; PN: Parenteral nutrition; GNS: Glucose and sodium chloride injection.
- Citation: Li GB, Wang CT, Zhang X, Qiu XY, Chen WJ, Lu JY, Xu L, Wu B, Xiao Y, Lin GL. Clinical characteristics and risk factors of post-operative intestinal flora disorder following laparoscopic colonic surgery: A propensity-score-matching analysis. World J Gastrointest Surg 2024; 16(5): 1259-1270
- URL: https://www.wjgnet.com/1948-9366/full/v16/i5/1259.htm
- DOI: https://dx.doi.org/10.4240/wjgs.v16.i5.1259


