Copyright
©The Author(s) 2024.
World J Gastrointest Surg. Apr 27, 2024; 16(4): 1195-1202
Published online Apr 27, 2024. doi: 10.4240/wjgs.v16.i4.1195
Published online Apr 27, 2024. doi: 10.4240/wjgs.v16.i4.1195
Figure 1 Computed tomography shows that superior mesenteric vein is violated by the mass in the pancreatic head (arrows).
A: Above the superior mesenteric vein; B: The superior mesenteric vein is violated by the mass; C: Below the superior mesenteric vein.
Figure 2 Computed tomography shows stenosis of the superior mesenteric vein in the region of the anastomosis (arrows).
A: Above the stenosis site; B: Stenosis of the superior mesenteric vein; C: Occlusion of the superior mesenteric vein.
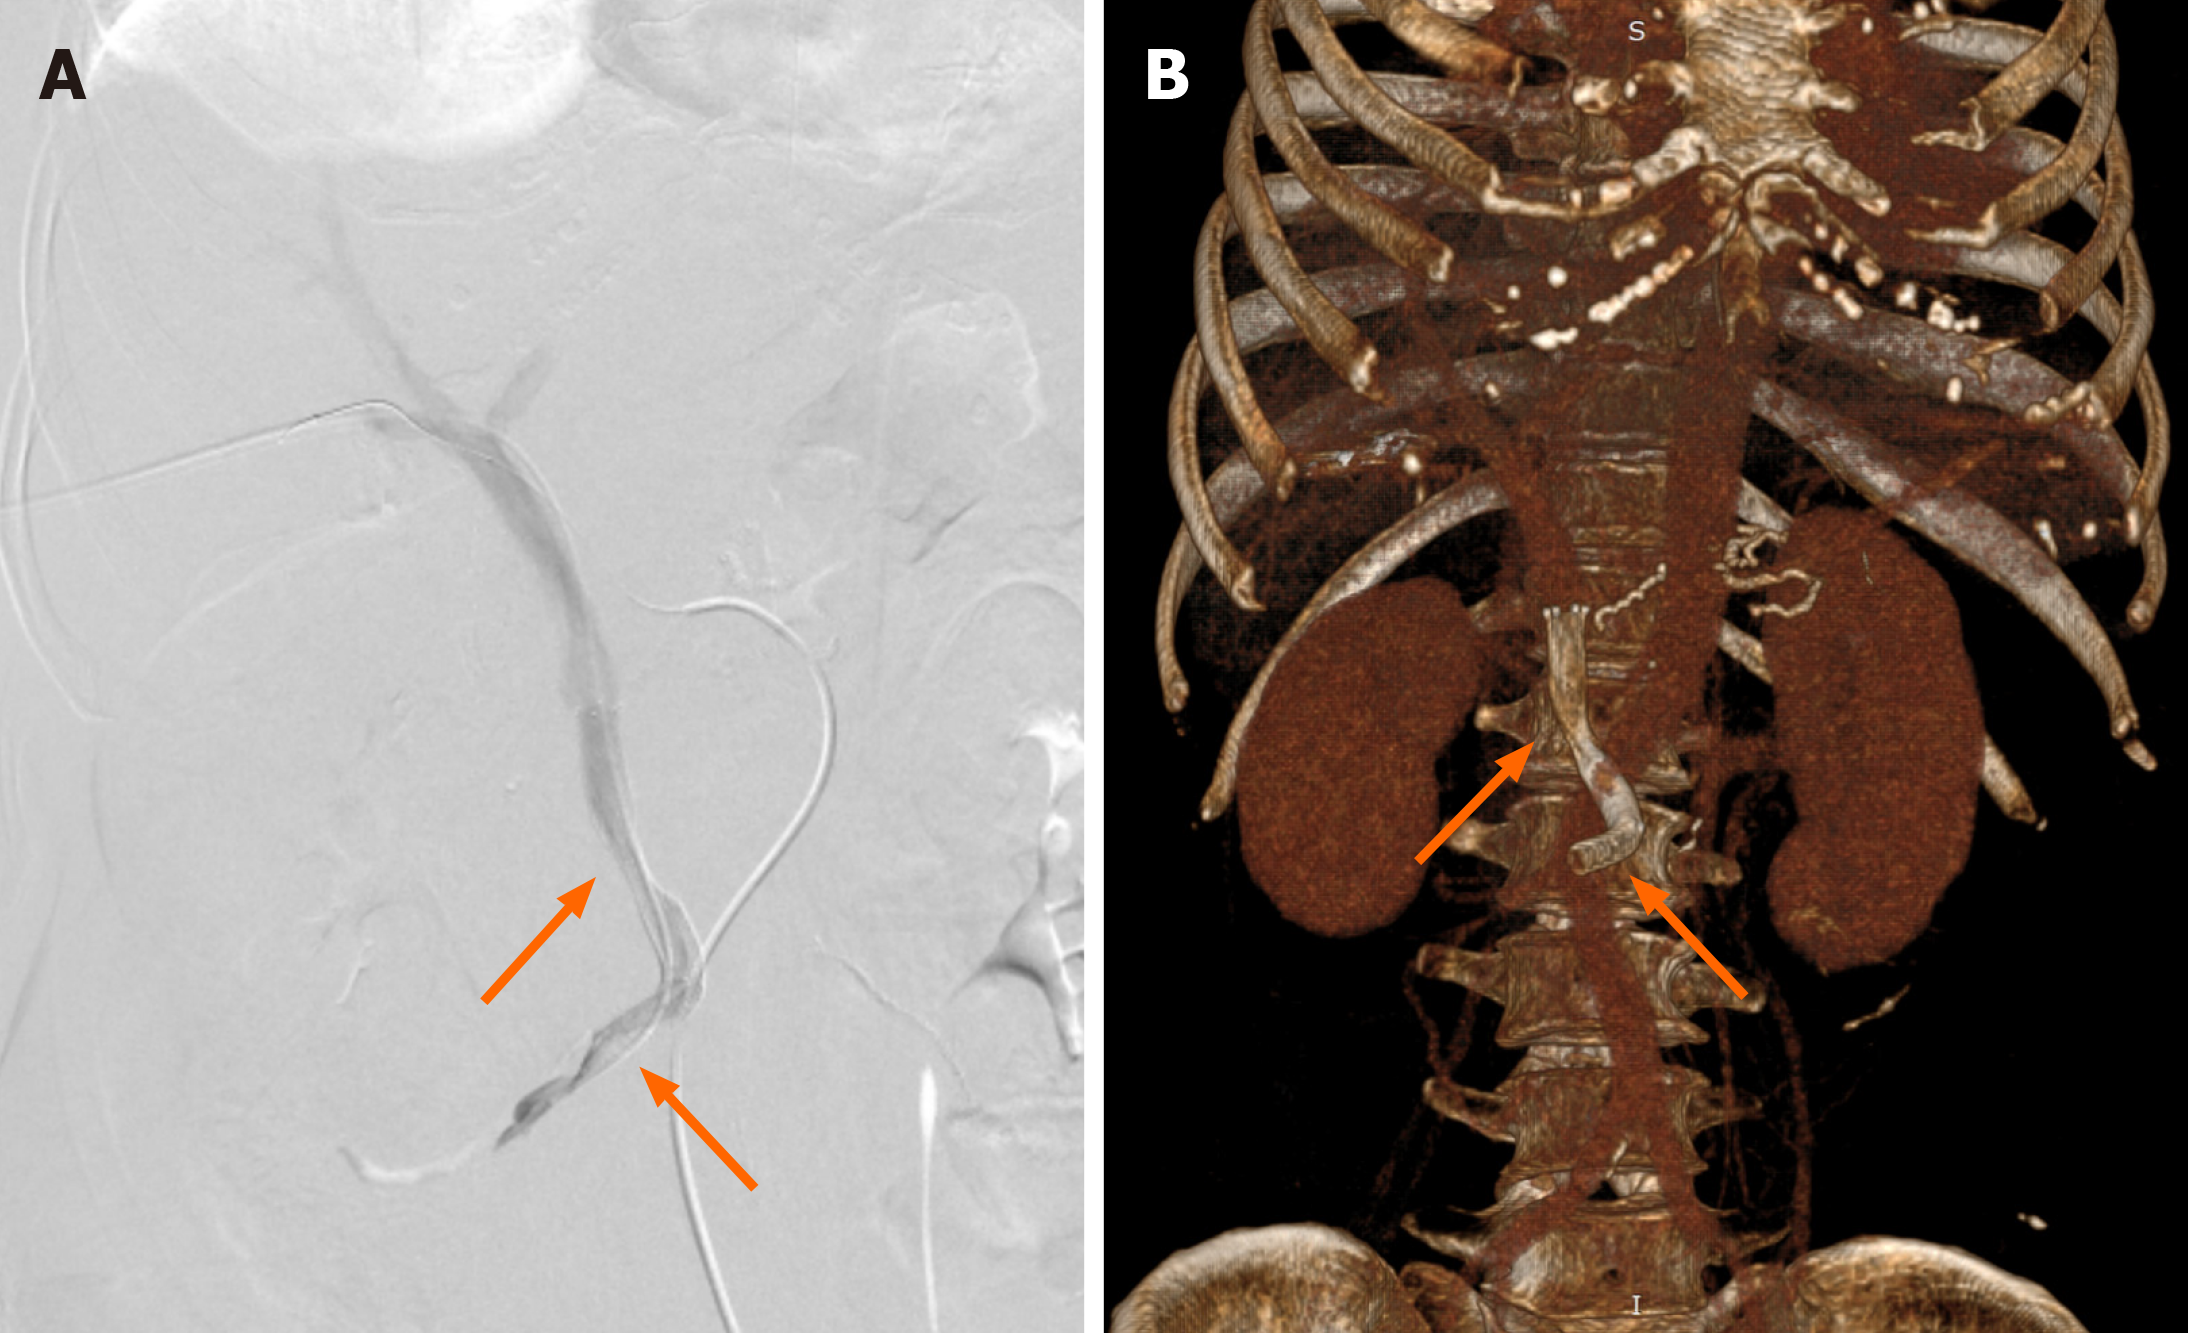
Figure 3 Percutaneous transhepatic direct portography showing improved stenosis after placement of two stents (arrows).
A: Digital subtraction angiography of portal vein; B: Volume rendering images showing stents in superior mesenteric vein/portal vein. Stent parameters: Upper arrow: 8 mm × 50 mm, coated; lower arrow: 8 mm × 60 mm, uncoated.
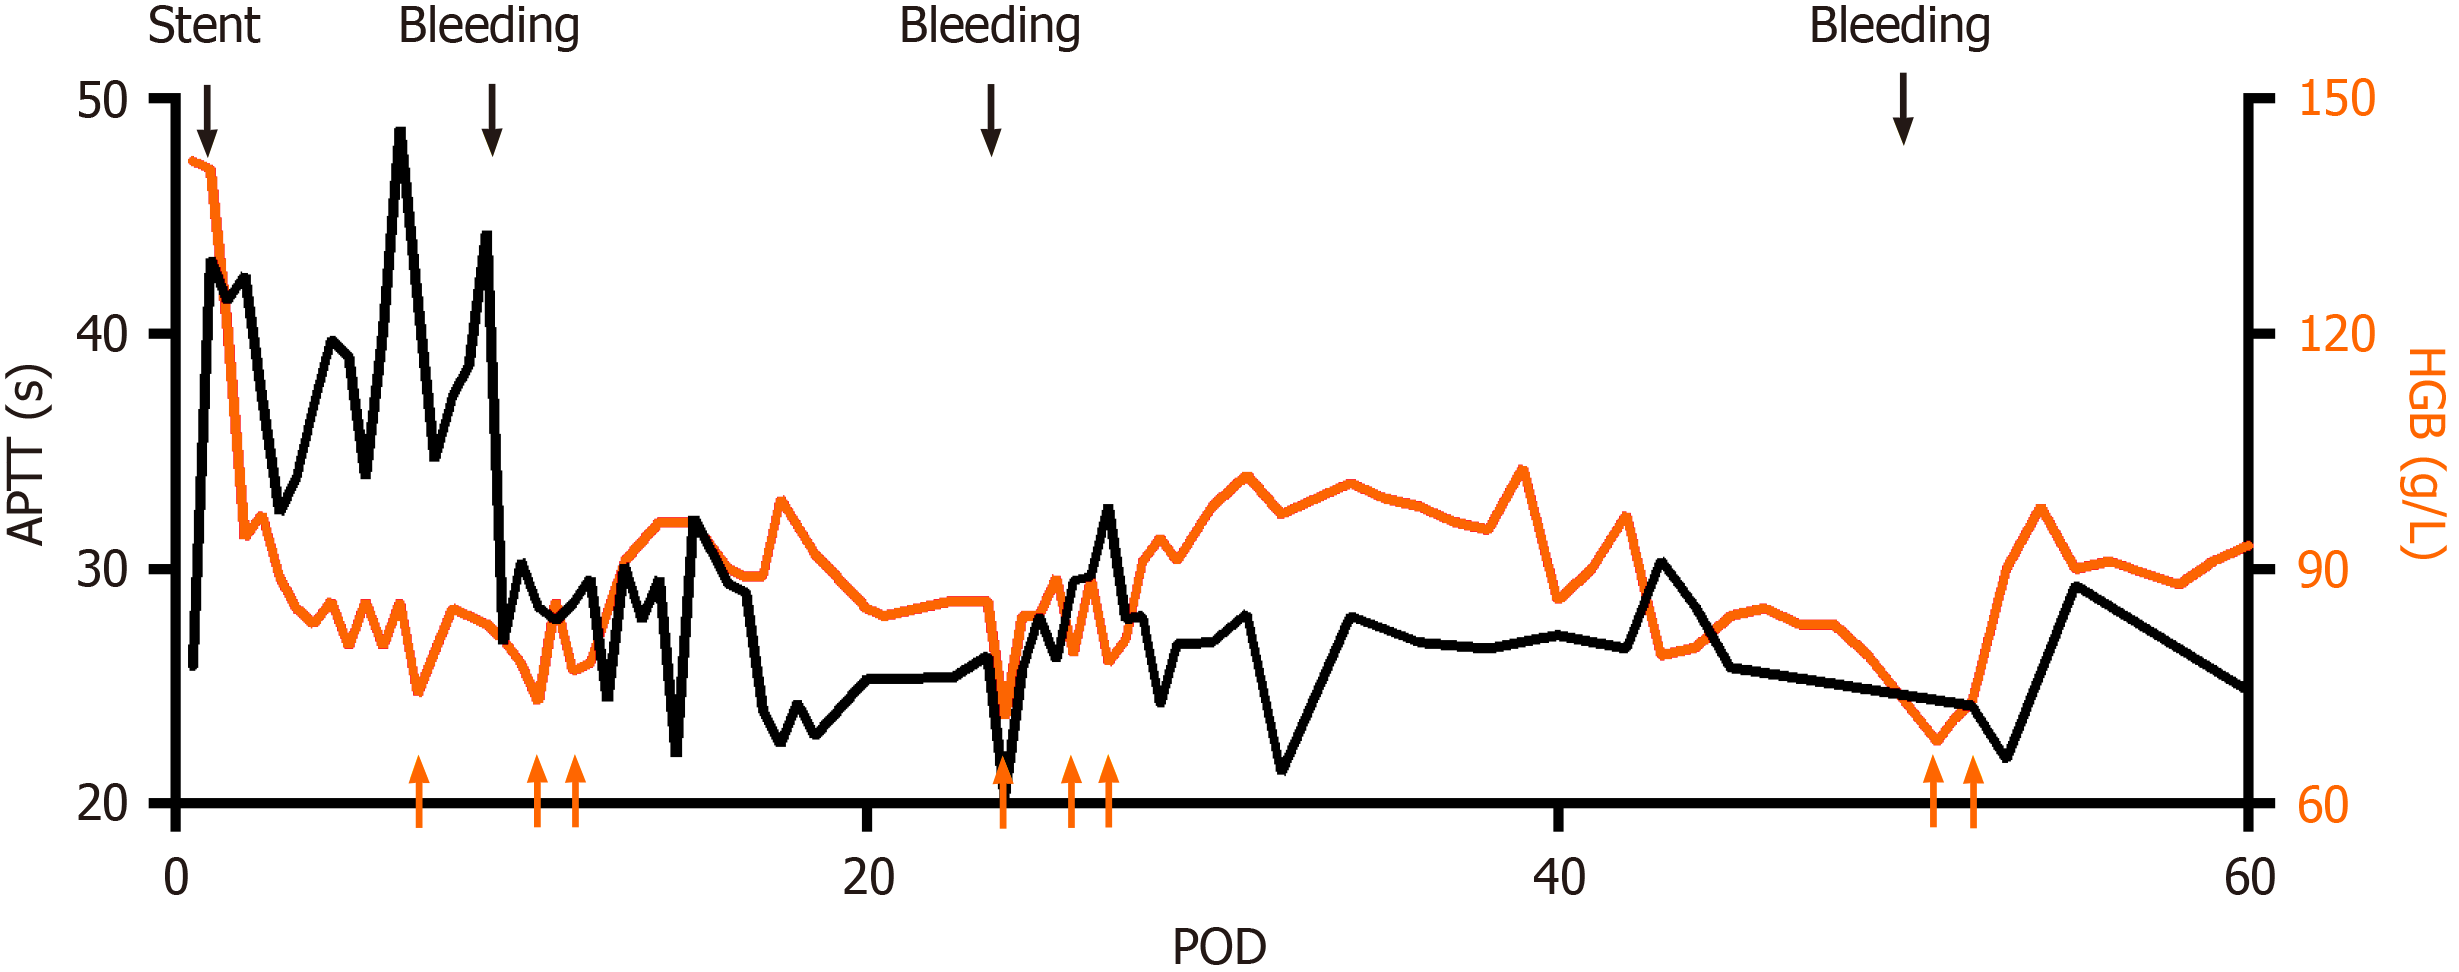
Figure 4 Activated partial thromboplastin time and hemoglobin profiles after surgery.
Black arrows indicate stent placement or bleeding, and anticoagulation goal is therefore adjusted. Orange arrows indicated red blood cell transfusion due to anemia. APTT: Activated partial thromboplastin time; HGB: Hemoglobin; POD: Postoperative day.
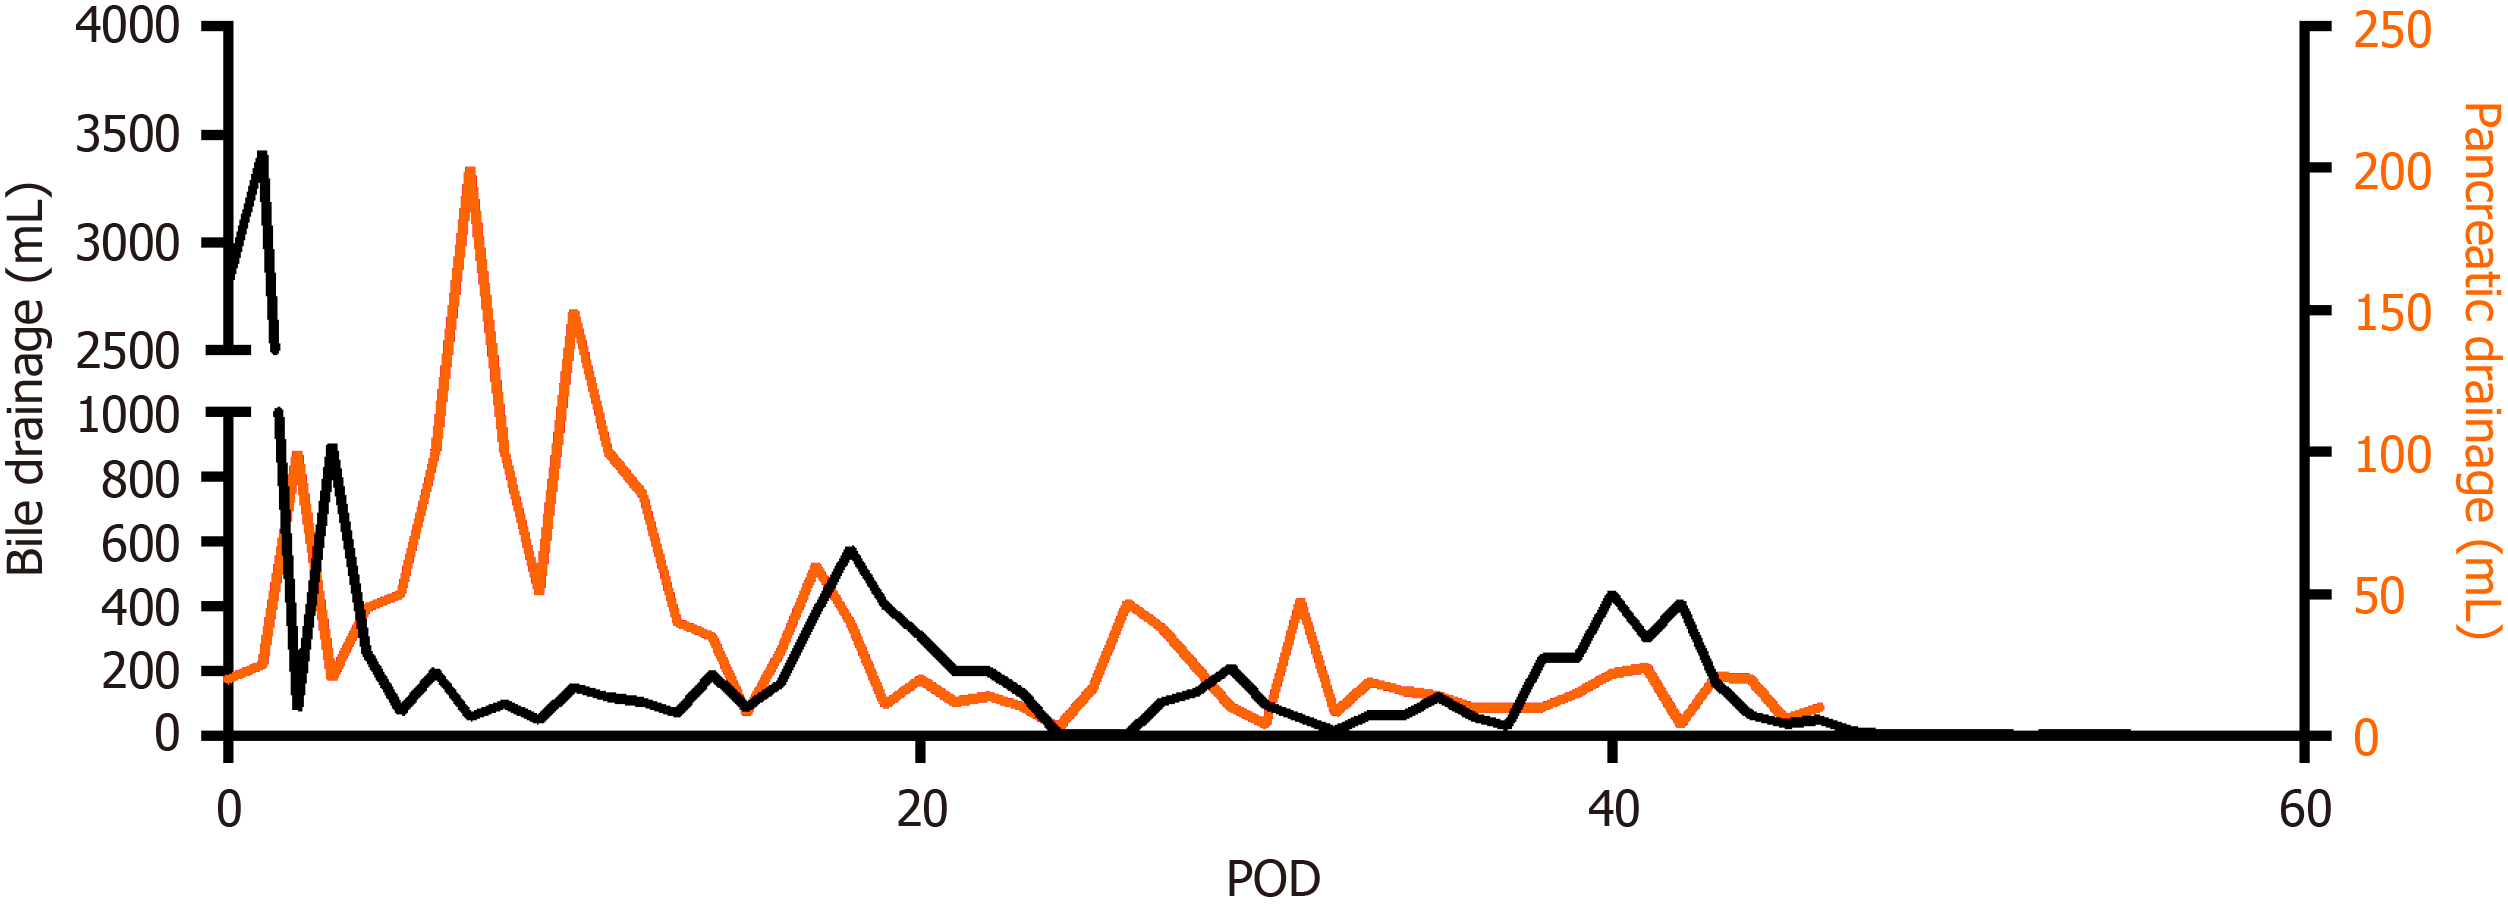
Figure 5 The postoperative drainage volume of two operative drains placed close to the bilioenteric anastomosis and the pancreaticojejunal anastomosis respectively.
POD: Postoperative day.
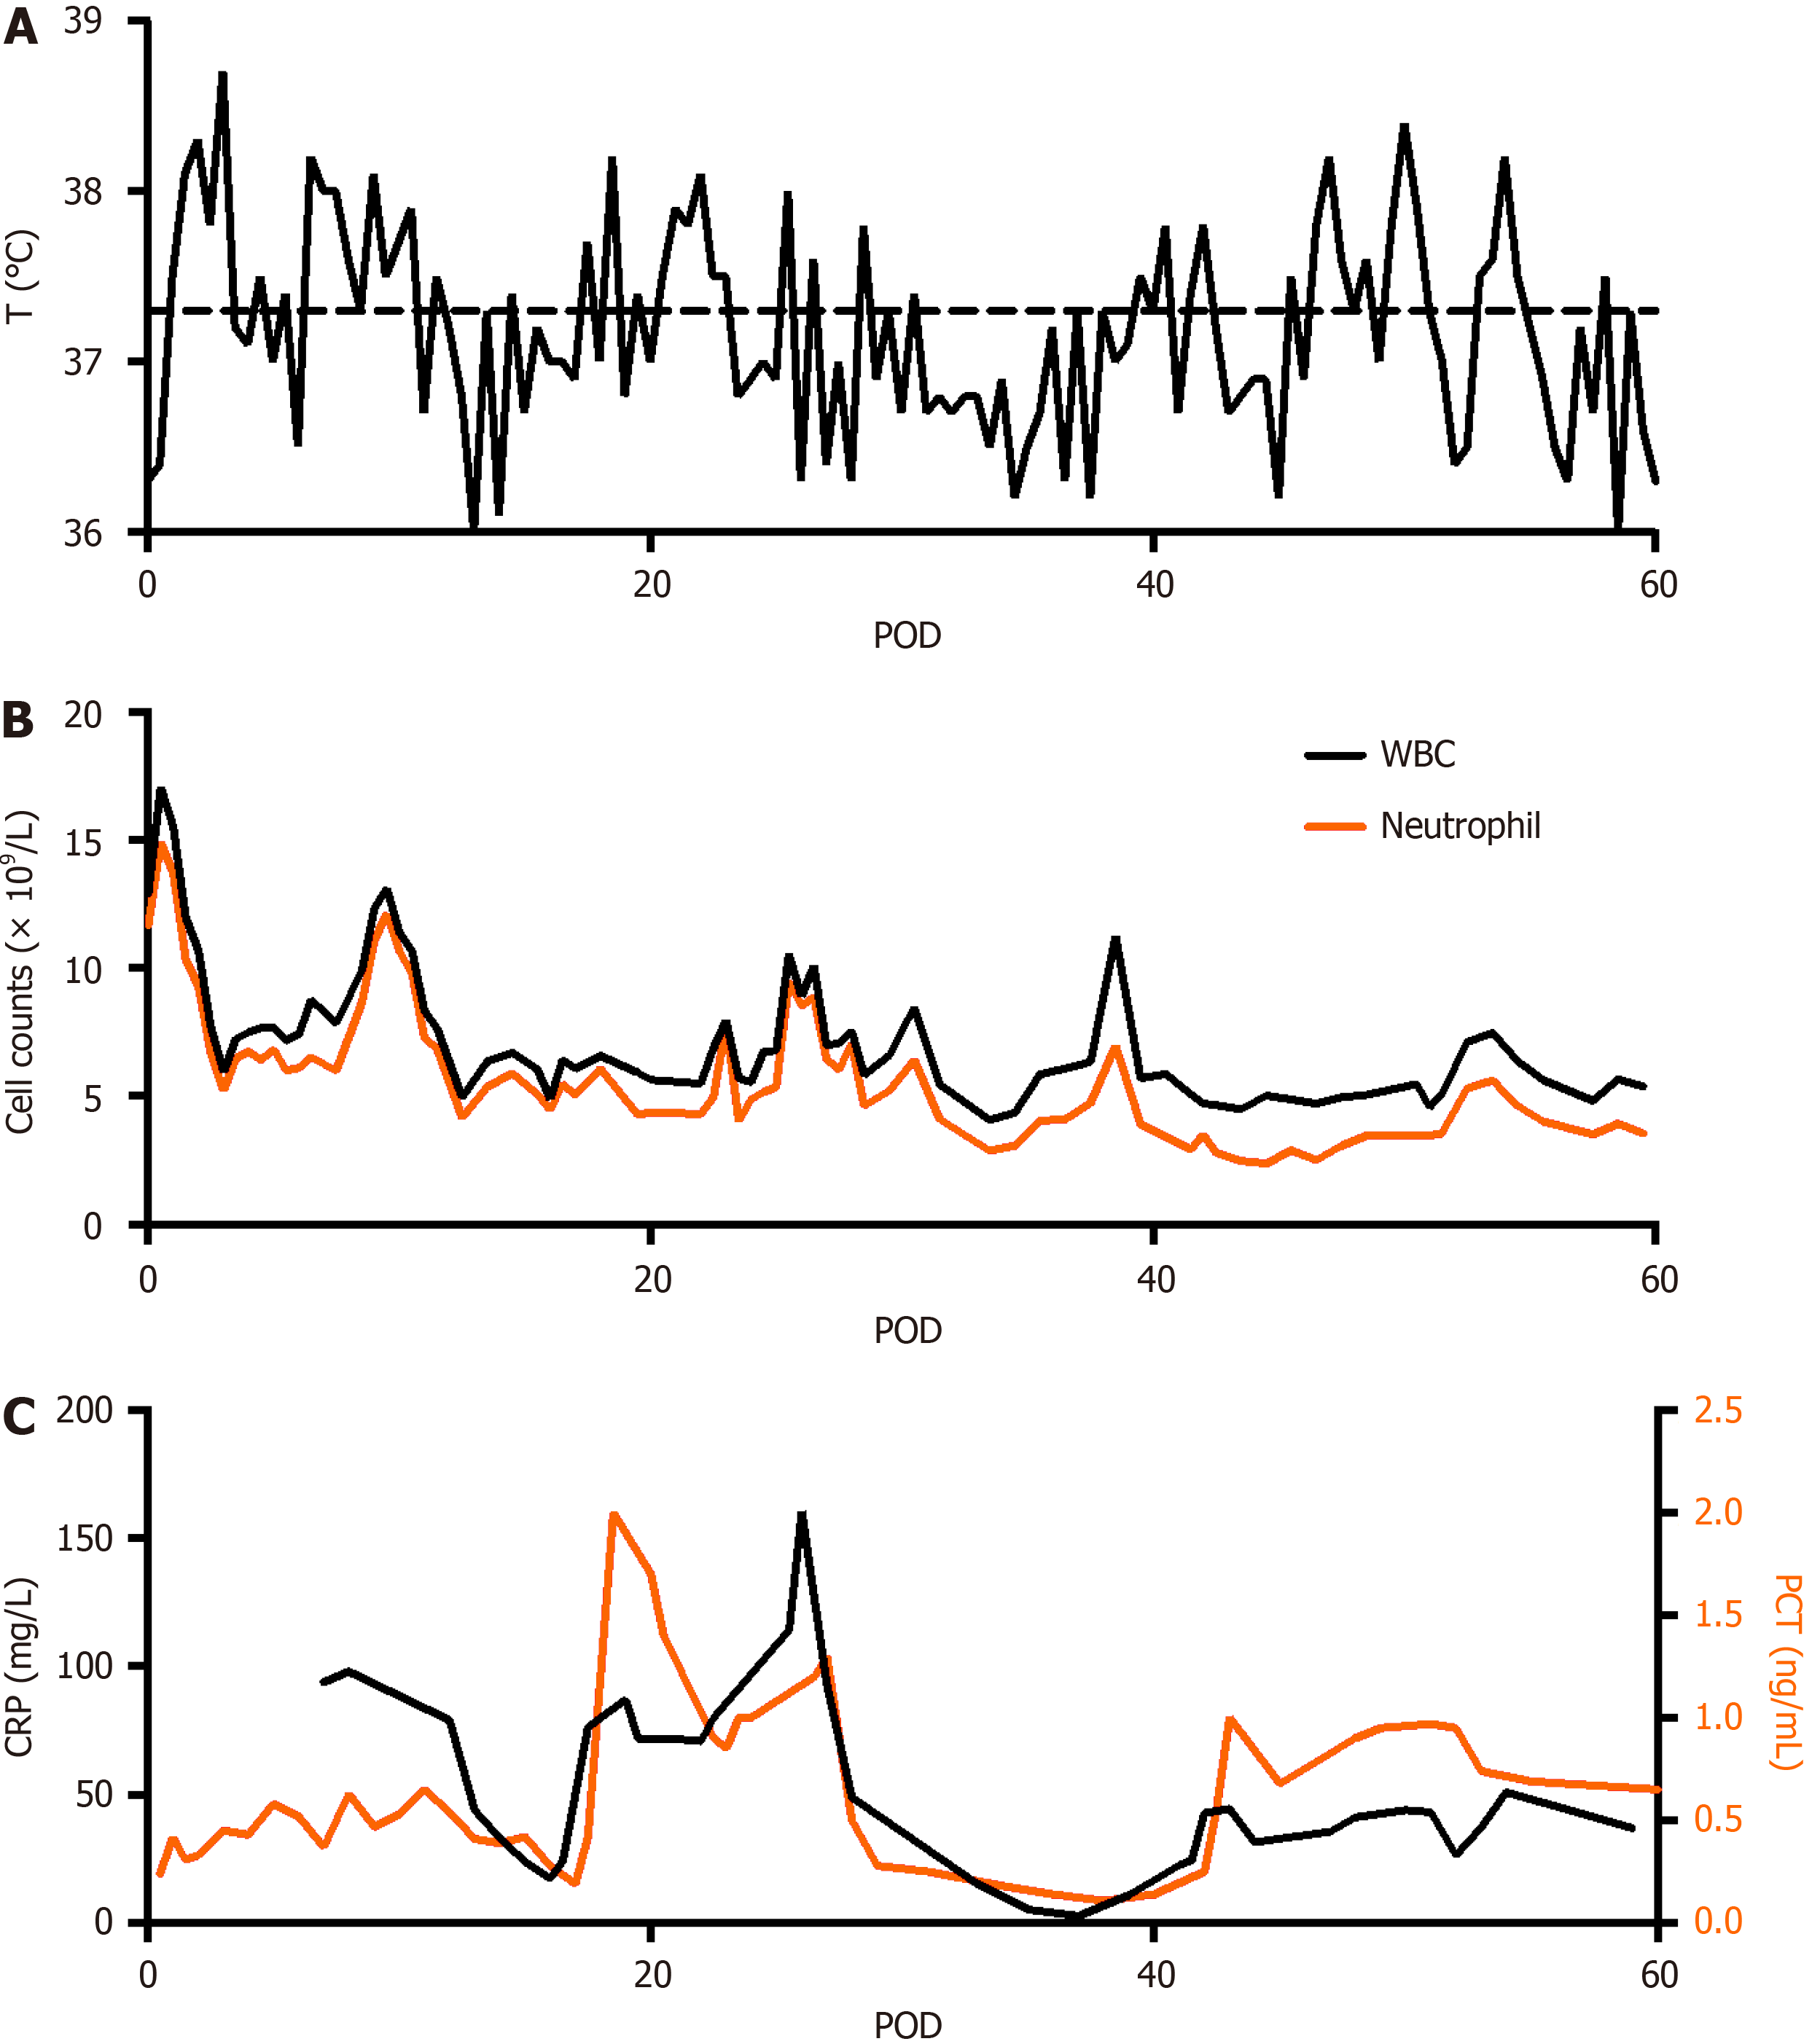
Figure 6 Temperature, white blood cell and neutrophil, and inflammatory markers profiles after surgery.
A: Temperature; B: White blood cell and neutrophil; C: Inflammatory markers. WBC: White blood cell; PCT: Procalcitonin; POD: Postoperative day; CRP: C-reactive protein.
- Citation: Lin C, Wang ZY, Dong LB, Wang ZW, Li ZH, Wang WB. Percutaneous transhepatic stenting for acute superior mesenteric vein stenosis after pancreaticoduodenectomy with portal vein reconstruction: A case report. World J Gastrointest Surg 2024; 16(4): 1195-1202
- URL: https://www.wjgnet.com/1948-9366/full/v16/i4/1195.htm
- DOI: https://dx.doi.org/10.4240/wjgs.v16.i4.1195


