Copyright
©The Author(s) 2024.
World J Gastrointest Surg. Apr 27, 2024; 16(4): 1055-1065
Published online Apr 27, 2024. doi: 10.4240/wjgs.v16.i4.1055
Published online Apr 27, 2024. doi: 10.4240/wjgs.v16.i4.1055
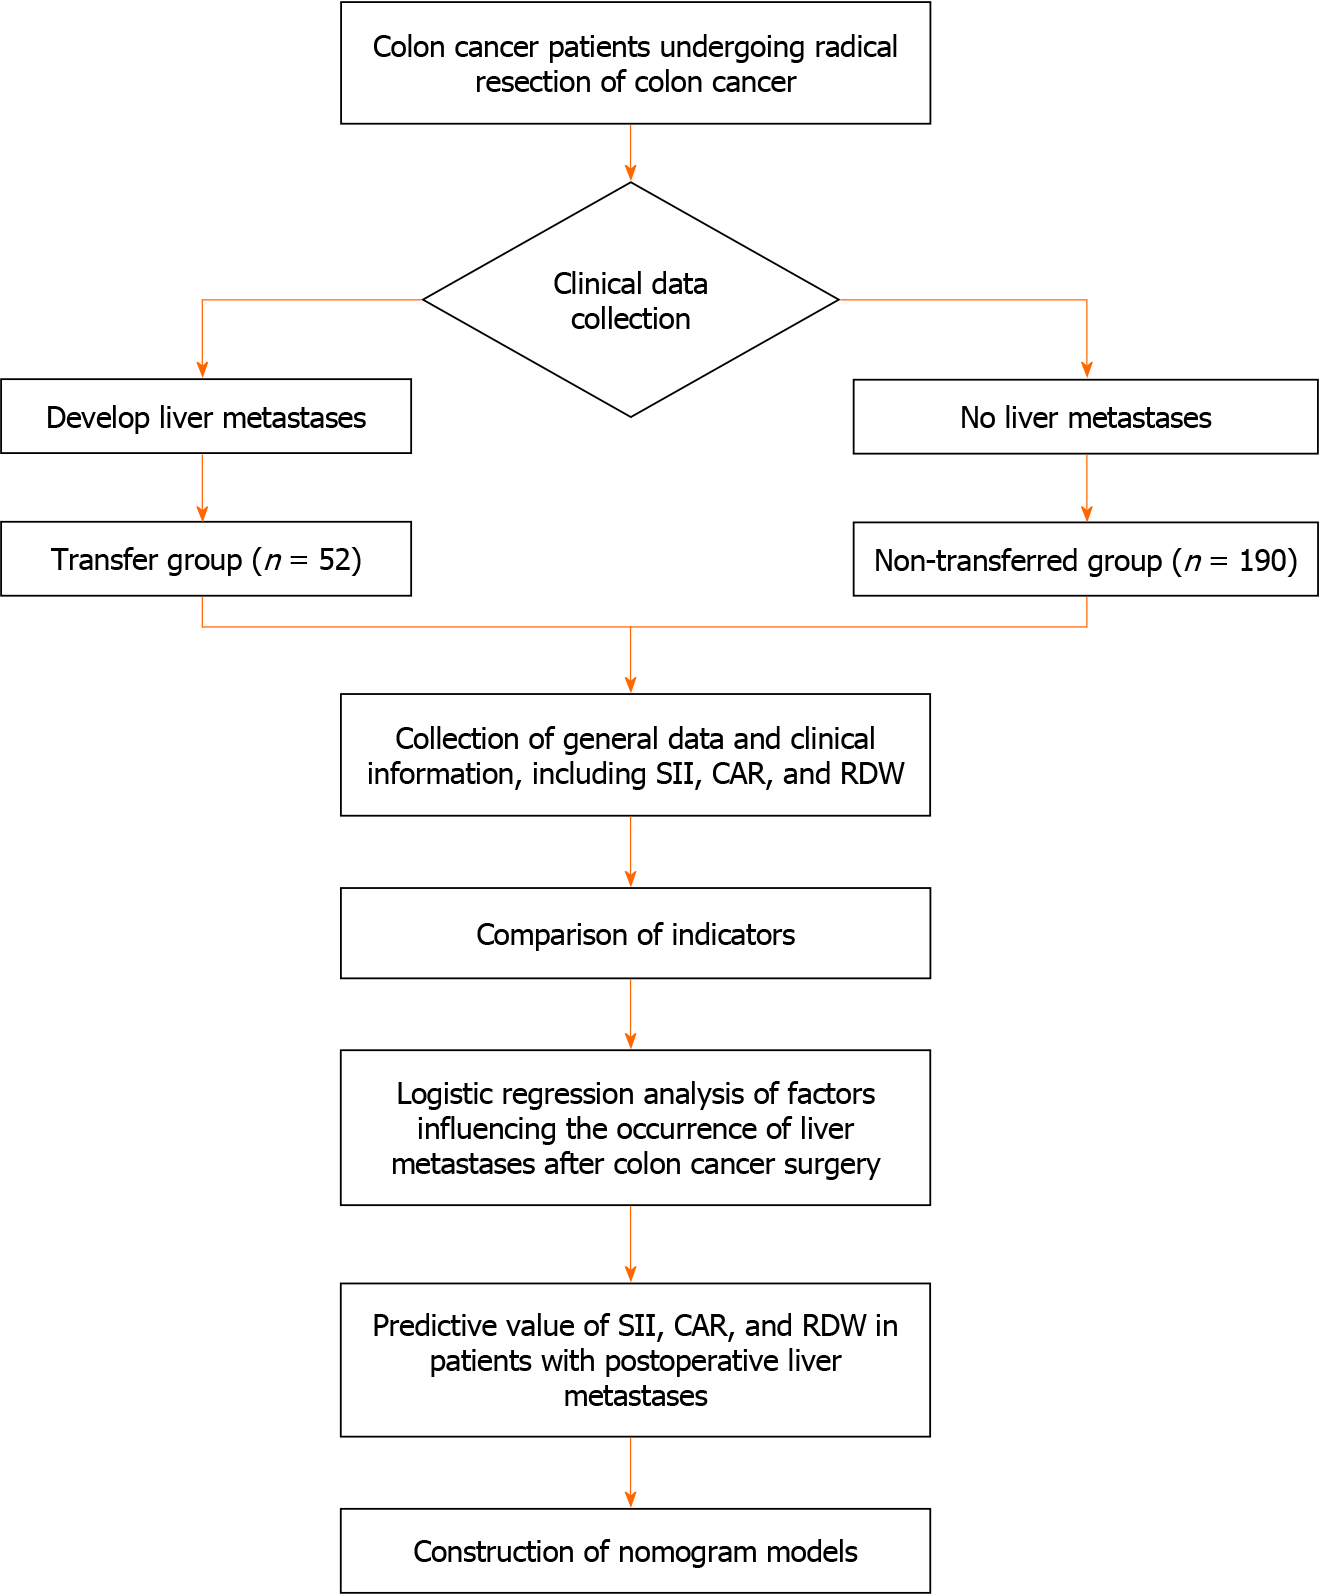
Figure 1 Flow chart of the study.
SII: Systemic inflammatory index; CAR: C-reactive protein/albumin ratio; RDW: Red blood cell distribution width.
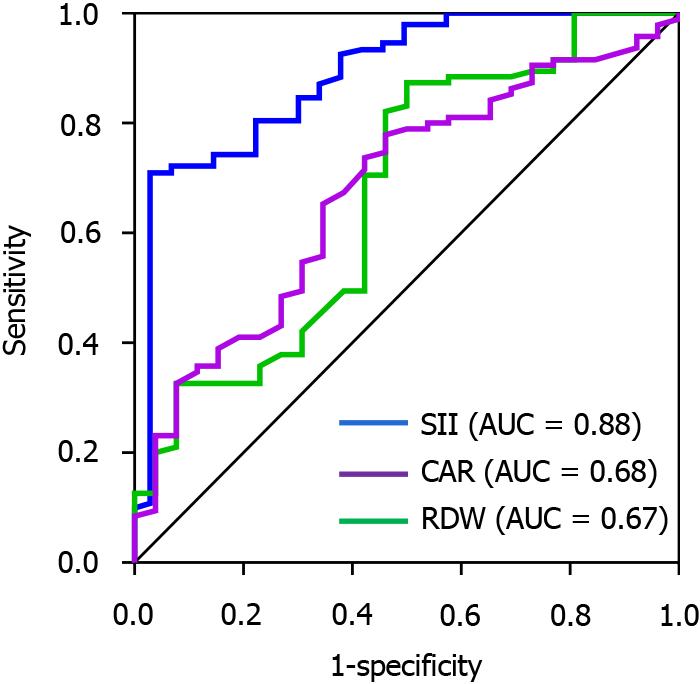
Figure 2 Receiver operating characteristic curves showing the prediction sensitivity of systemic inflammatory index, C-reactive protein/albumin ratio, and red blood cell distribution width in patients with postoperative liver metastases.
SII: Systemic inflammatory index; CAR: C-reactive protein/albumin ratio; RDW: Red blood cell distribution width.
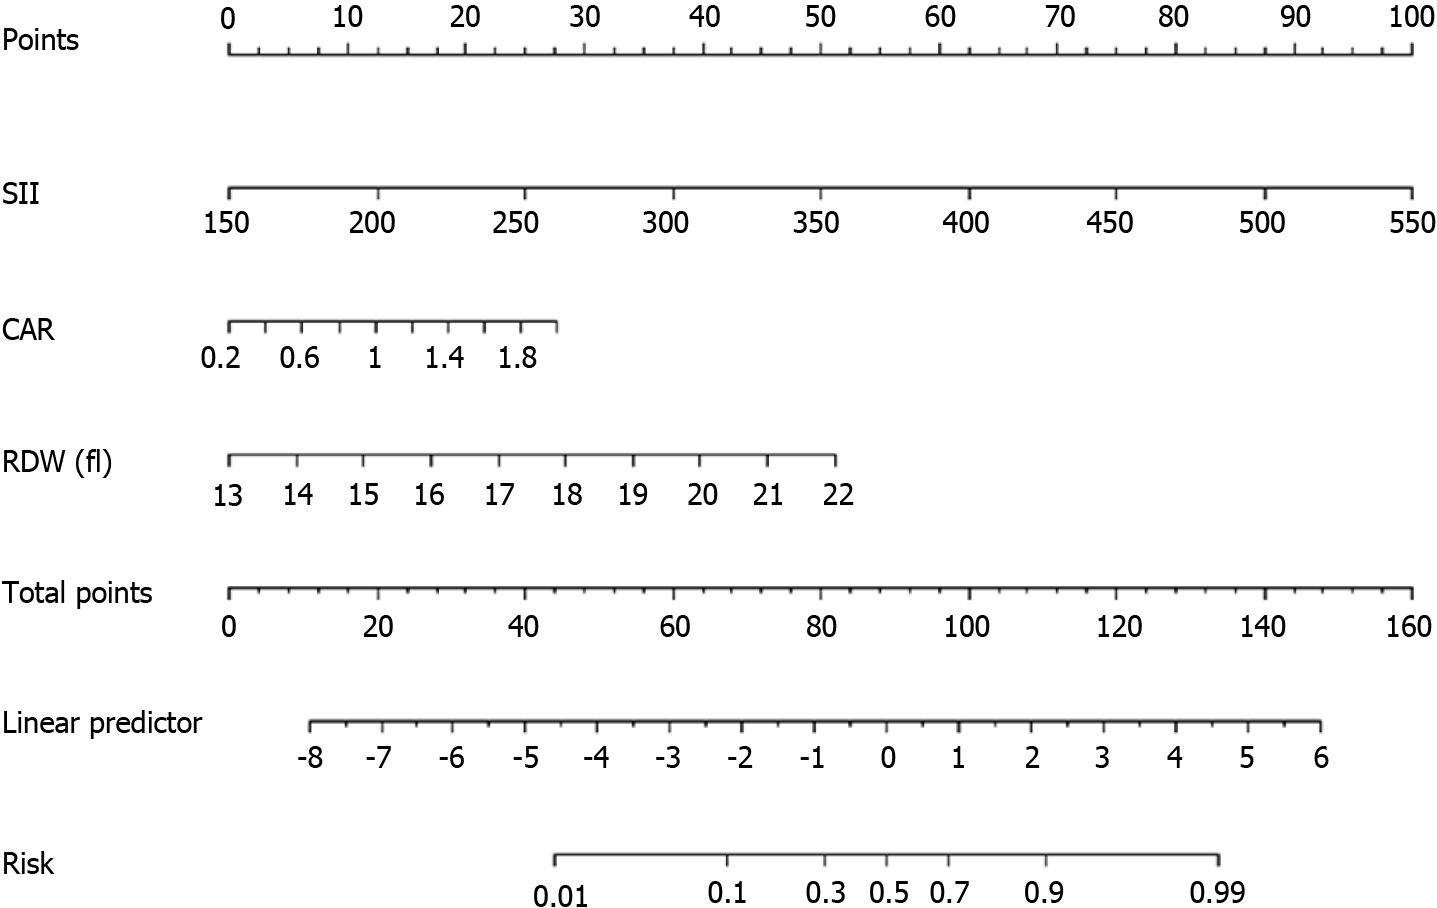
Figure 3 Nomogram prediction model of the risk of postoperative liver metastases in patients with colon cancer.
SII: Systemic inflammatory index; CAR: C-reactive protein/albumin ratio; RDW: Red blood cell distribution width.
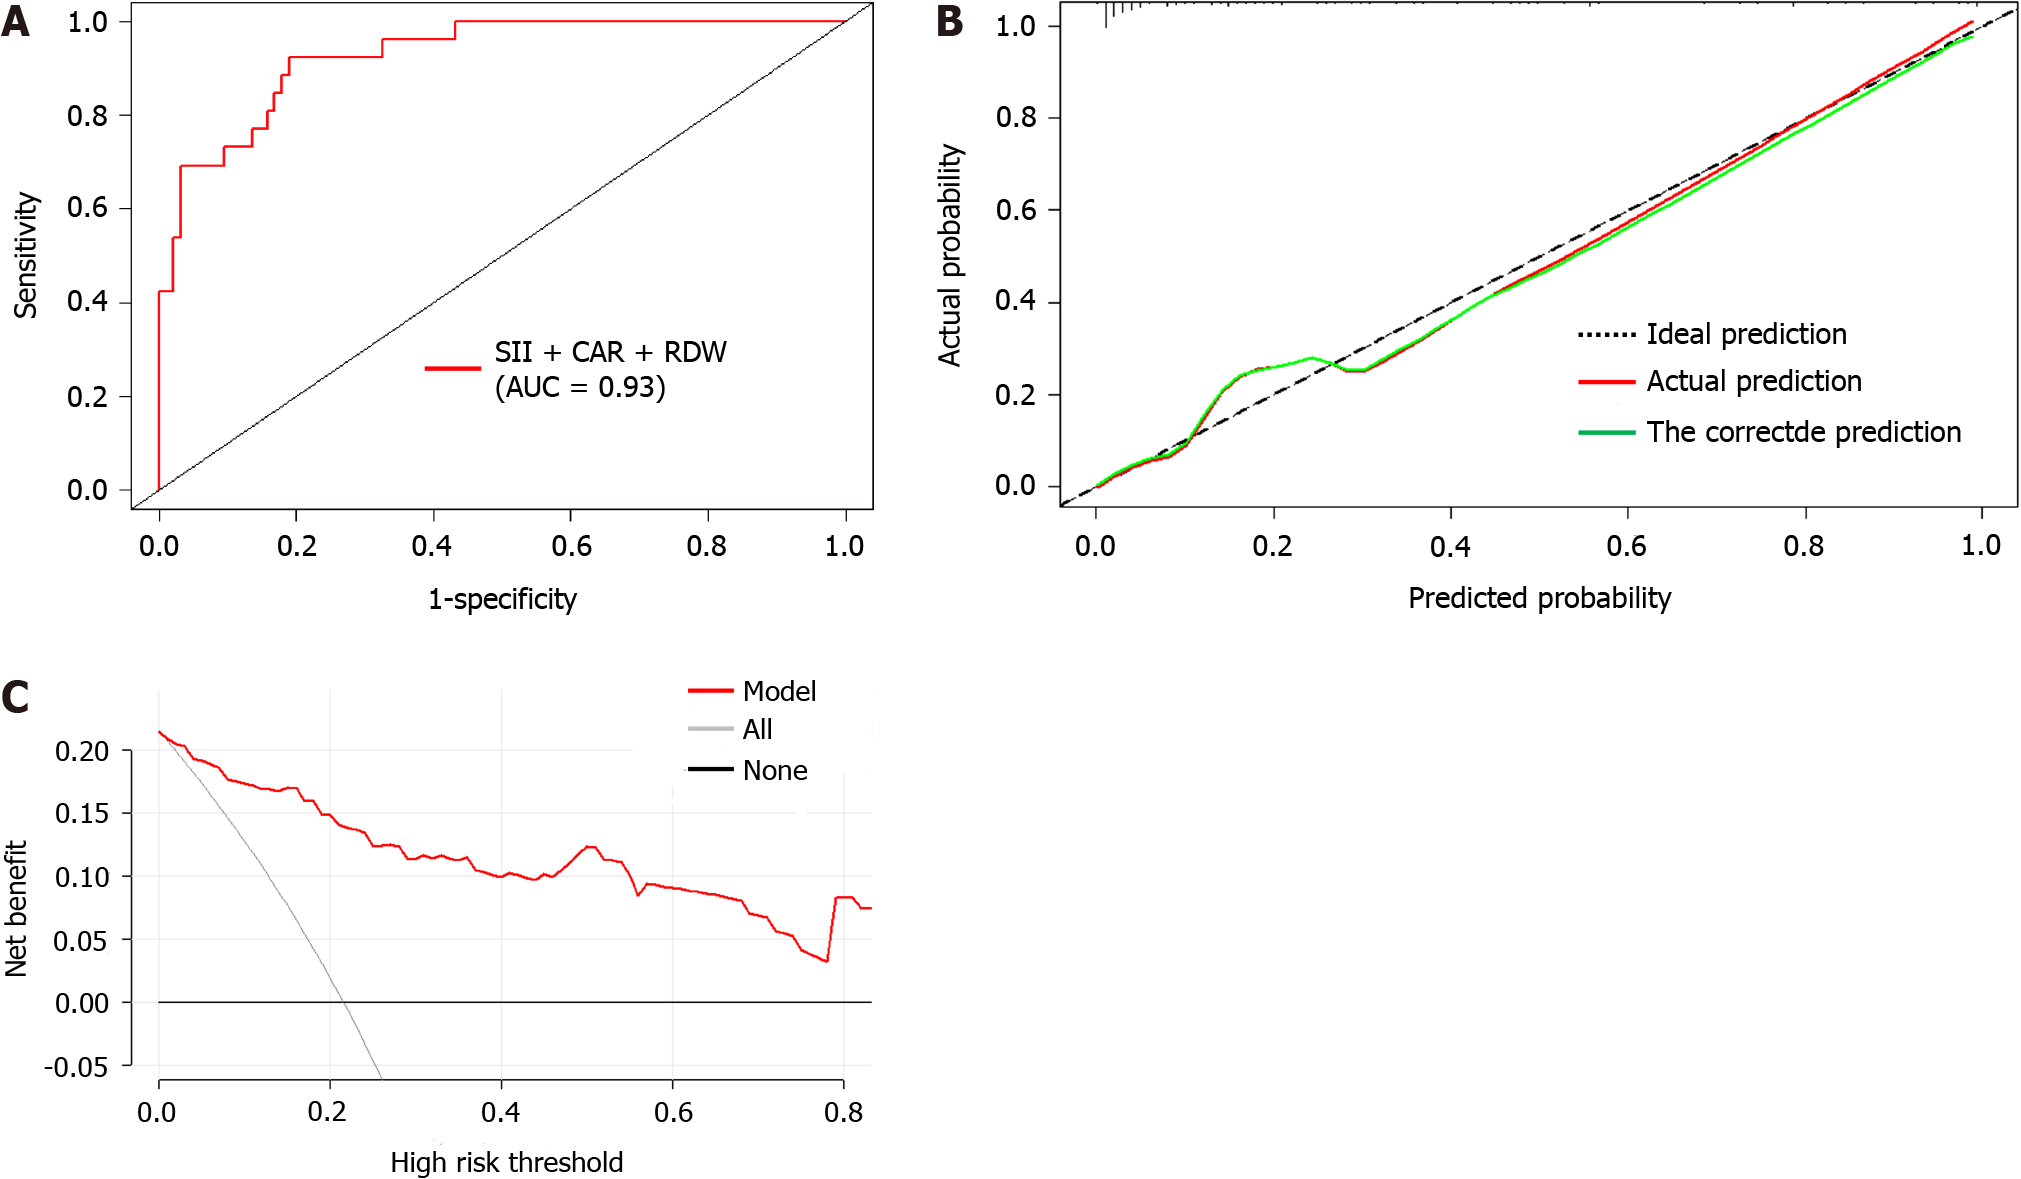
Figure 4 Predictive performance of the column graph model on the training set.
A: receiver operating characteristic curve of the training set; B: Calibration curve of the training set; C: The DCA curve of the training set. SII: Systemic inflammatory index; CAR: C-reactive protein/albumin ratio; RDW: Red blood cell distribution width.
- Citation: Cheng DX, Xu KD, Liu HB, Liu Y. Prognostic value of a nomogram model for postoperative liver metastasis of colon cancer. World J Gastrointest Surg 2024; 16(4): 1055-1065
- URL: https://www.wjgnet.com/1948-9366/full/v16/i4/1055.htm
- DOI: https://dx.doi.org/10.4240/wjgs.v16.i4.1055


