Copyright
©The Author(s) 2024.
World J Gastrointest Surg. Mar 27, 2024; 16(3): 966-973
Published online Mar 27, 2024. doi: 10.4240/wjgs.v16.i3.966
Published online Mar 27, 2024. doi: 10.4240/wjgs.v16.i3.966
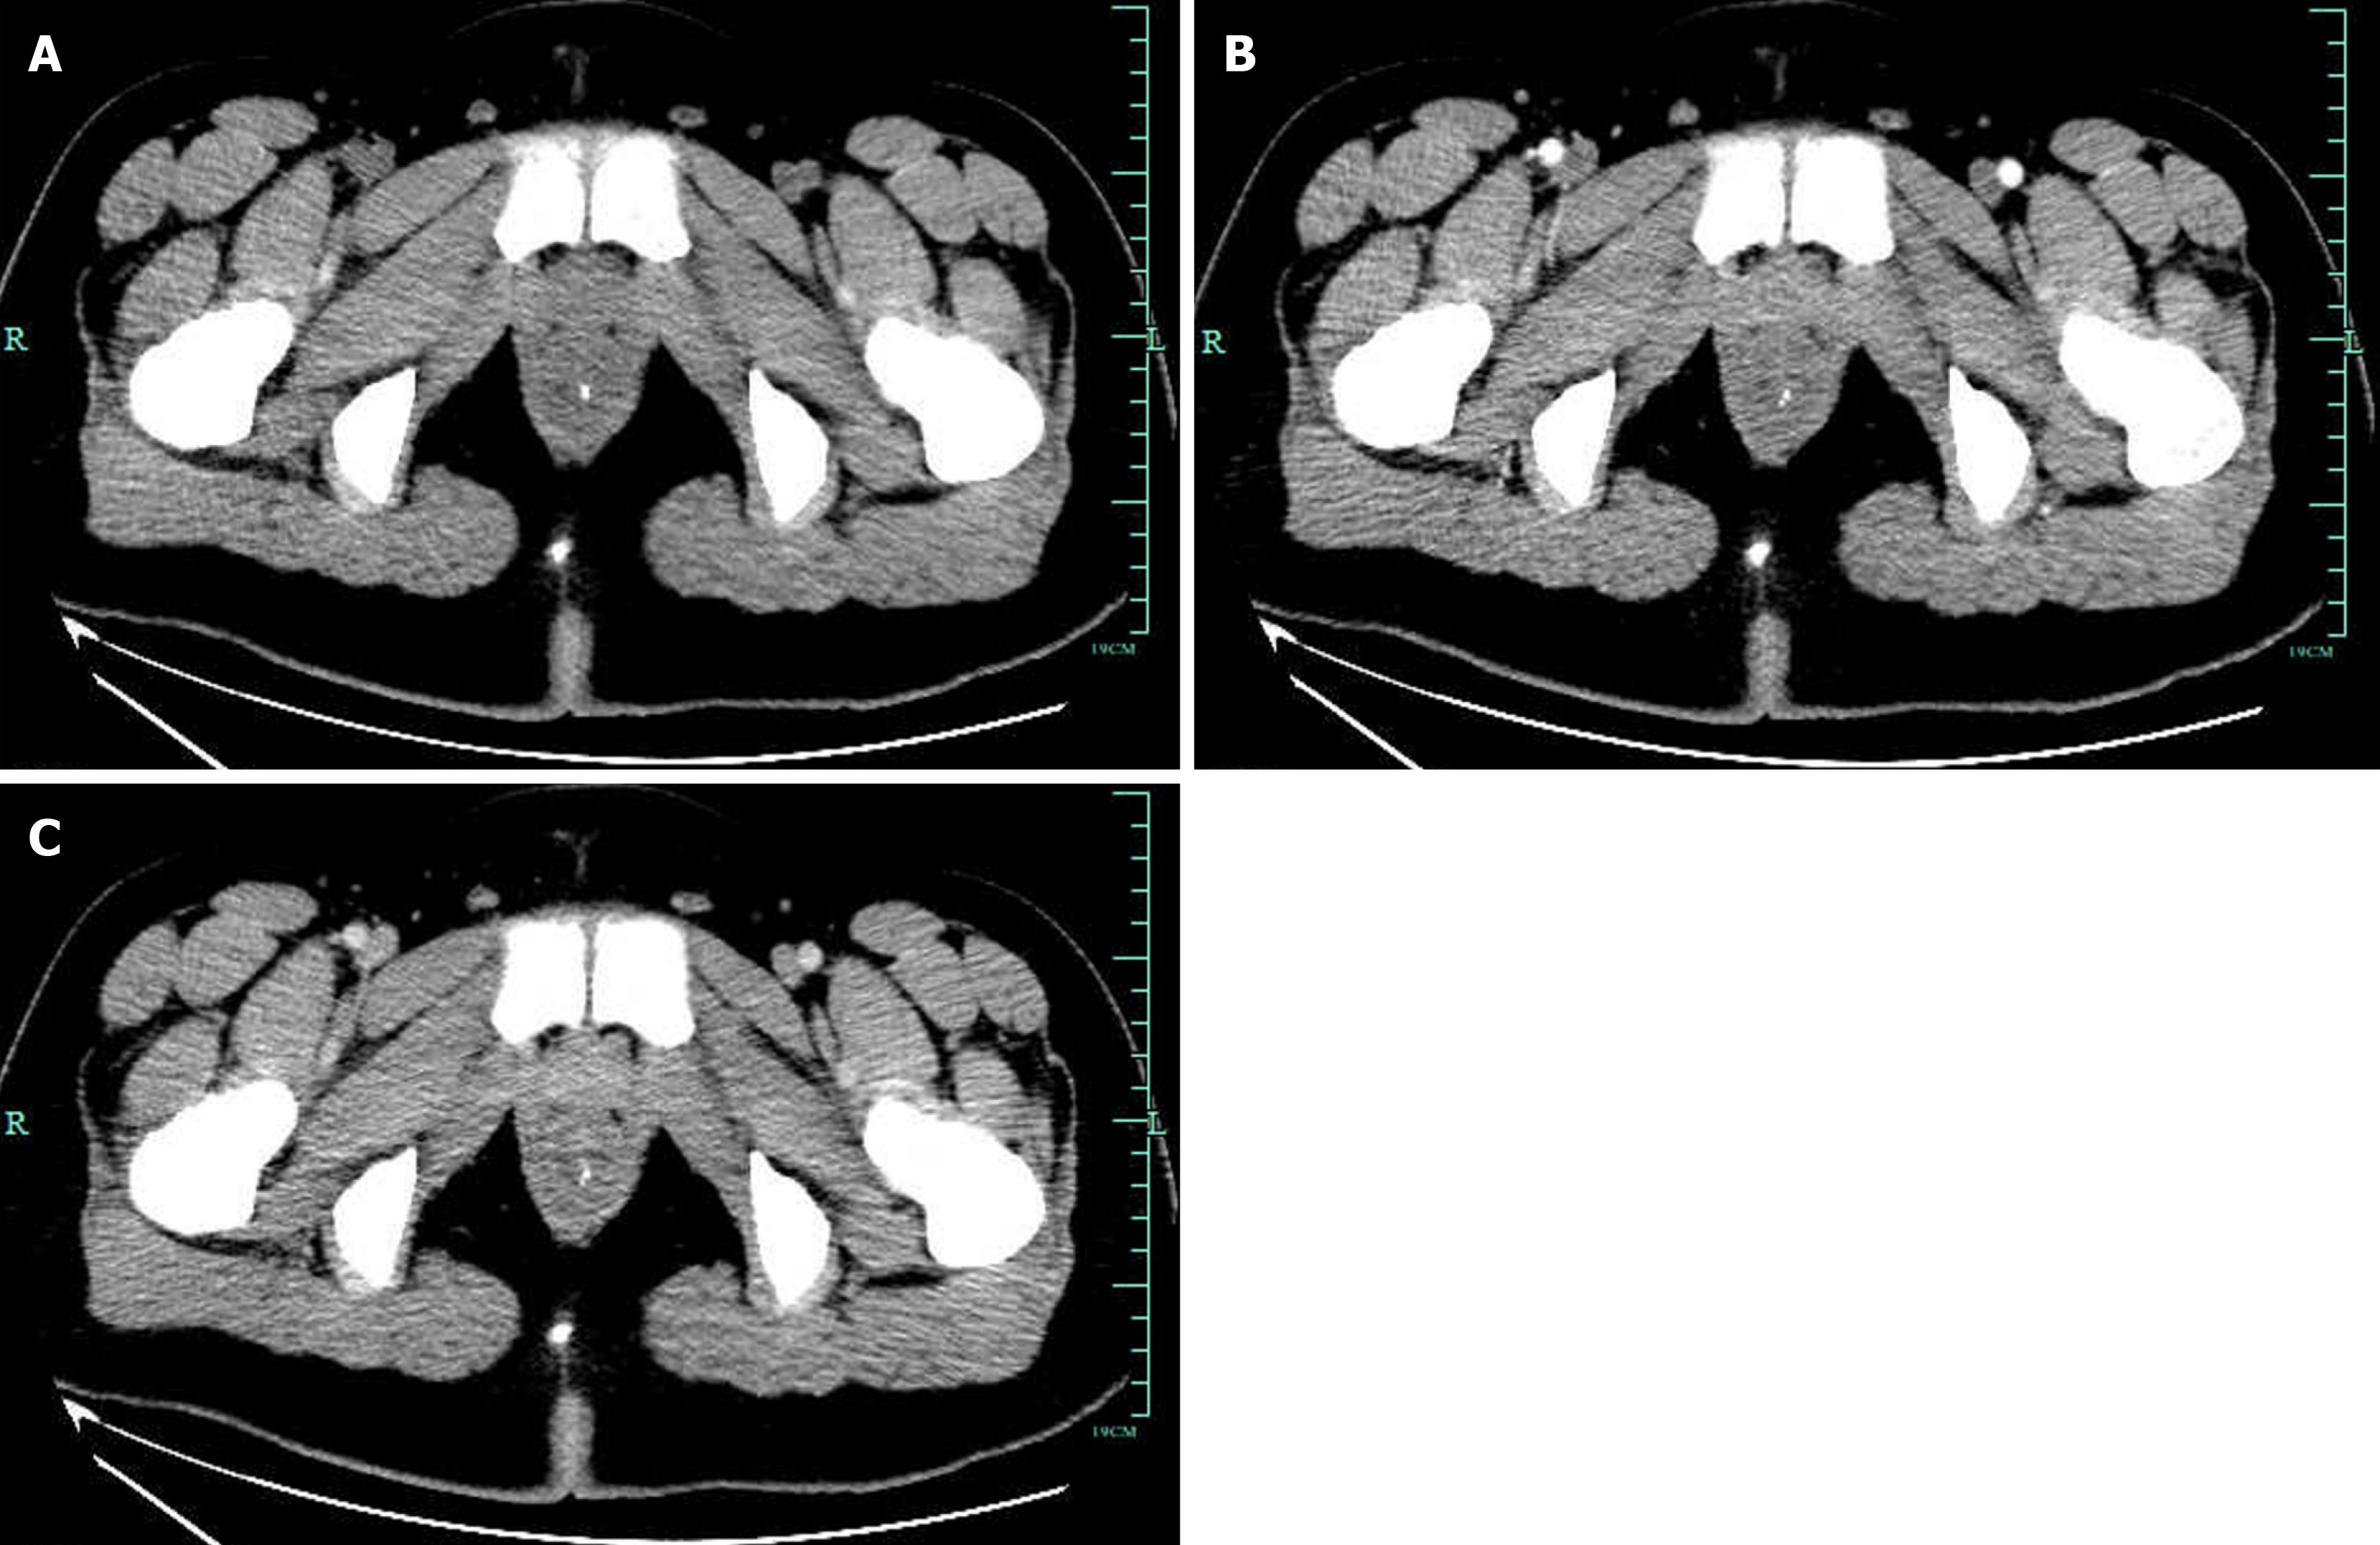
Figure 1 Enhanced total abdominal computed tomography showing that part of the rectum was thickened with edema and numerous tiny calcification foci indicative of phleboliths.
A: Plain scan; B: Enhancement scan; C: Venous scan.
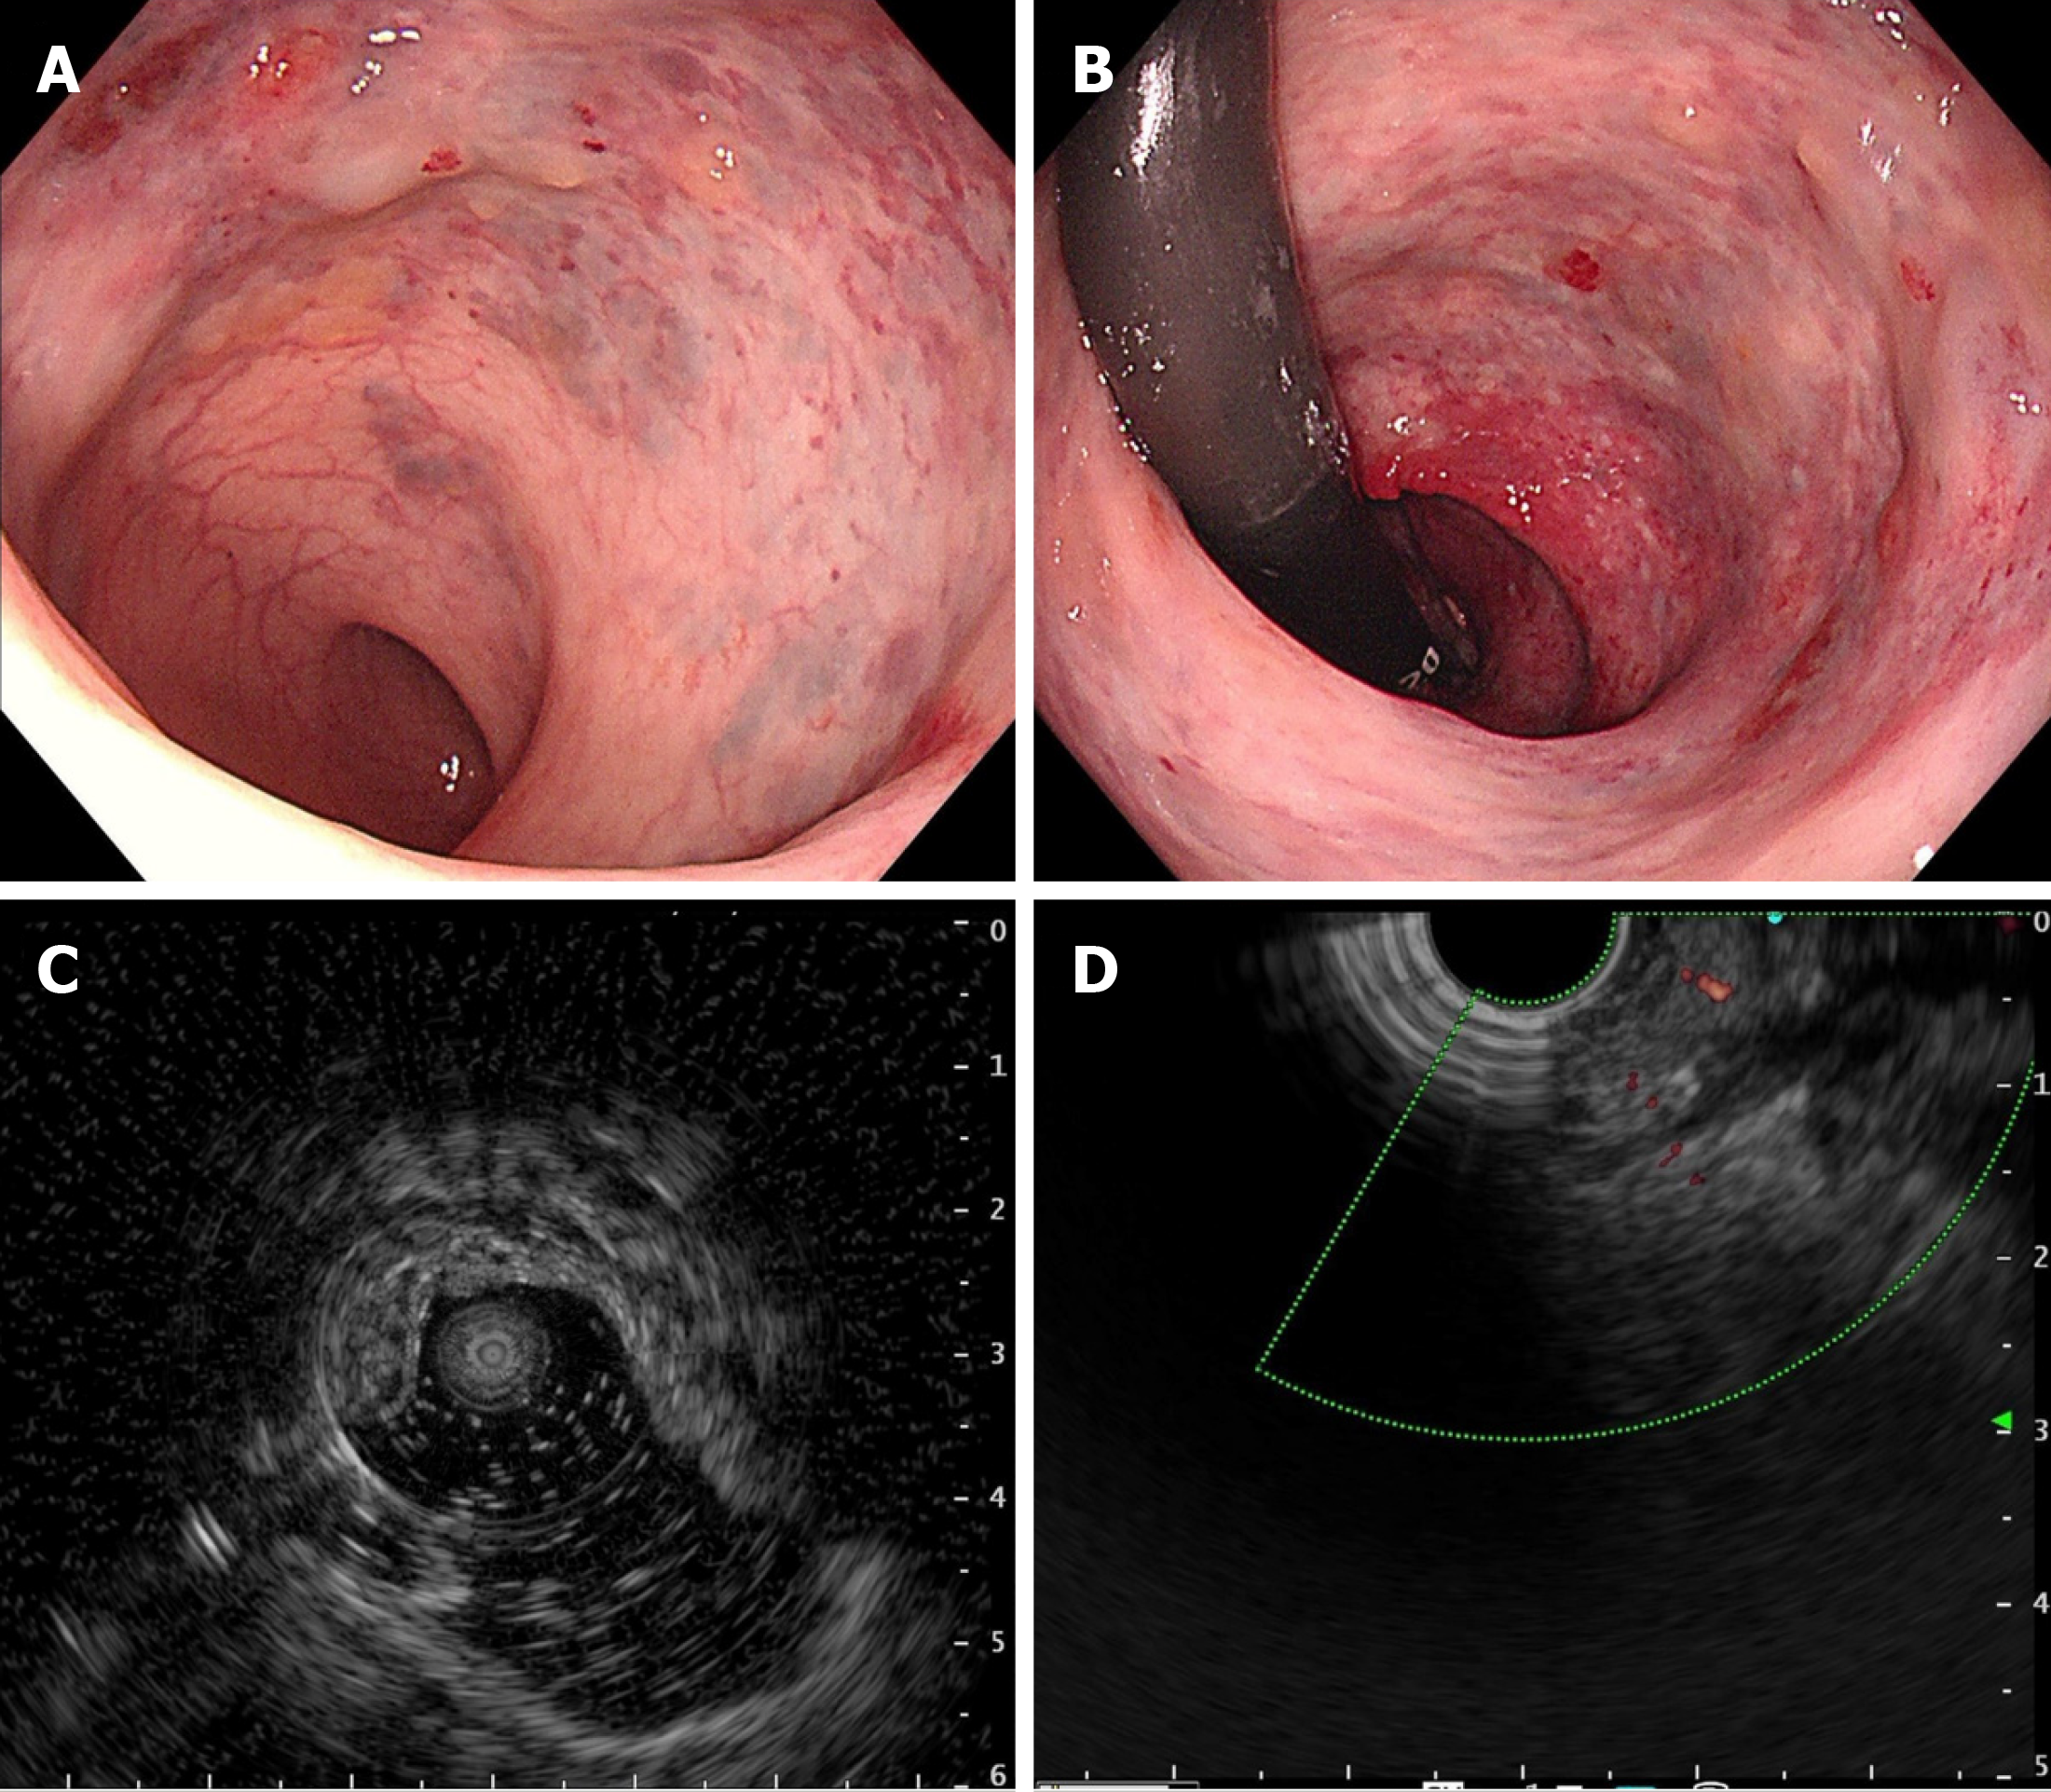
Figure 2 Colonoscopic and endoscopic ultrasound findings.
A and B: Colonoscopy showed blue–red elevated nodular lesions; C: Endoscopic ultrasound (EUS) of rectum showed a vascular signal in the submucosa; D: EUS with color Doppler confirmed the venous nature of the outflowing vessel.
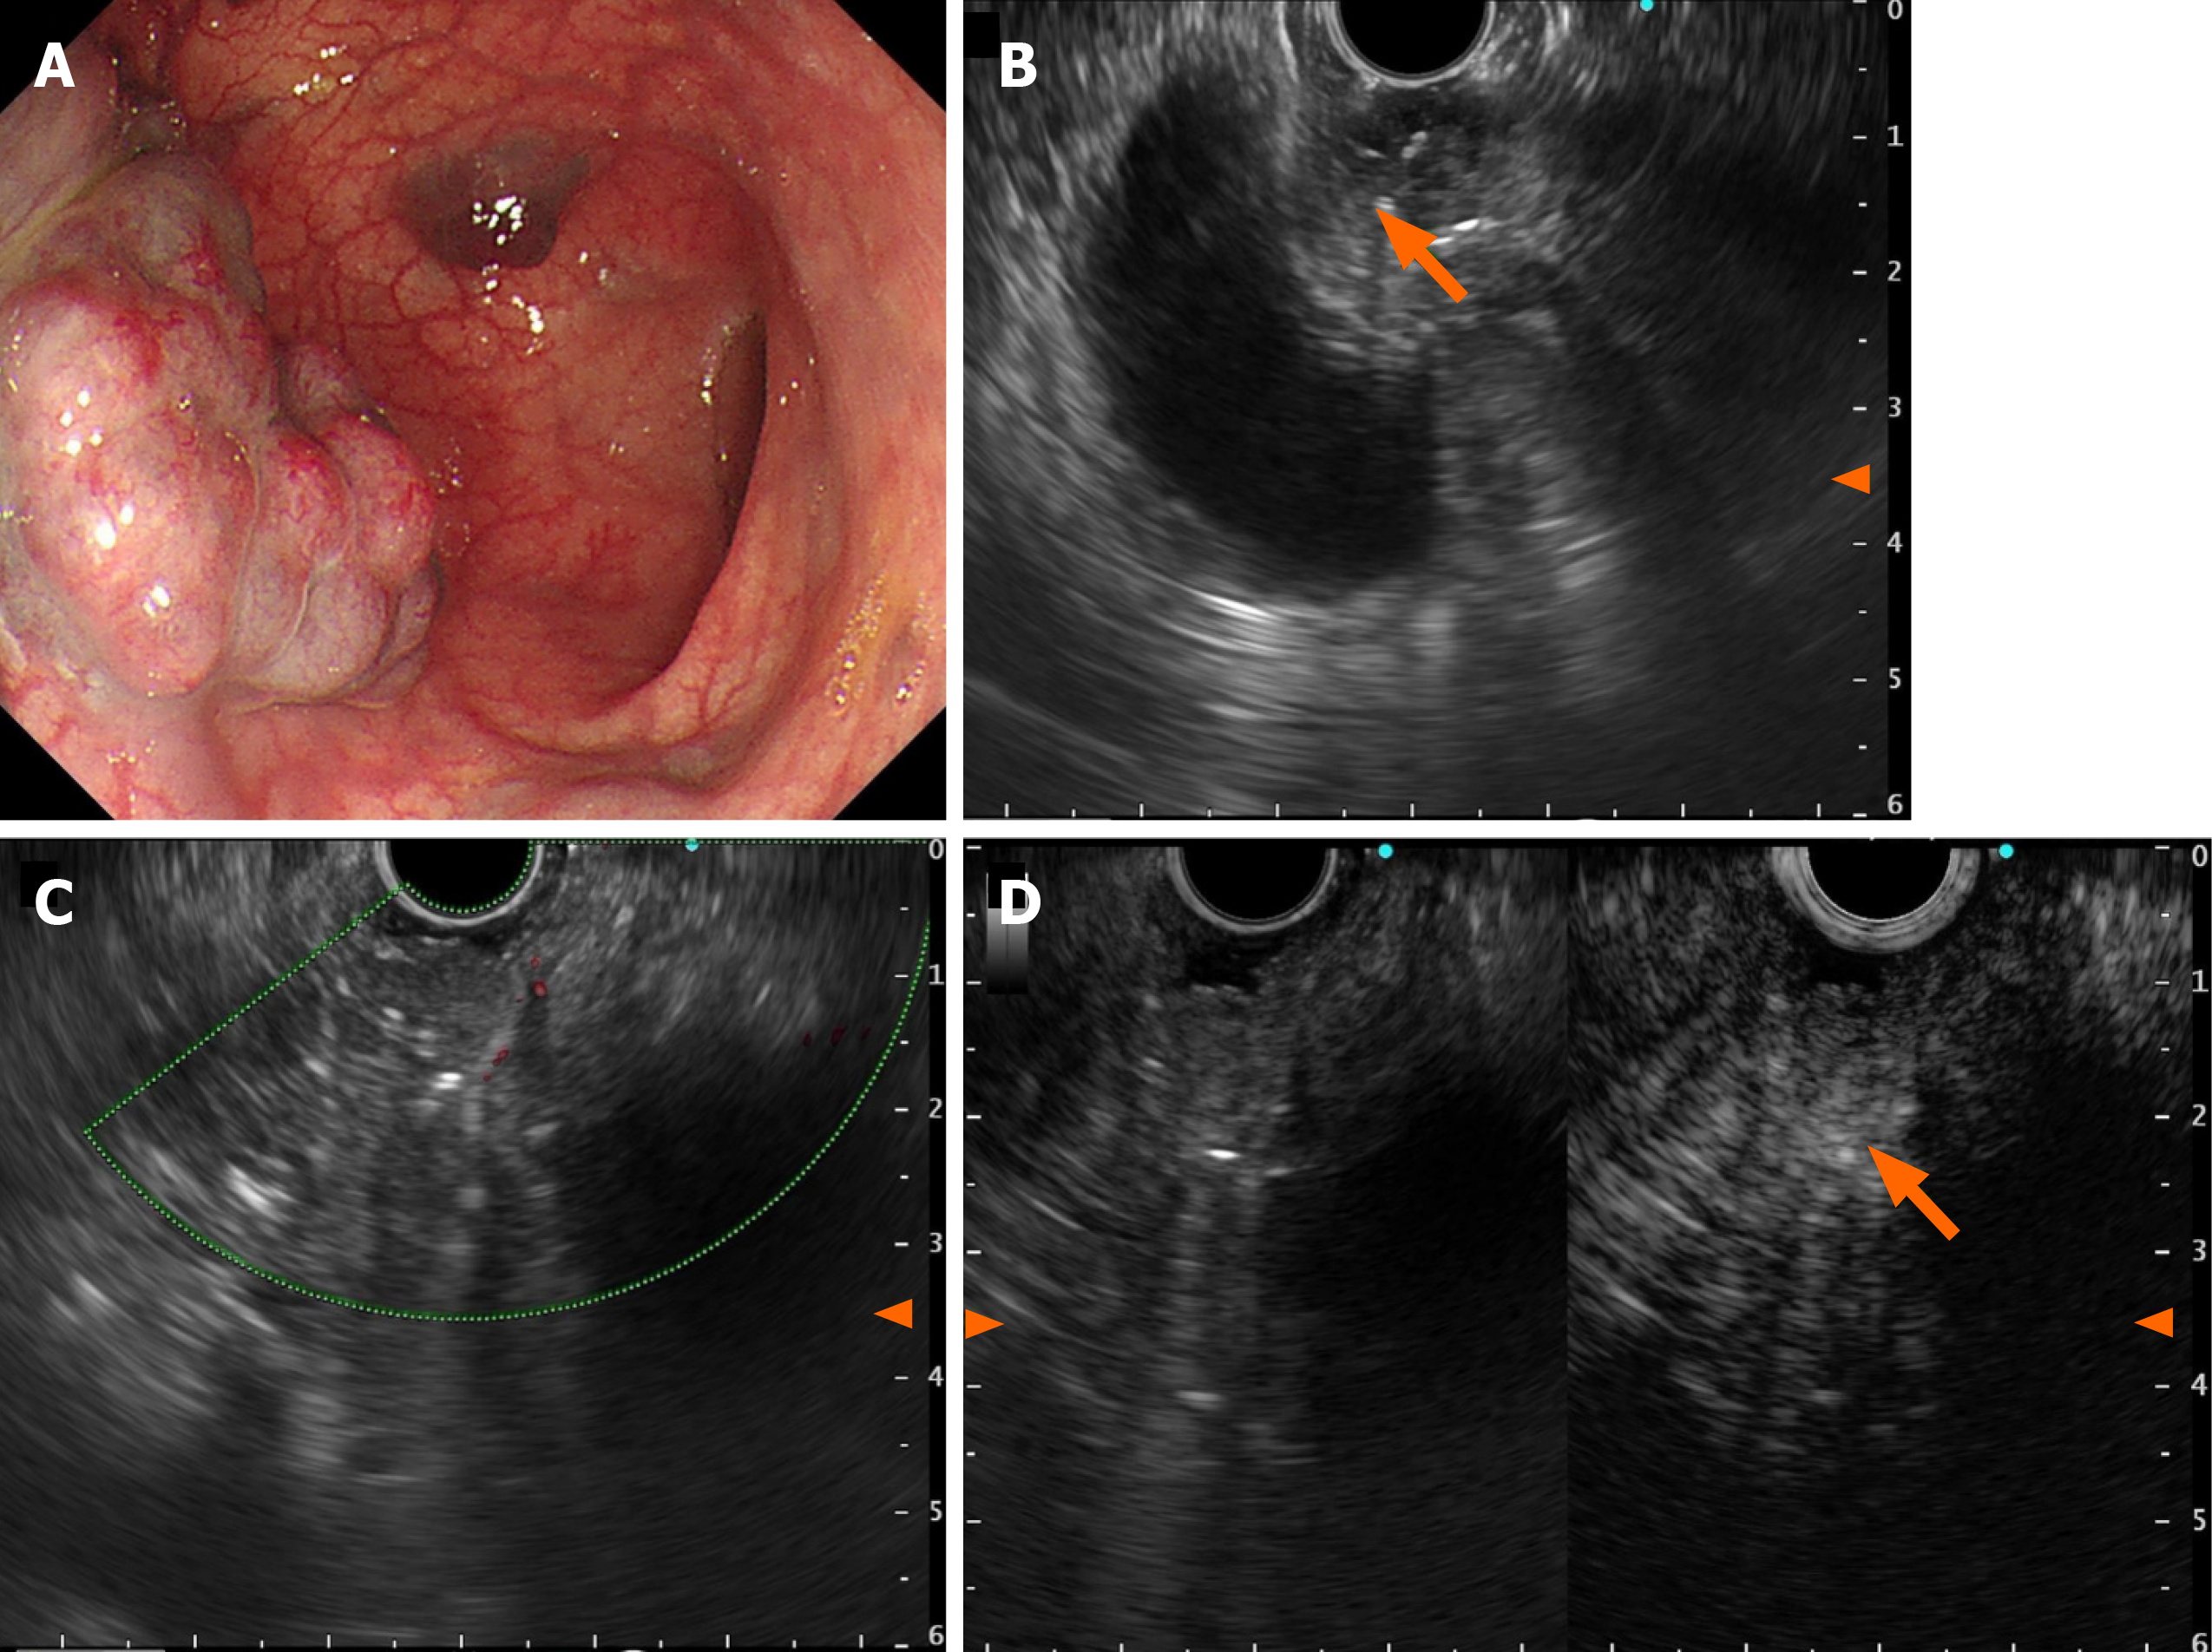
Figure 3 Endoscopic ultrasonography findings.
A: Multiple bluish-purple nodules limited to proximal sigmoid; B: Nonechoic vascular signal in the submucosa of the anterior wall of the sigmoid, and a minute septum-like structure was visible, with high echo spots in the partitions; C: Doppler ultrasound detected small internal strips of blood flow; D: SonoVue imaging showed small internal enhancement in the anechoic areas.
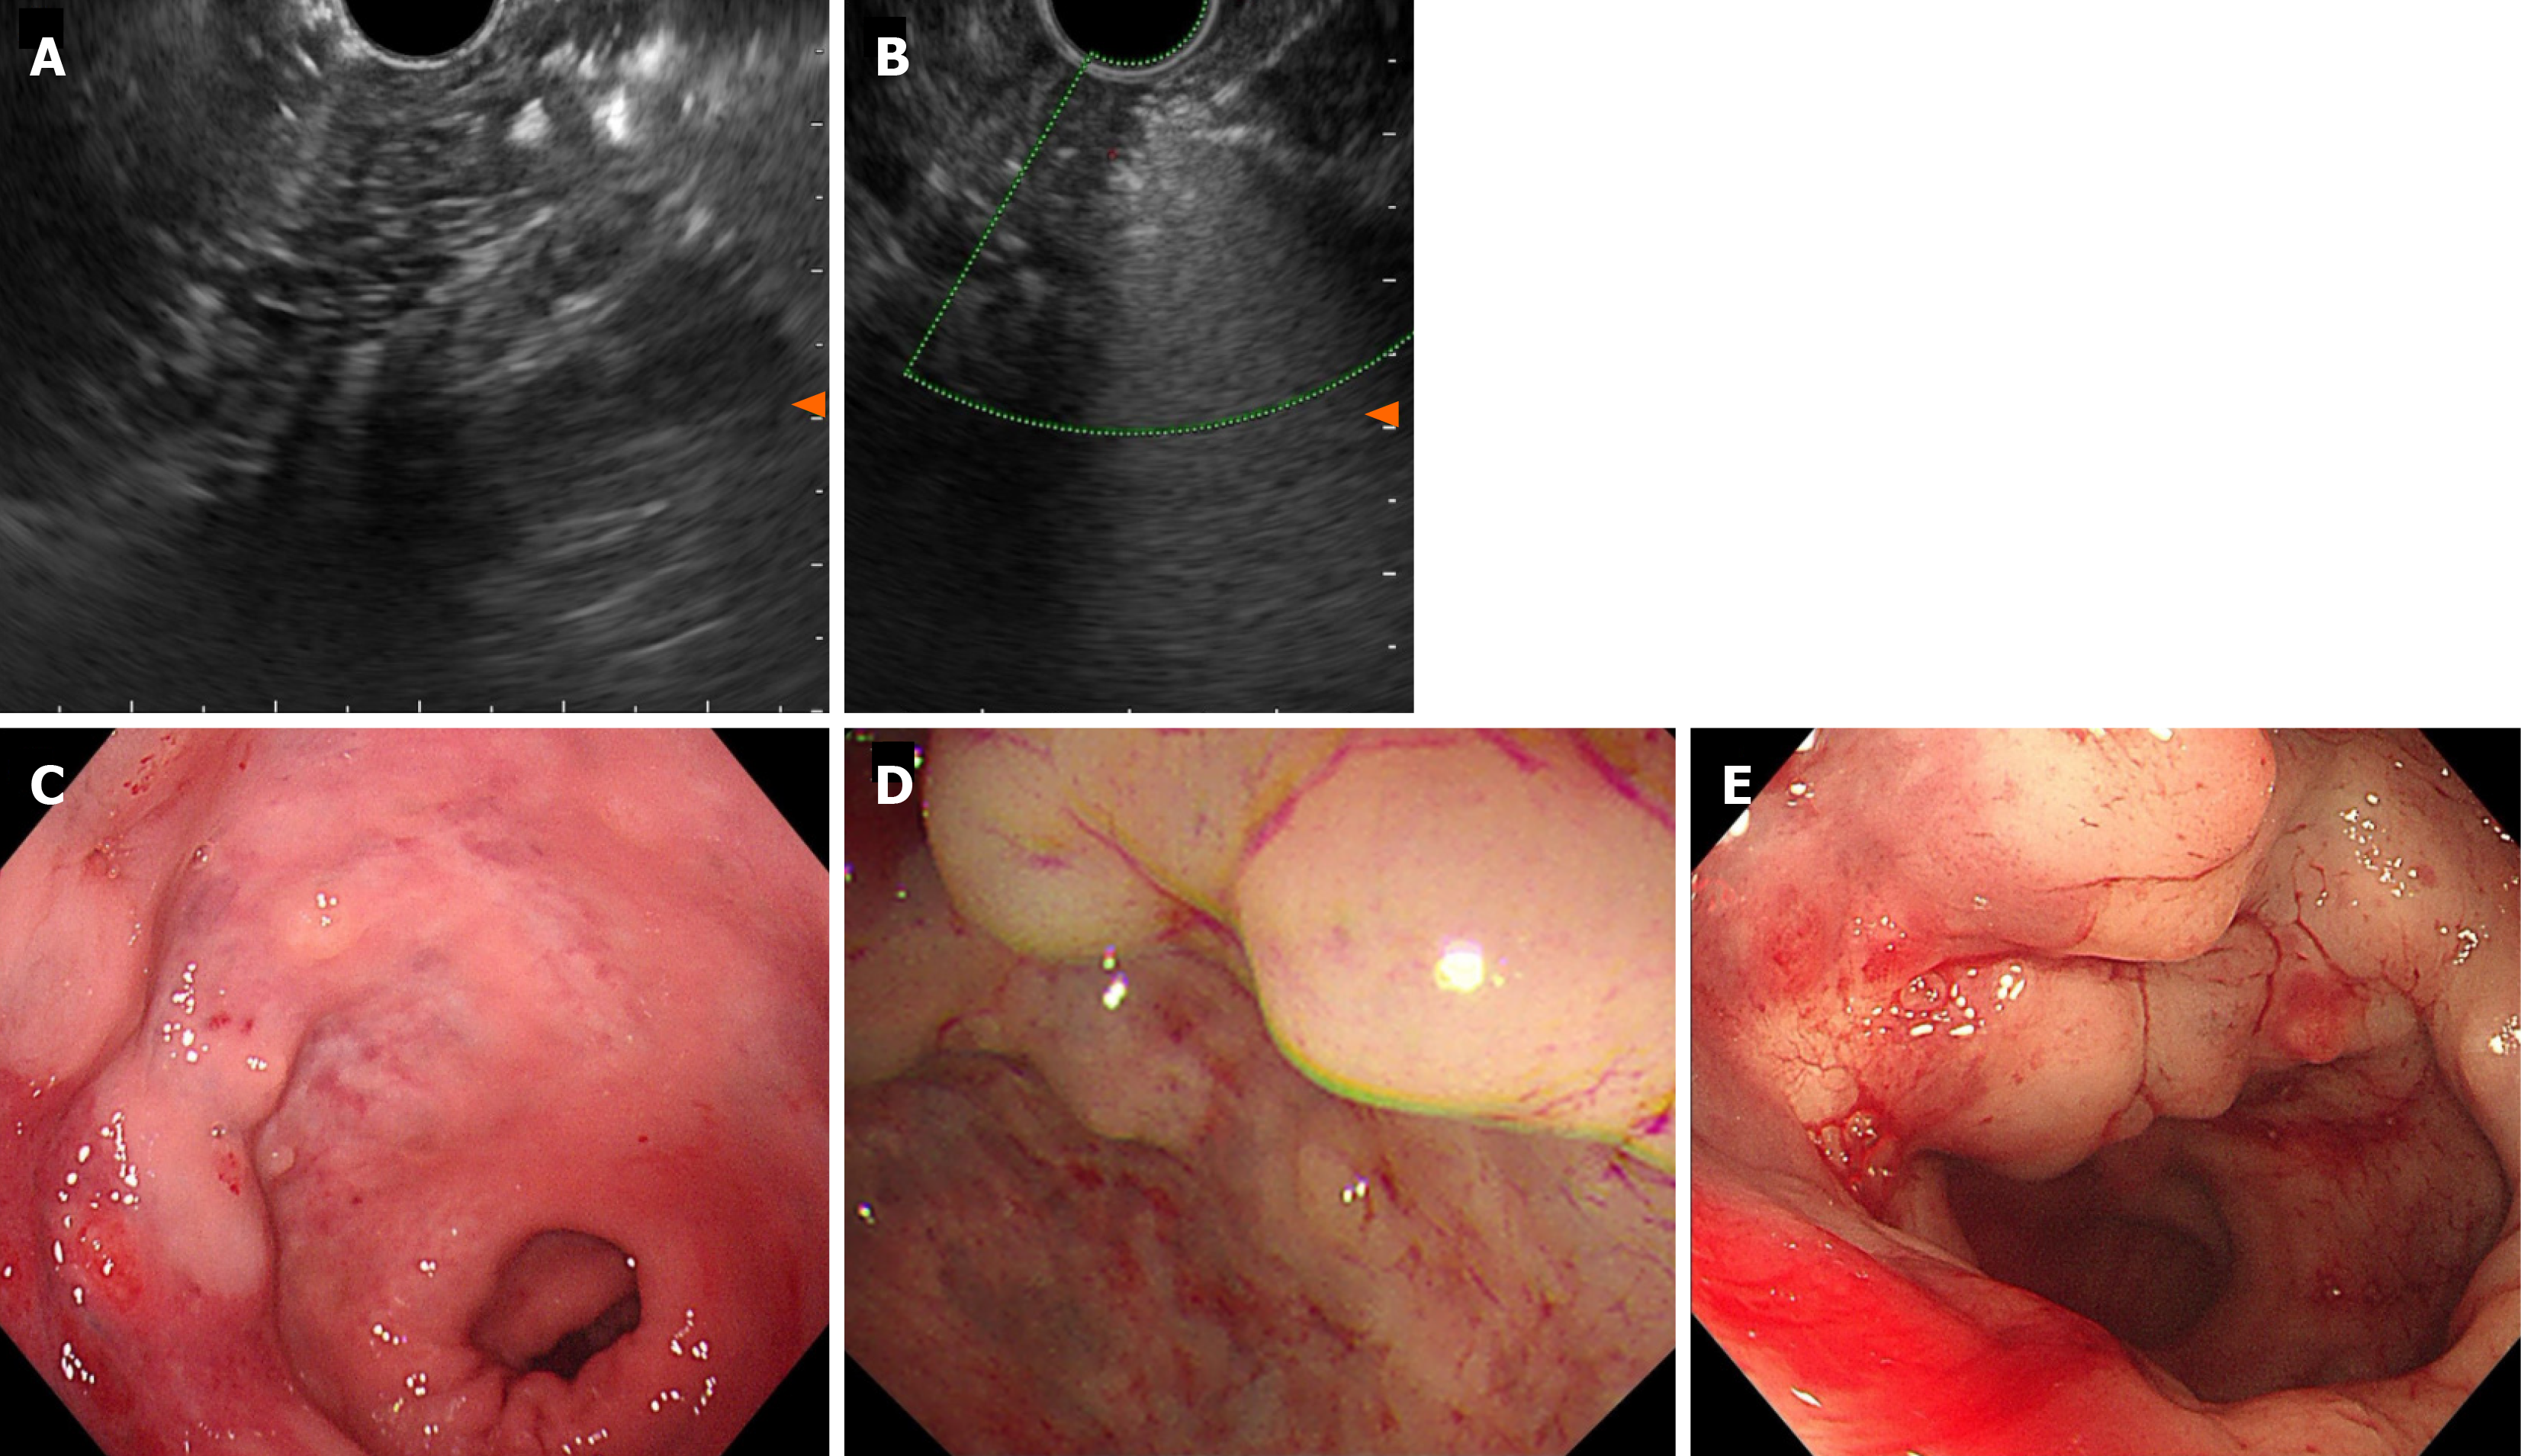
Figure 4 Endoscopic ultrasound after lauromacrogol treatment.
A: Endoscopic ultrasound (EUS) showed hyperechoic filling in the vascular lumen after injection. Elevated vascular mass was relieved after EUS-guided lauromacrogol injection; B: EUS with color Doppler US showed that the blood flow signal disappeared; C: First scan; D: Second scan; E: Third scan.
Figure 5 Endoscopic examination after lauromacrogol treatment.
A and B: The size and scope of hemangiomas in each case were significantly reduced; C: There were only two small cavernous hemangiomas. Ulcers and scars were seen in the hemangioma areas after three sclerotherapy injections.
- Citation: Zhu HT, Chen WG, Wang JJ, Guo JN, Zhang FM, Xu GQ, Chen HT. Endoscopic ultrasound-guided lauromacrogol injection for treatment of colorectal cavernous hemangioma: Two case reports. World J Gastrointest Surg 2024; 16(3): 966-973
- URL: https://www.wjgnet.com/1948-9366/full/v16/i3/966.htm
- DOI: https://dx.doi.org/10.4240/wjgs.v16.i3.966


