Copyright
©The Author(s) 2024.
World J Gastrointest Surg. Mar 27, 2024; 16(3): 921-931
Published online Mar 27, 2024. doi: 10.4240/wjgs.v16.i3.921
Published online Mar 27, 2024. doi: 10.4240/wjgs.v16.i3.921
Figure 1
Flowchart showing the process and results of the literature screening.
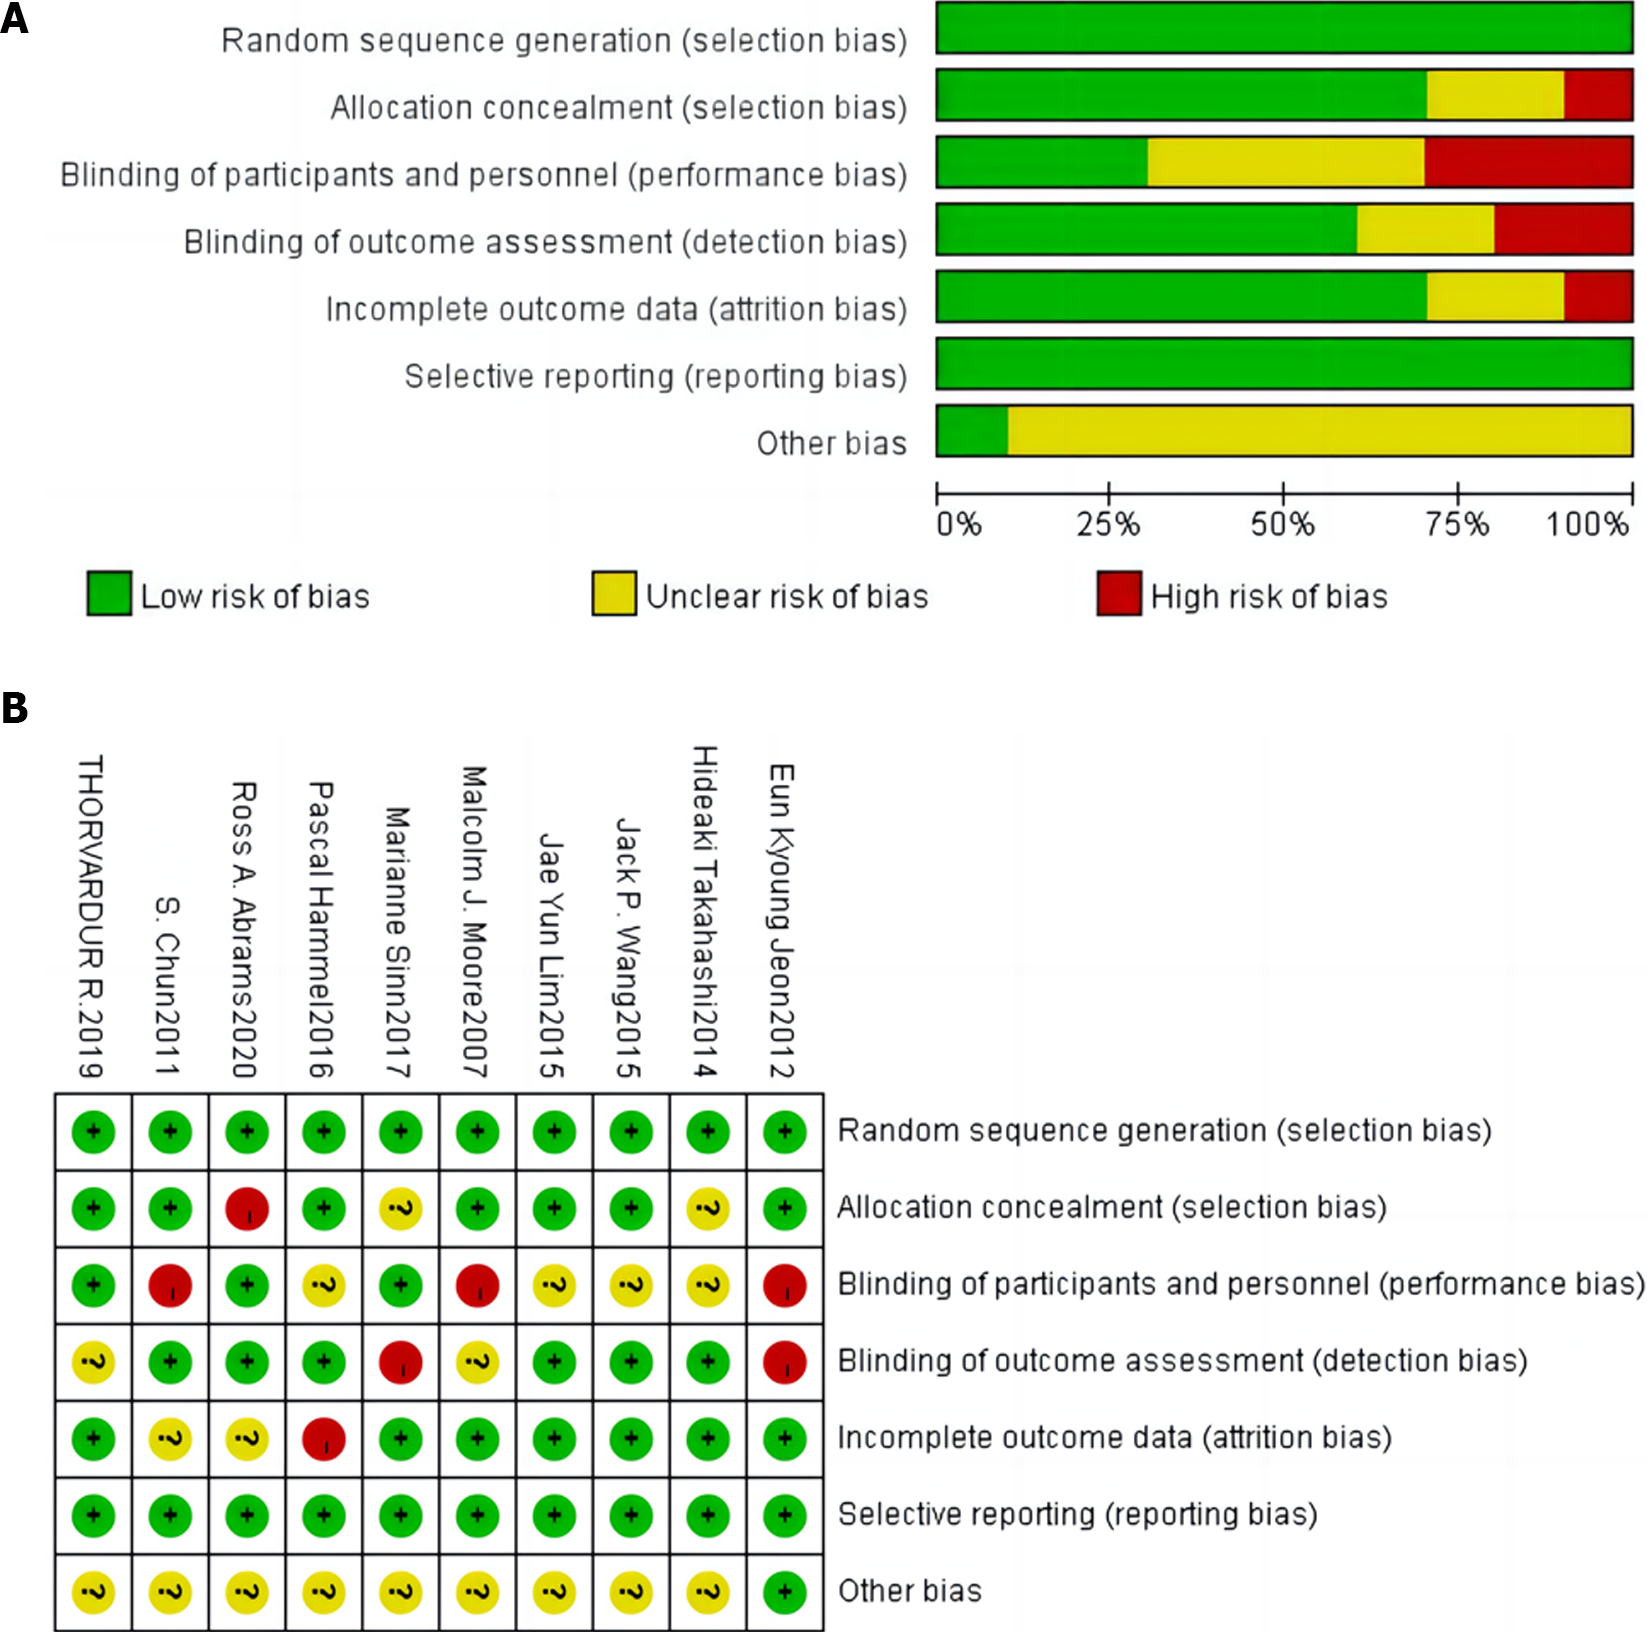
Figure 2
Literature bias evaluation chart.
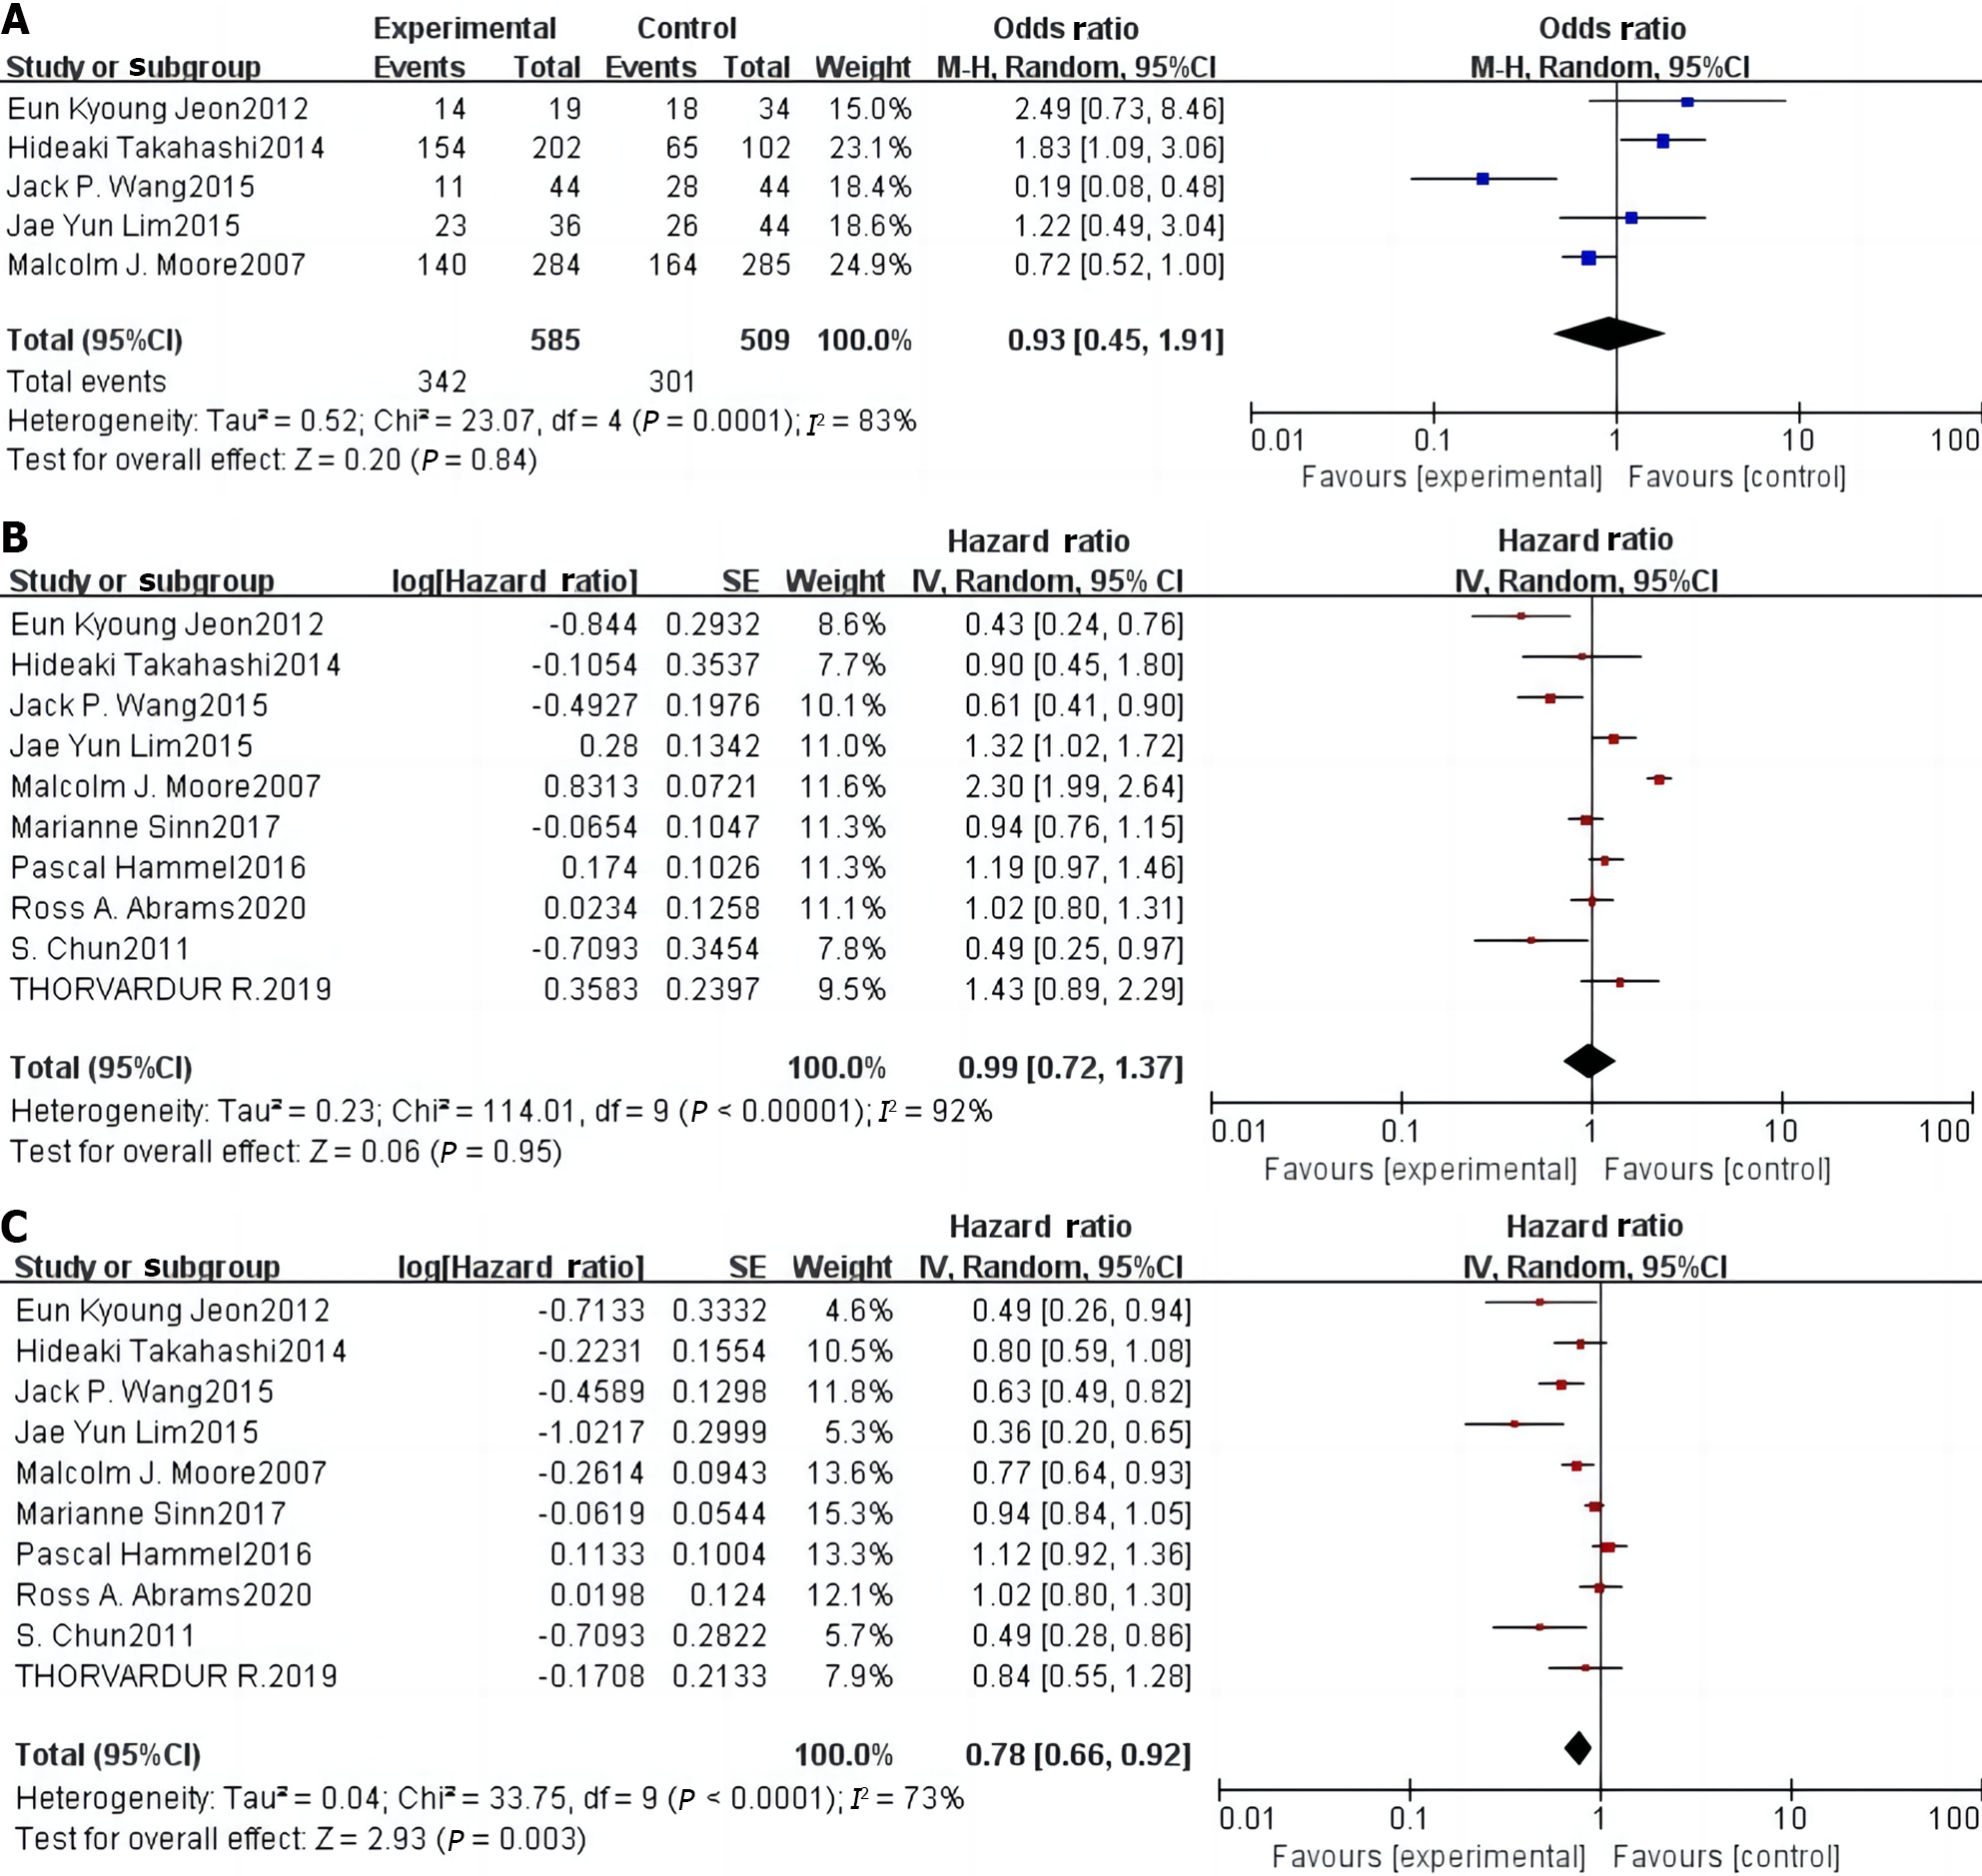
Figure 3 Forest plot of the meta-analysis of disease control rate, overall survival, and progression-free survival in the two groups.
A: Disease control rate; B: Overall survival; C: Progression-free survival.
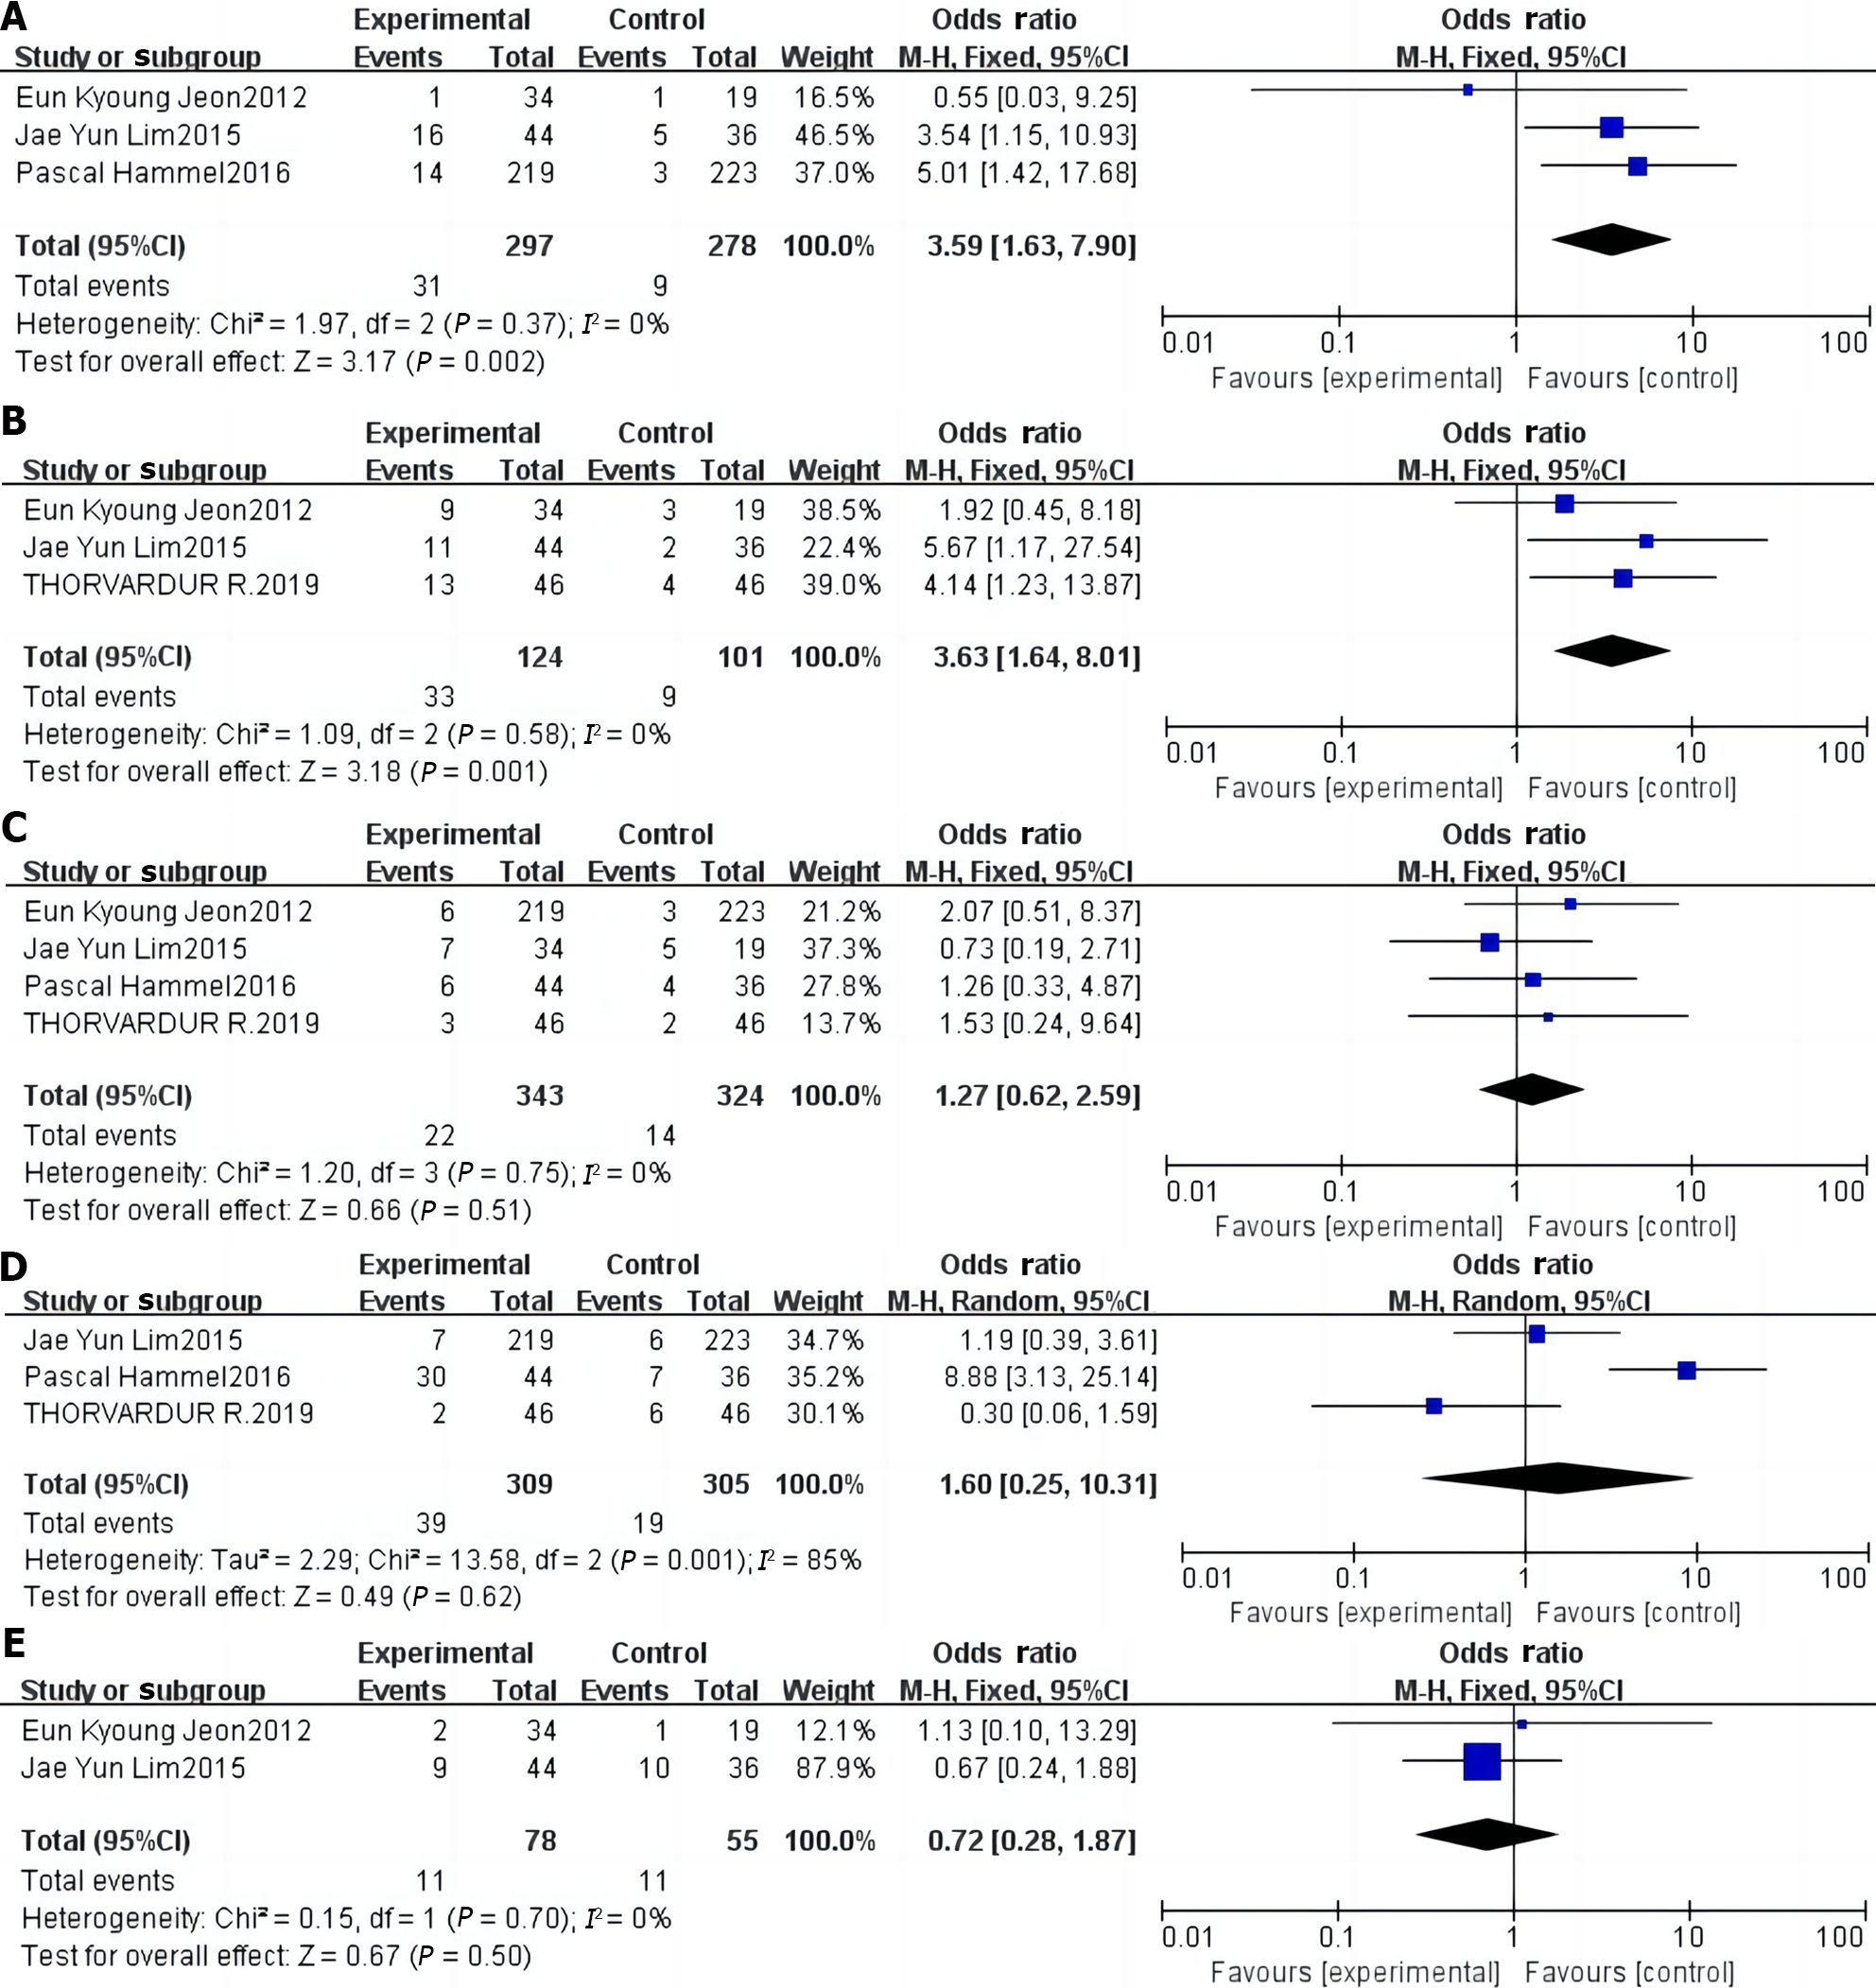
Figure 4 Forest plot of the meta-analysis comparing the incidence of adverse reactions in the two study groups.
A: Incidence of diarrhea; B: Incidence of rashes; C: Incidence of vomiting; D: Regurgitation/anorexia; E: Infections.
Figure 5 Plot of publication bias.
A: Funnel plot depicting publication bias in the literature reporting disease control rate; B: Funnel plot depicting publication bias in the literature reporting overall survival; C: Funnel plot of publication bias in the literature reporting the incidence of progression-free survival; D: Funnel plot of publication bias in the literature reporting the incidence of regurgitation of anorexia nervosa; E: Inverted funnel plot of publication bias in the literature reporting the incidence of vomiting; F: Inverted funnel plot of publication bias in the literature reporting the incidence of diarrhea; G: Inverted funnel plot of publication bias in studies reporting the incidence of infections; H: Inverted funnel plot of publication bias in studies reporting the incidence of rashes.
- Citation: Liu XY, Pan HN, Yu Y. Clinical efficacy and safety of erlotinib combined with chemotherapy in the treatment of advanced pancreatic cancer: A meta-analysis. World J Gastrointest Surg 2024; 16(3): 921-931
- URL: https://www.wjgnet.com/1948-9366/full/v16/i3/921.htm
- DOI: https://dx.doi.org/10.4240/wjgs.v16.i3.921


