Copyright
©The Author(s) 2024.
World J Gastrointest Surg. Feb 27, 2024; 16(2): 518-528
Published online Feb 27, 2024. doi: 10.4240/wjgs.v16.i2.518
Published online Feb 27, 2024. doi: 10.4240/wjgs.v16.i2.518
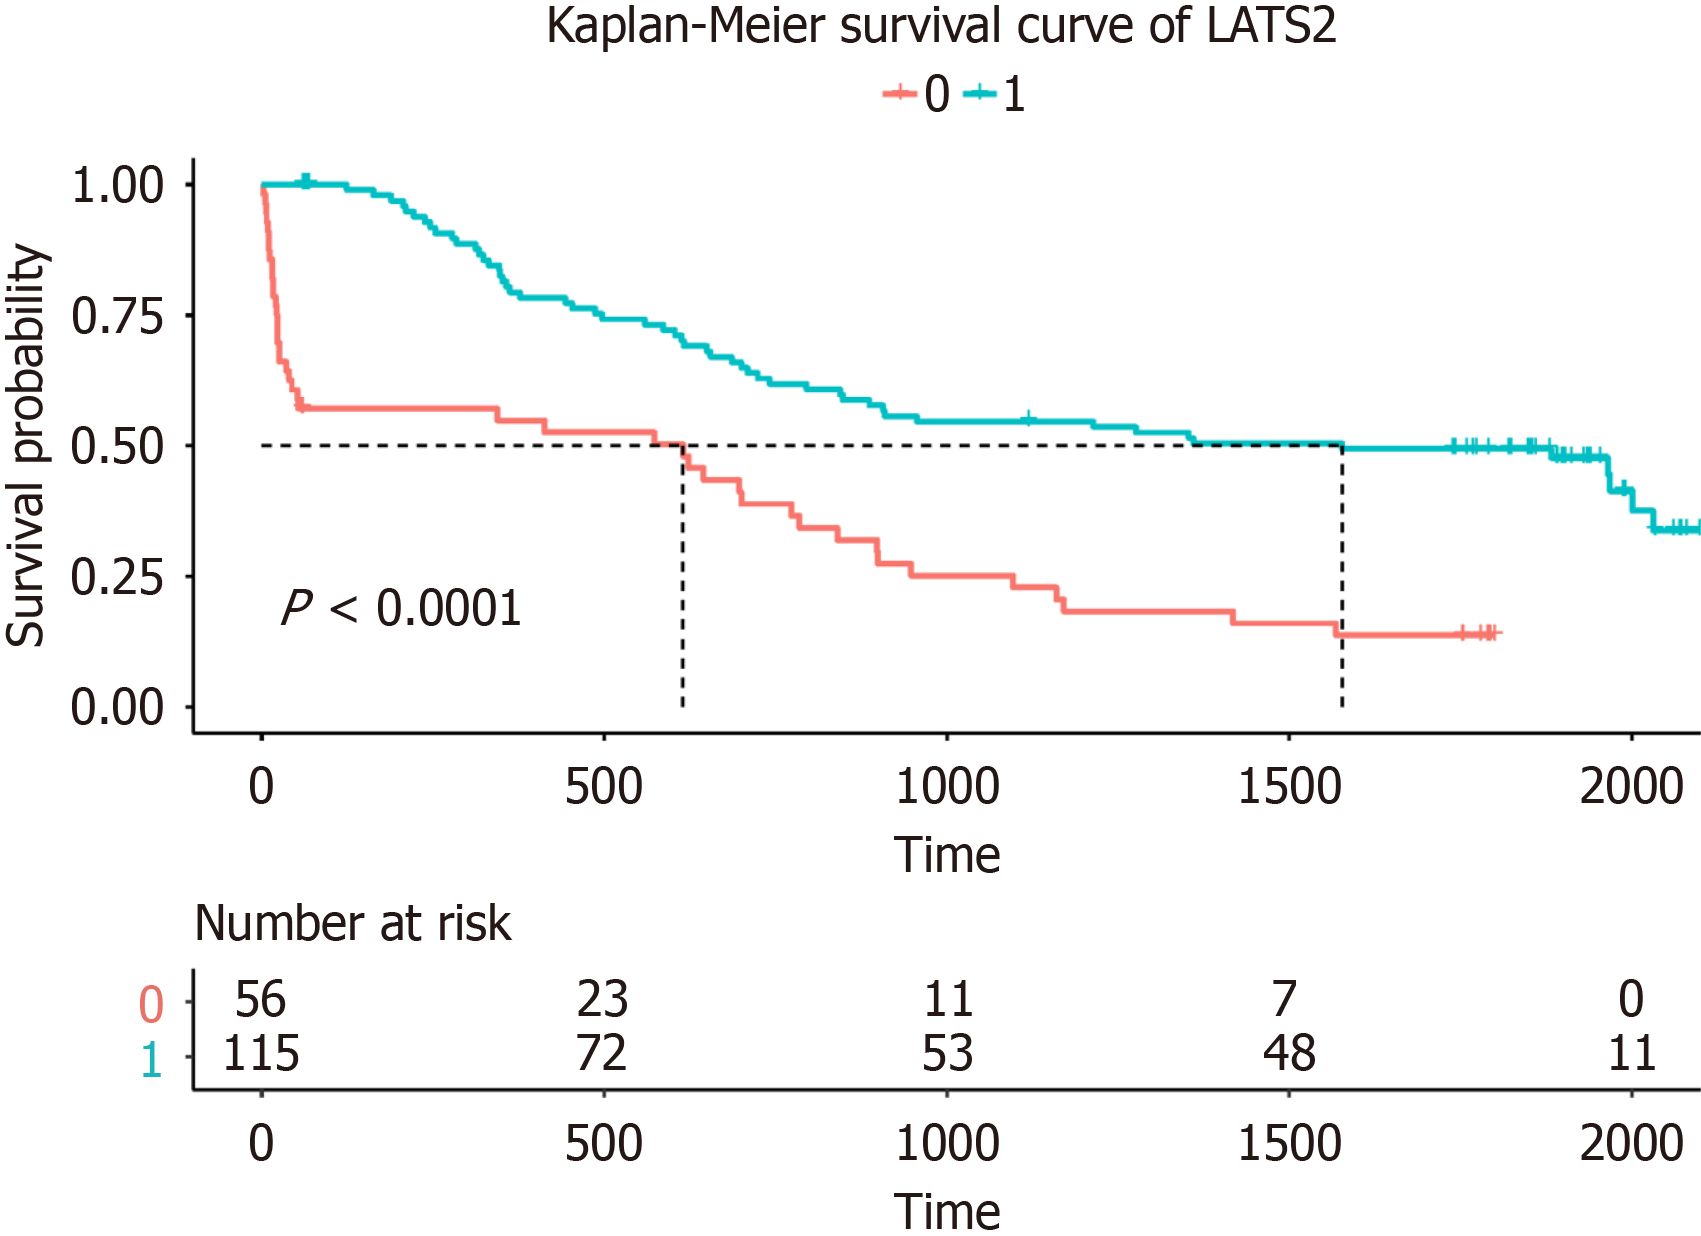
Figure 1 Kaplan-Meier survival curve for LATS2 expression.
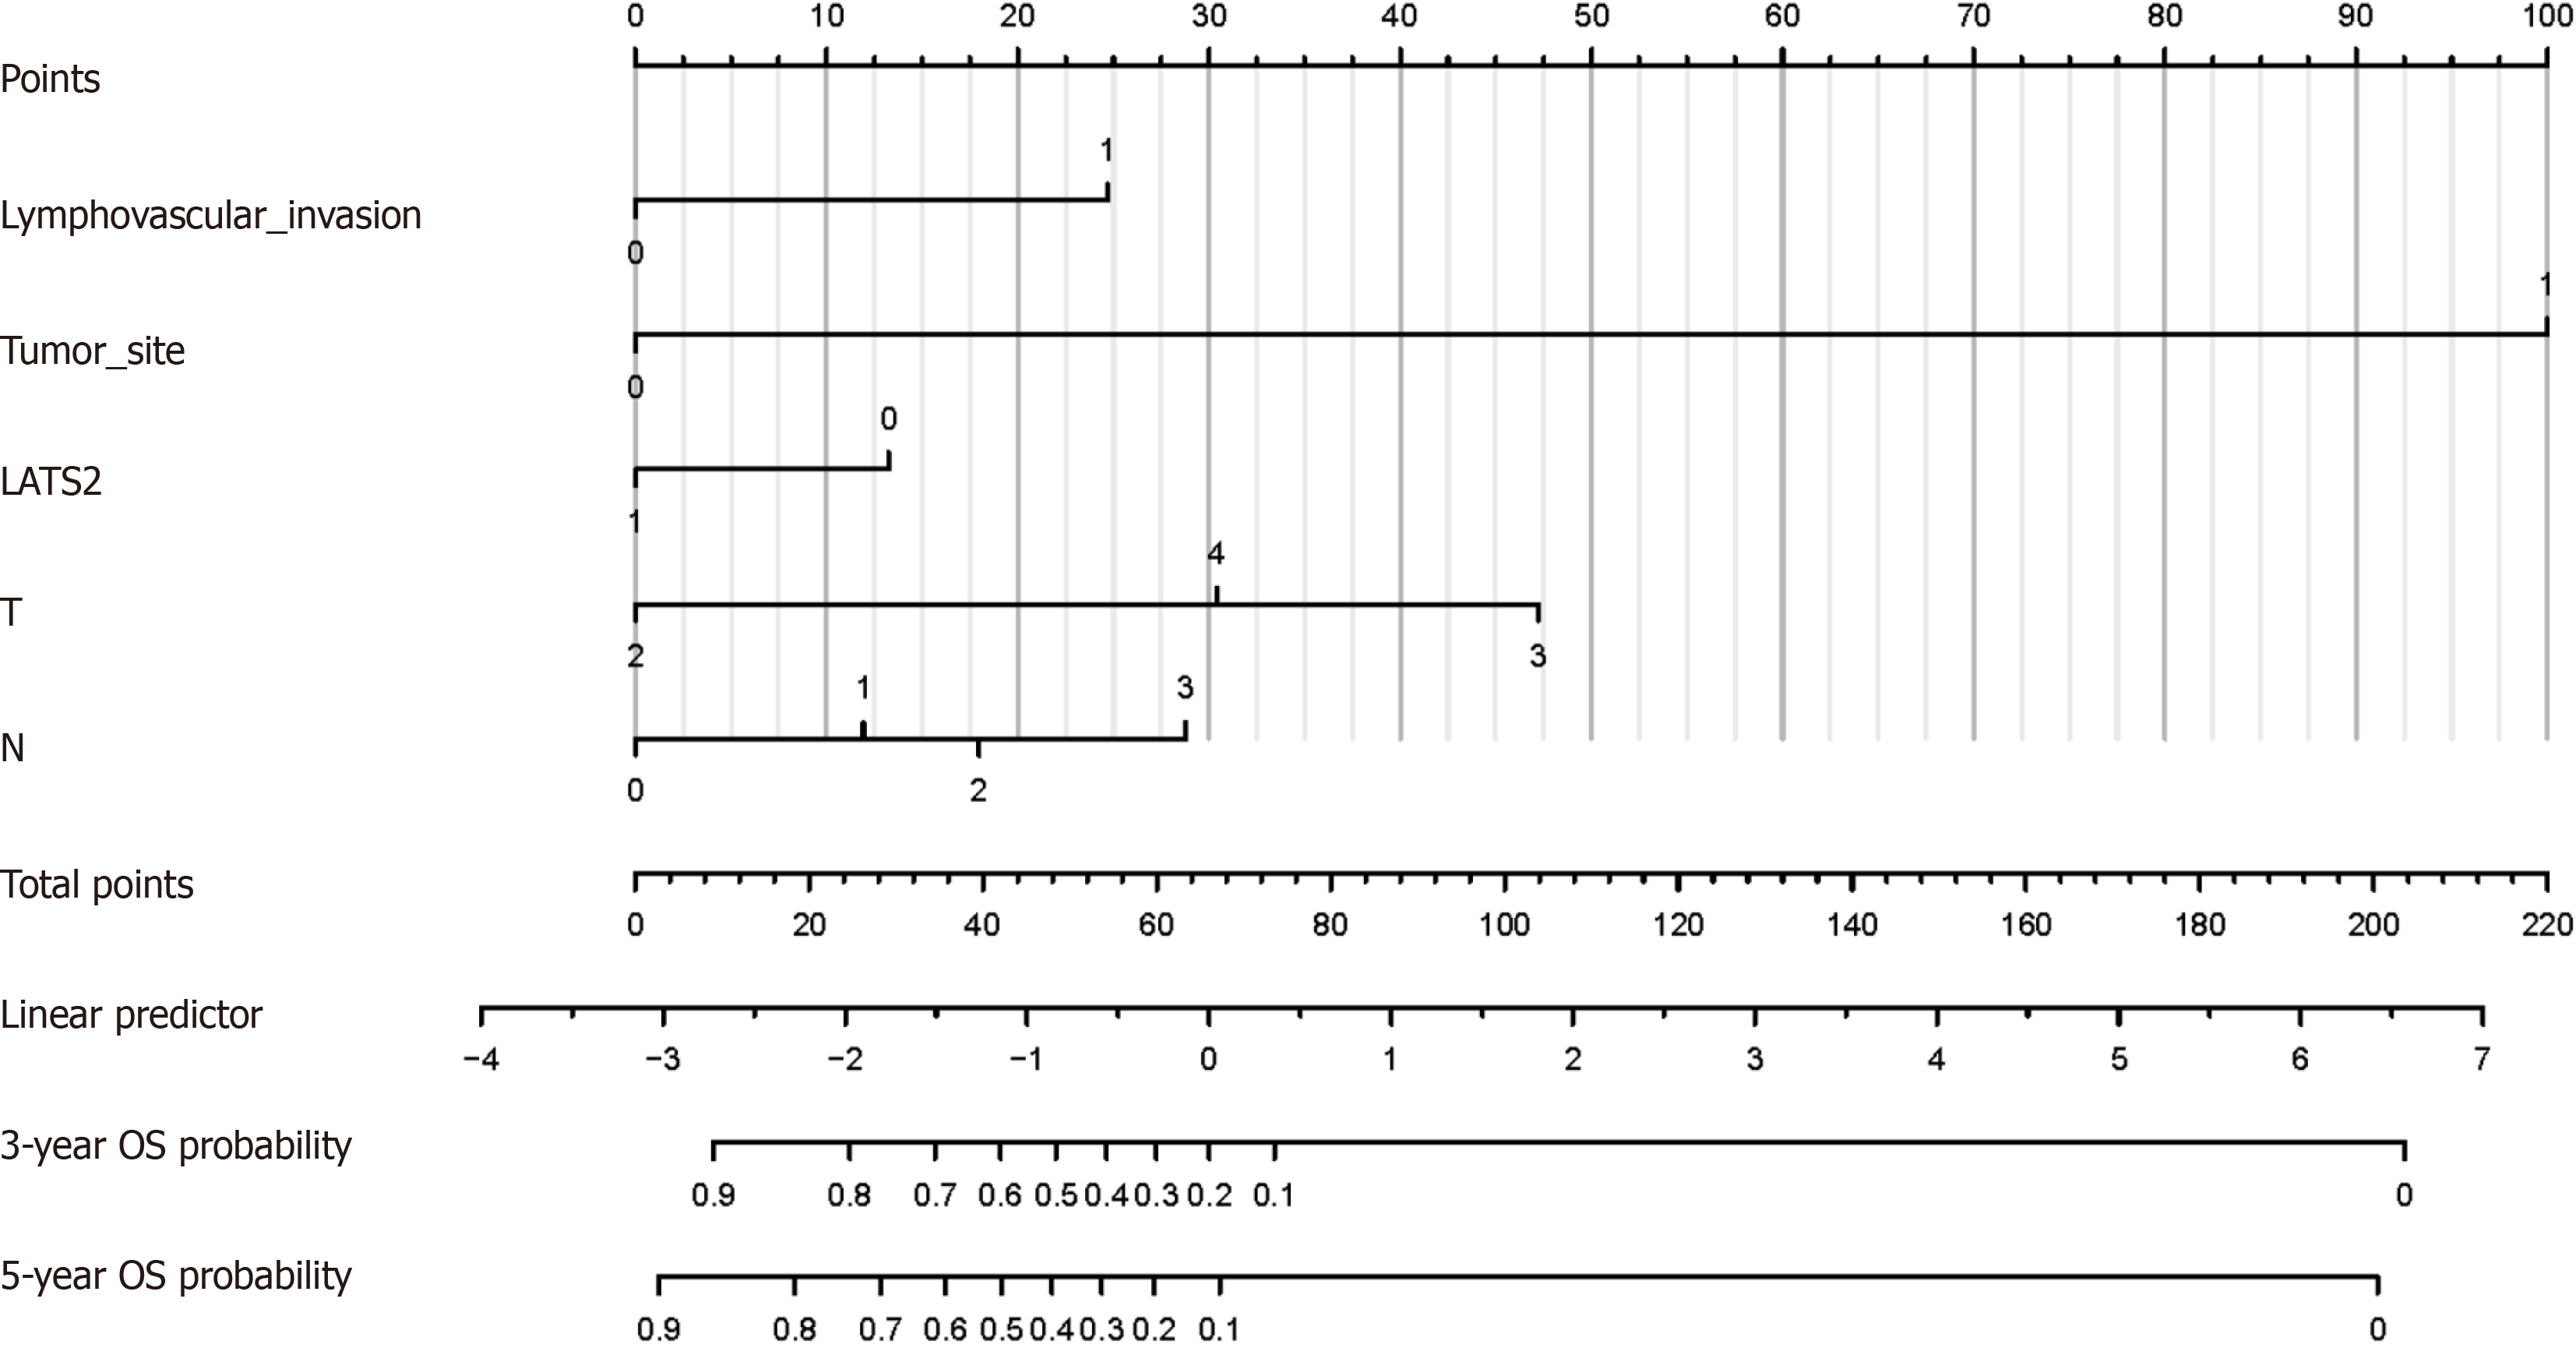
Figure 2 Nomogram consisting of lymphatic invasion, LATS2, tumor size, and T and N stages.
Figure 3 Receiver operating characteristic curve of training set.
A: Receiver operating characteristic (ROC) curve of TN stage; B: ROC curve of TN stage + LATS2; C: ROC curve of the target model.
Figure 4 Receiver operating characteristic curve of validation set.
A: Receiver operating characteristic (ROC) curve of TN stage; B: ROC curve of TN stage + LATS2; C: ROC curve of the target model.
Figure 5 Calibration diagram of training set.
A: Calibration diagram of TN stage; B: Calibration diagram of TN stage +LATS2; C: Calibration plot of the target model.
Figure 6 Calibration diagram of validation set.
A: Calibration diagram of TN stage; B: Calibration diagram of TN stage +LATS2; C: Calibration plot of the target model.
- Citation: Sun N, Tan BB, Li Y. Nomogram model including LATS2 expression was constructed to predict the prognosis of advanced gastric cancer after surgery. World J Gastrointest Surg 2024; 16(2): 518-528
- URL: https://www.wjgnet.com/1948-9366/full/v16/i2/518.htm
- DOI: https://dx.doi.org/10.4240/wjgs.v16.i2.518


