Copyright
©The Author(s) 2024.
World J Gastrointest Surg. Feb 27, 2024; 16(2): 357-381
Published online Feb 27, 2024. doi: 10.4240/wjgs.v16.i2.357
Published online Feb 27, 2024. doi: 10.4240/wjgs.v16.i2.357
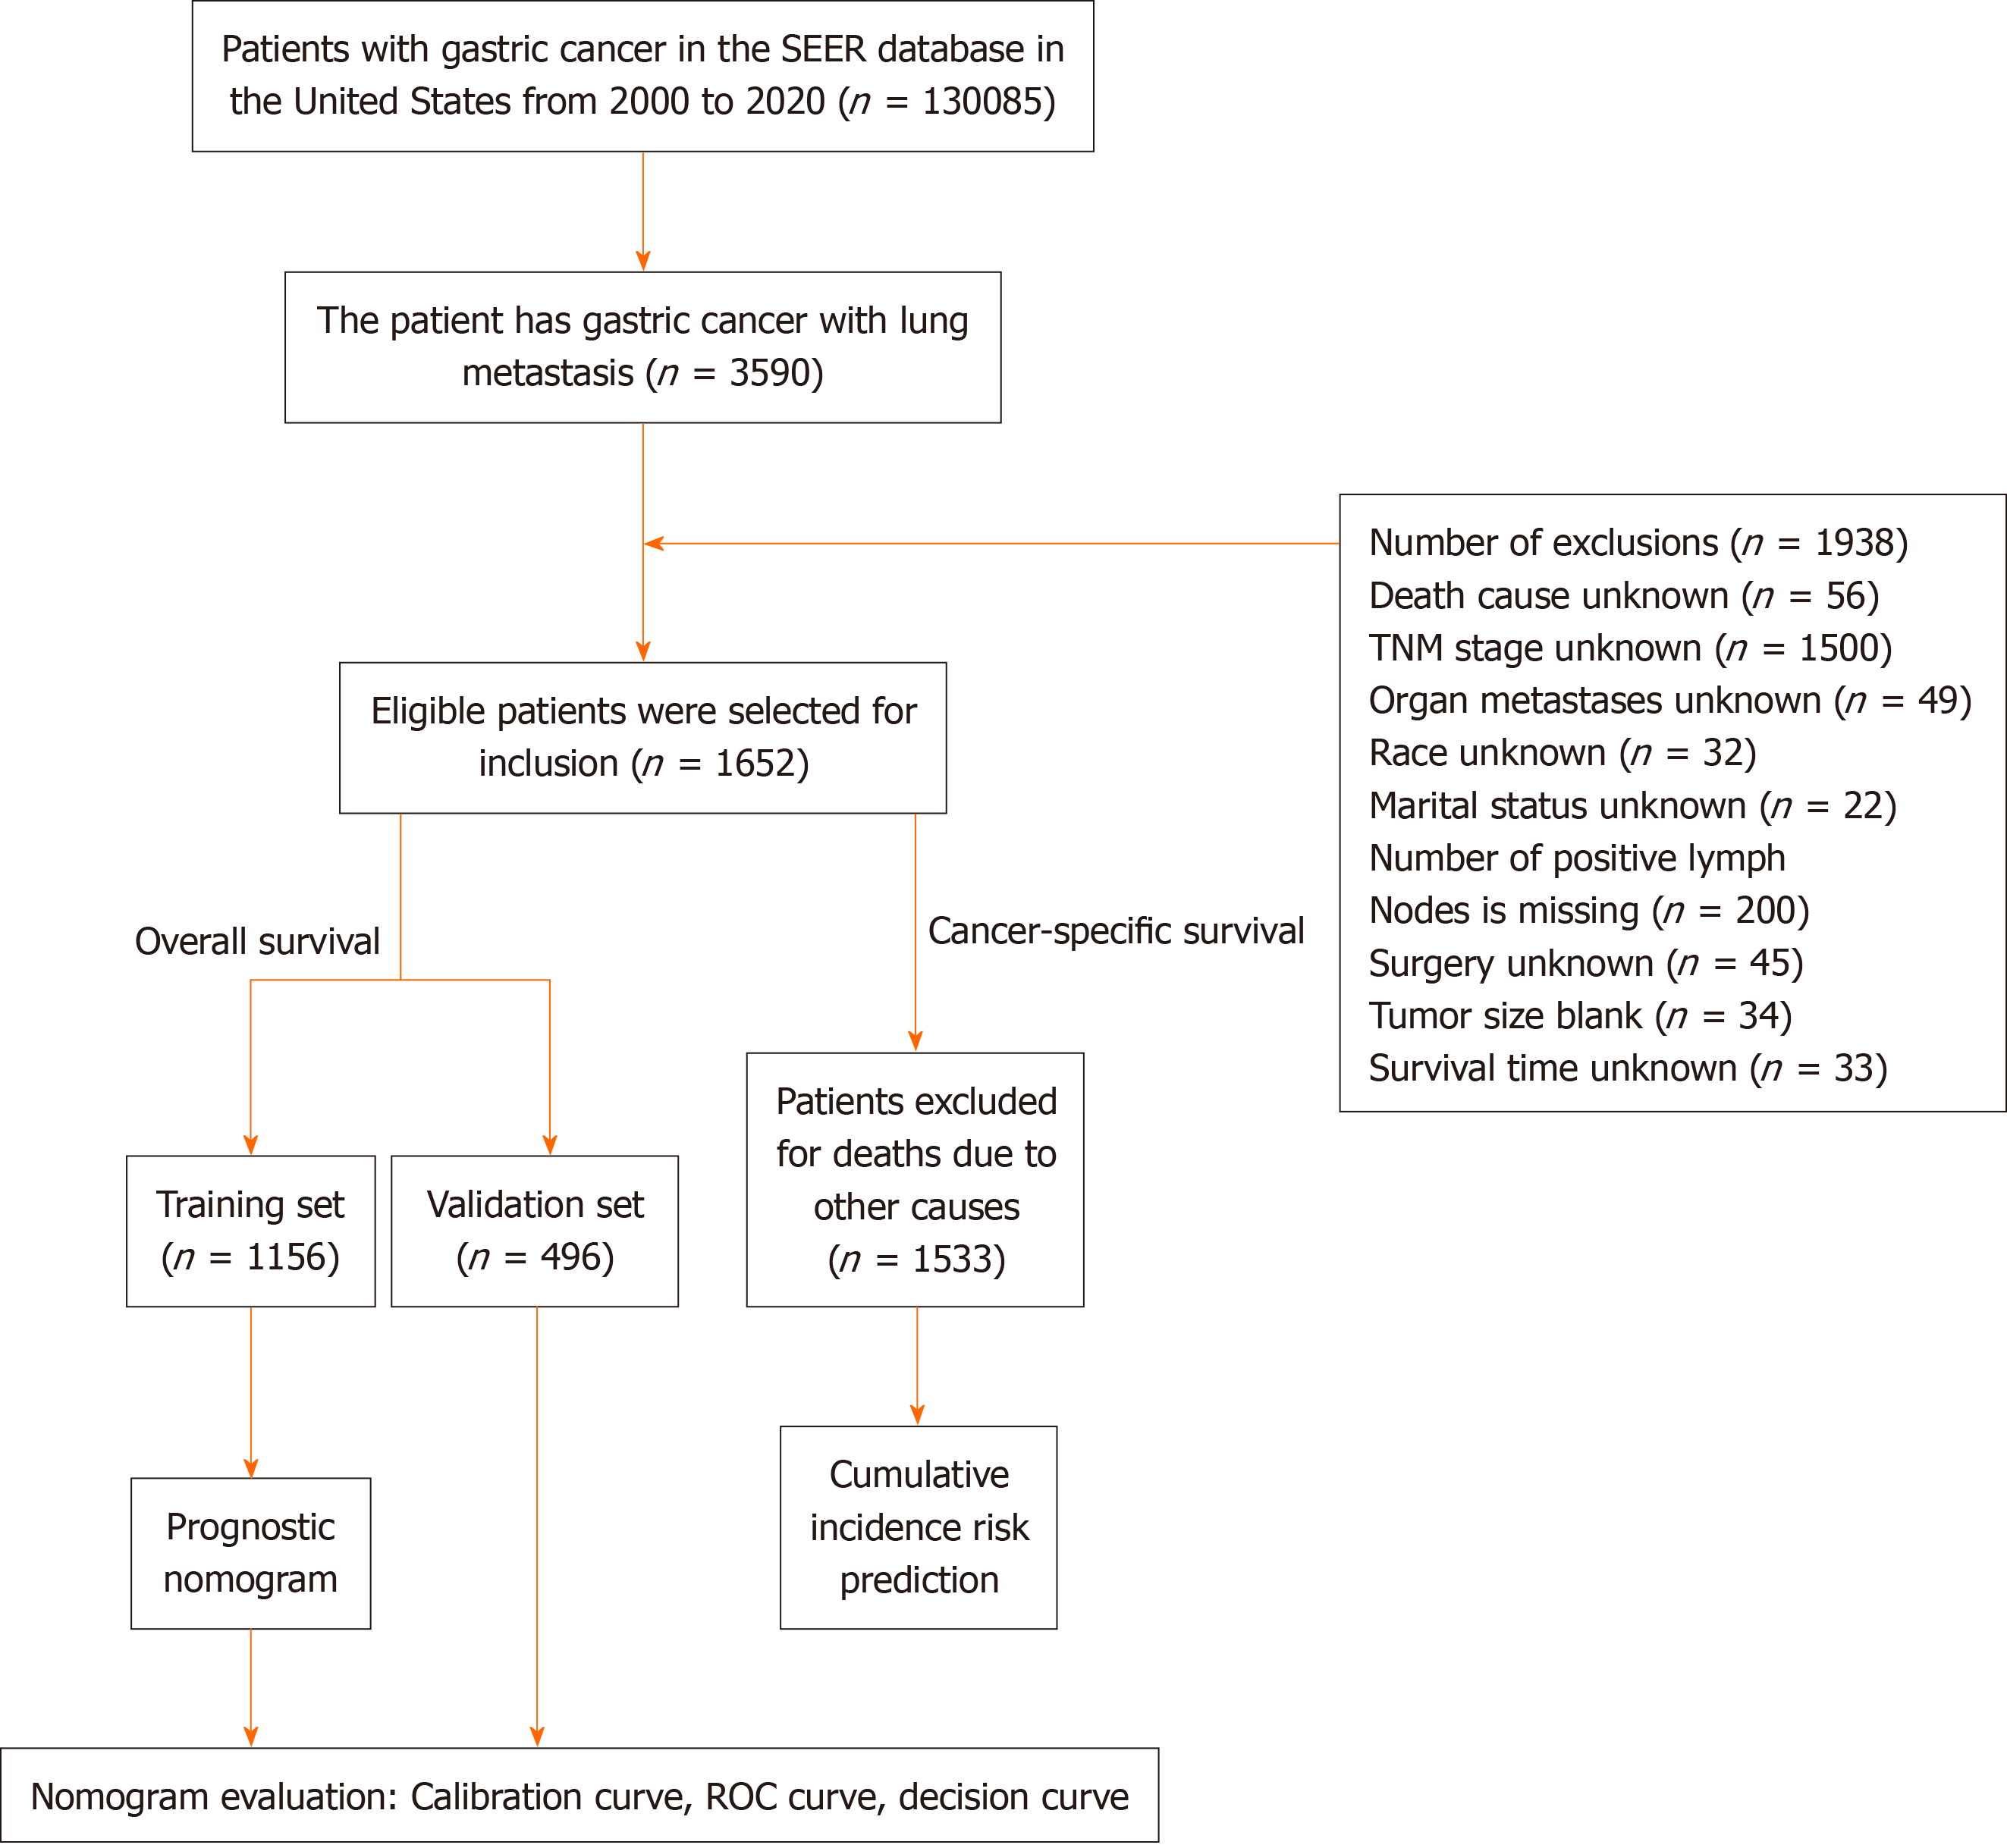
Figure 1 Gastric cancer with lung metastasis patient screening process flowchart.
GCLM: Gastric cancer with lung metastasis; ROC: Receiver operating characteristic.
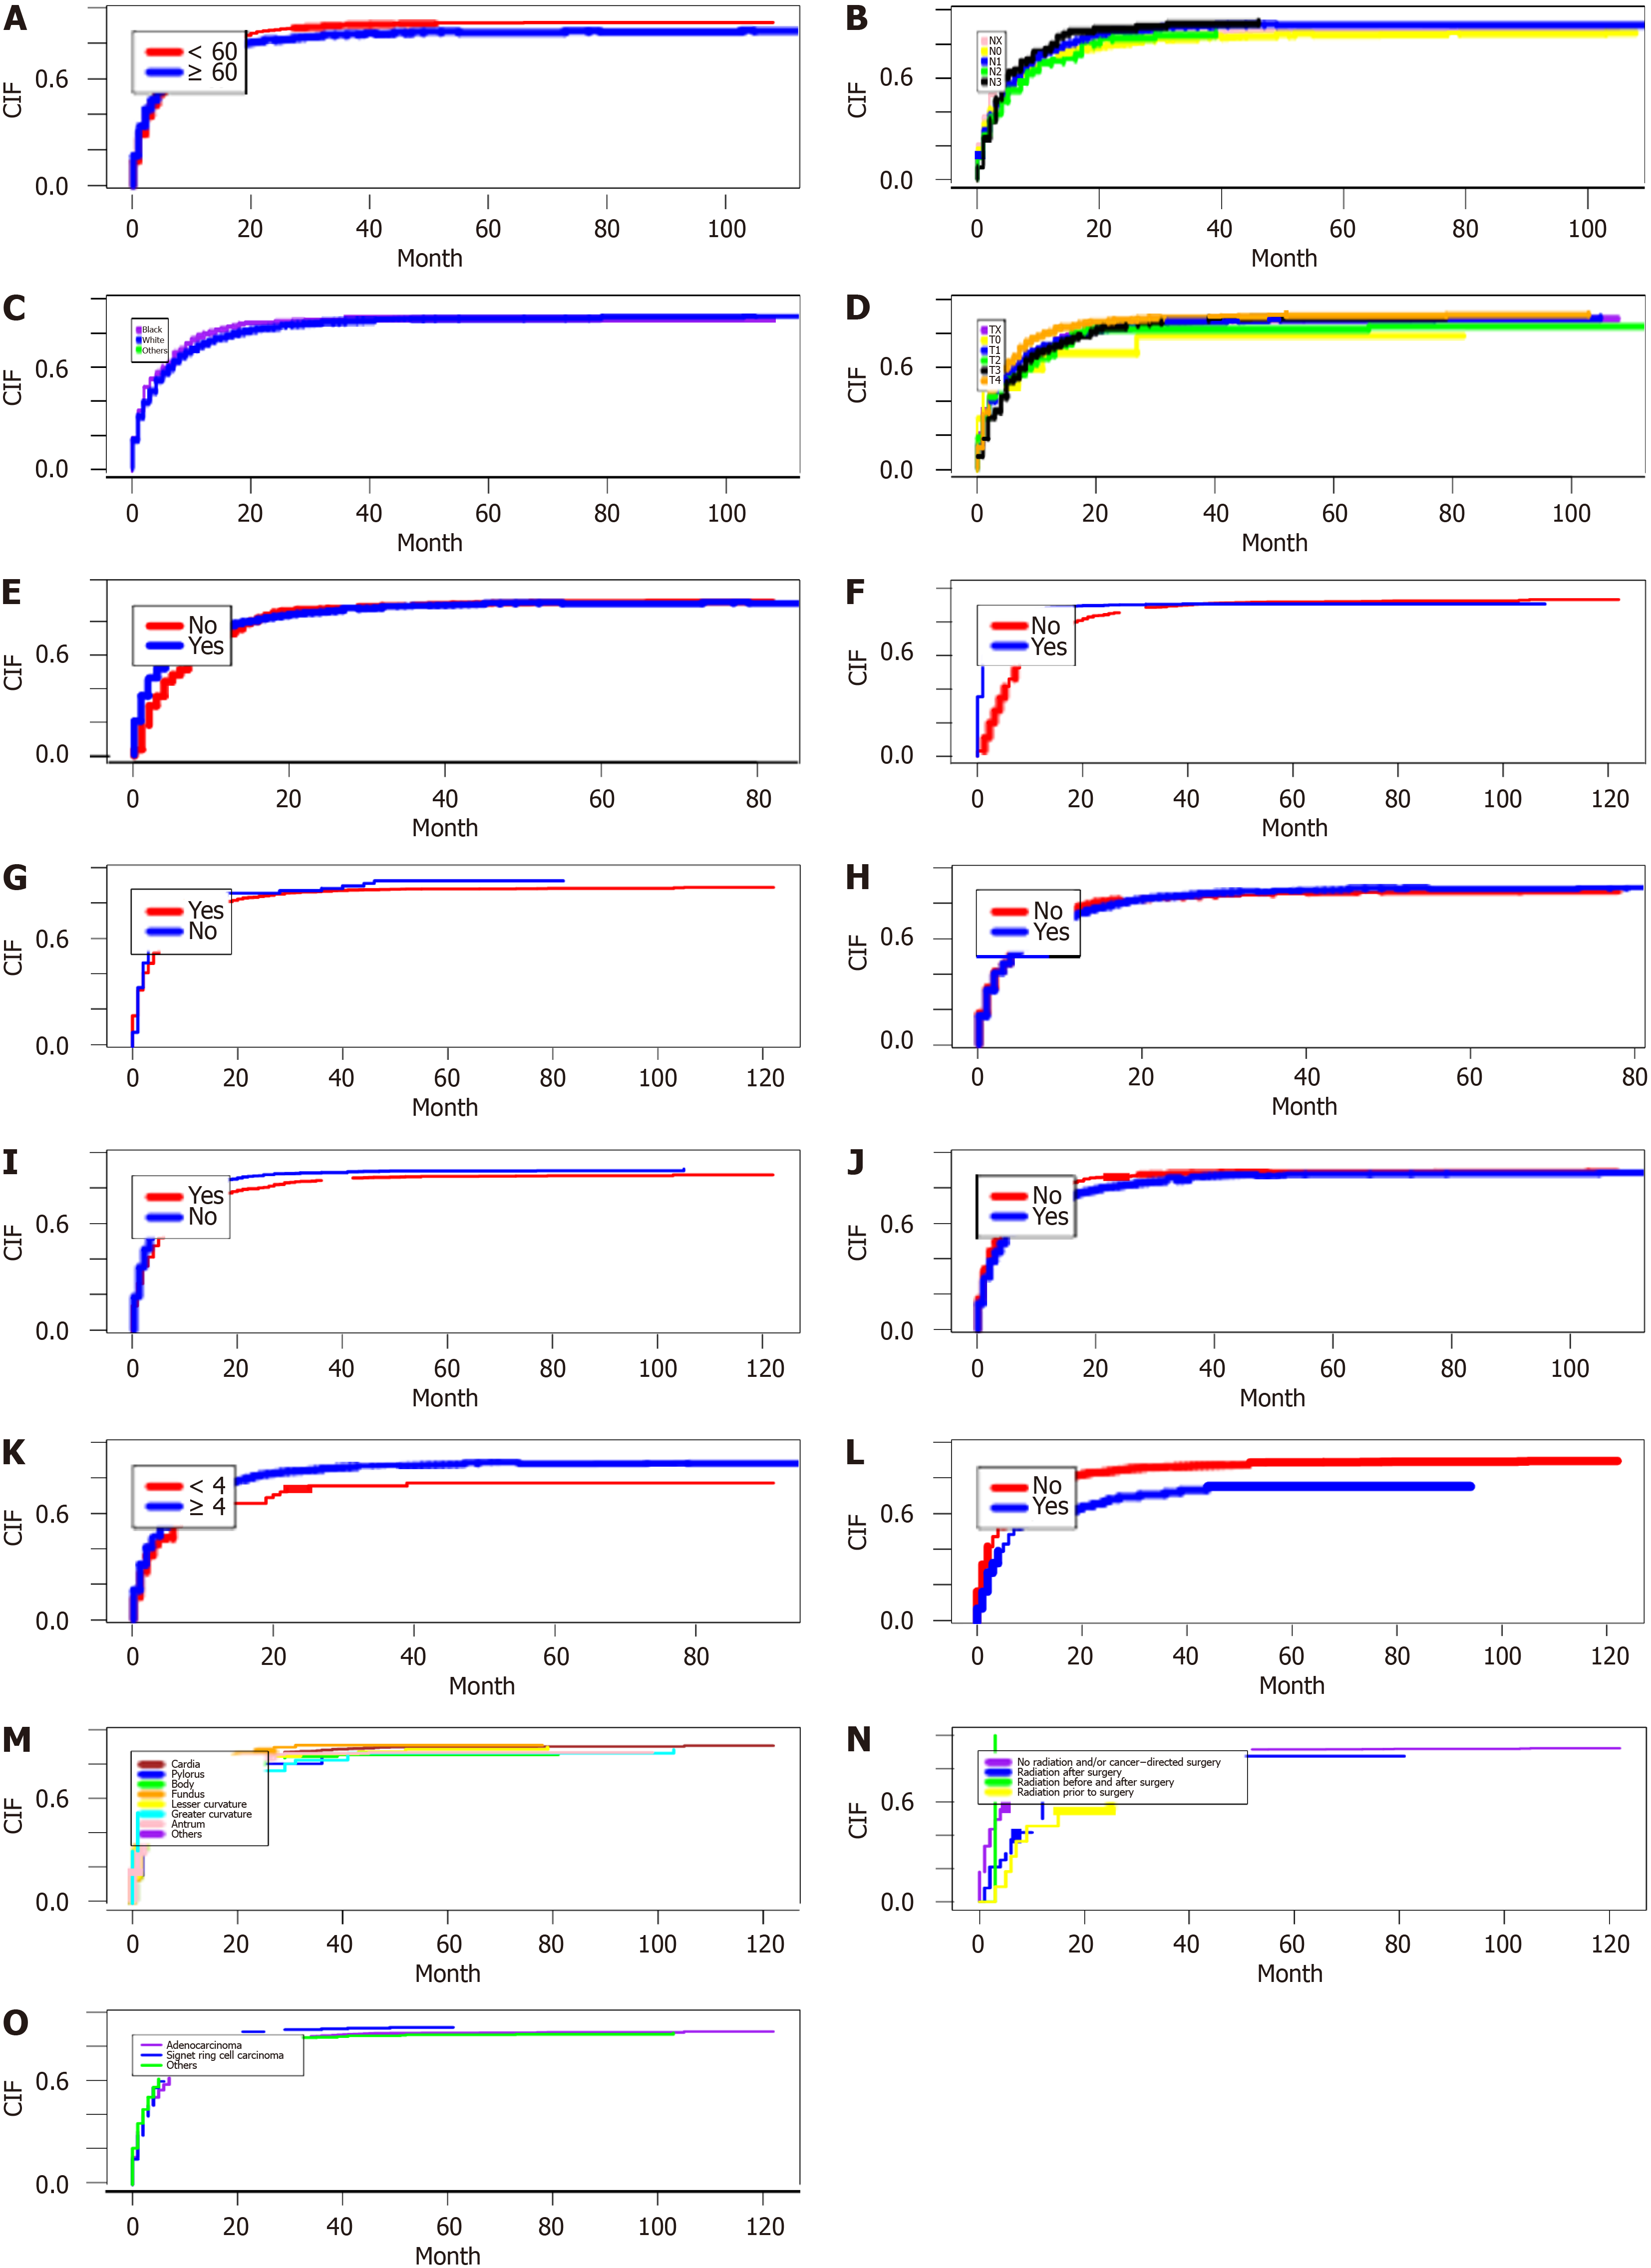
Figure 2 Cumulative Incidence Prediction plot of cancer special survival in gastric cancer with lung metastasis.
A: Age; B: N stage; C: Race; D: T stage; E: Radiotherapy; F: Chemotherapy; G: Liver Metastasis; H: Bone Metastasis; I: Brain metastasis; J: Marital status; K: Node positive number; L: Surgery; M: Primary site; N: Treatment sequence; O: Histological type. CSS: Cancer special survival; GCLM: Gastric cancer with lung metastasis; CIF: Cumulative incidence function.
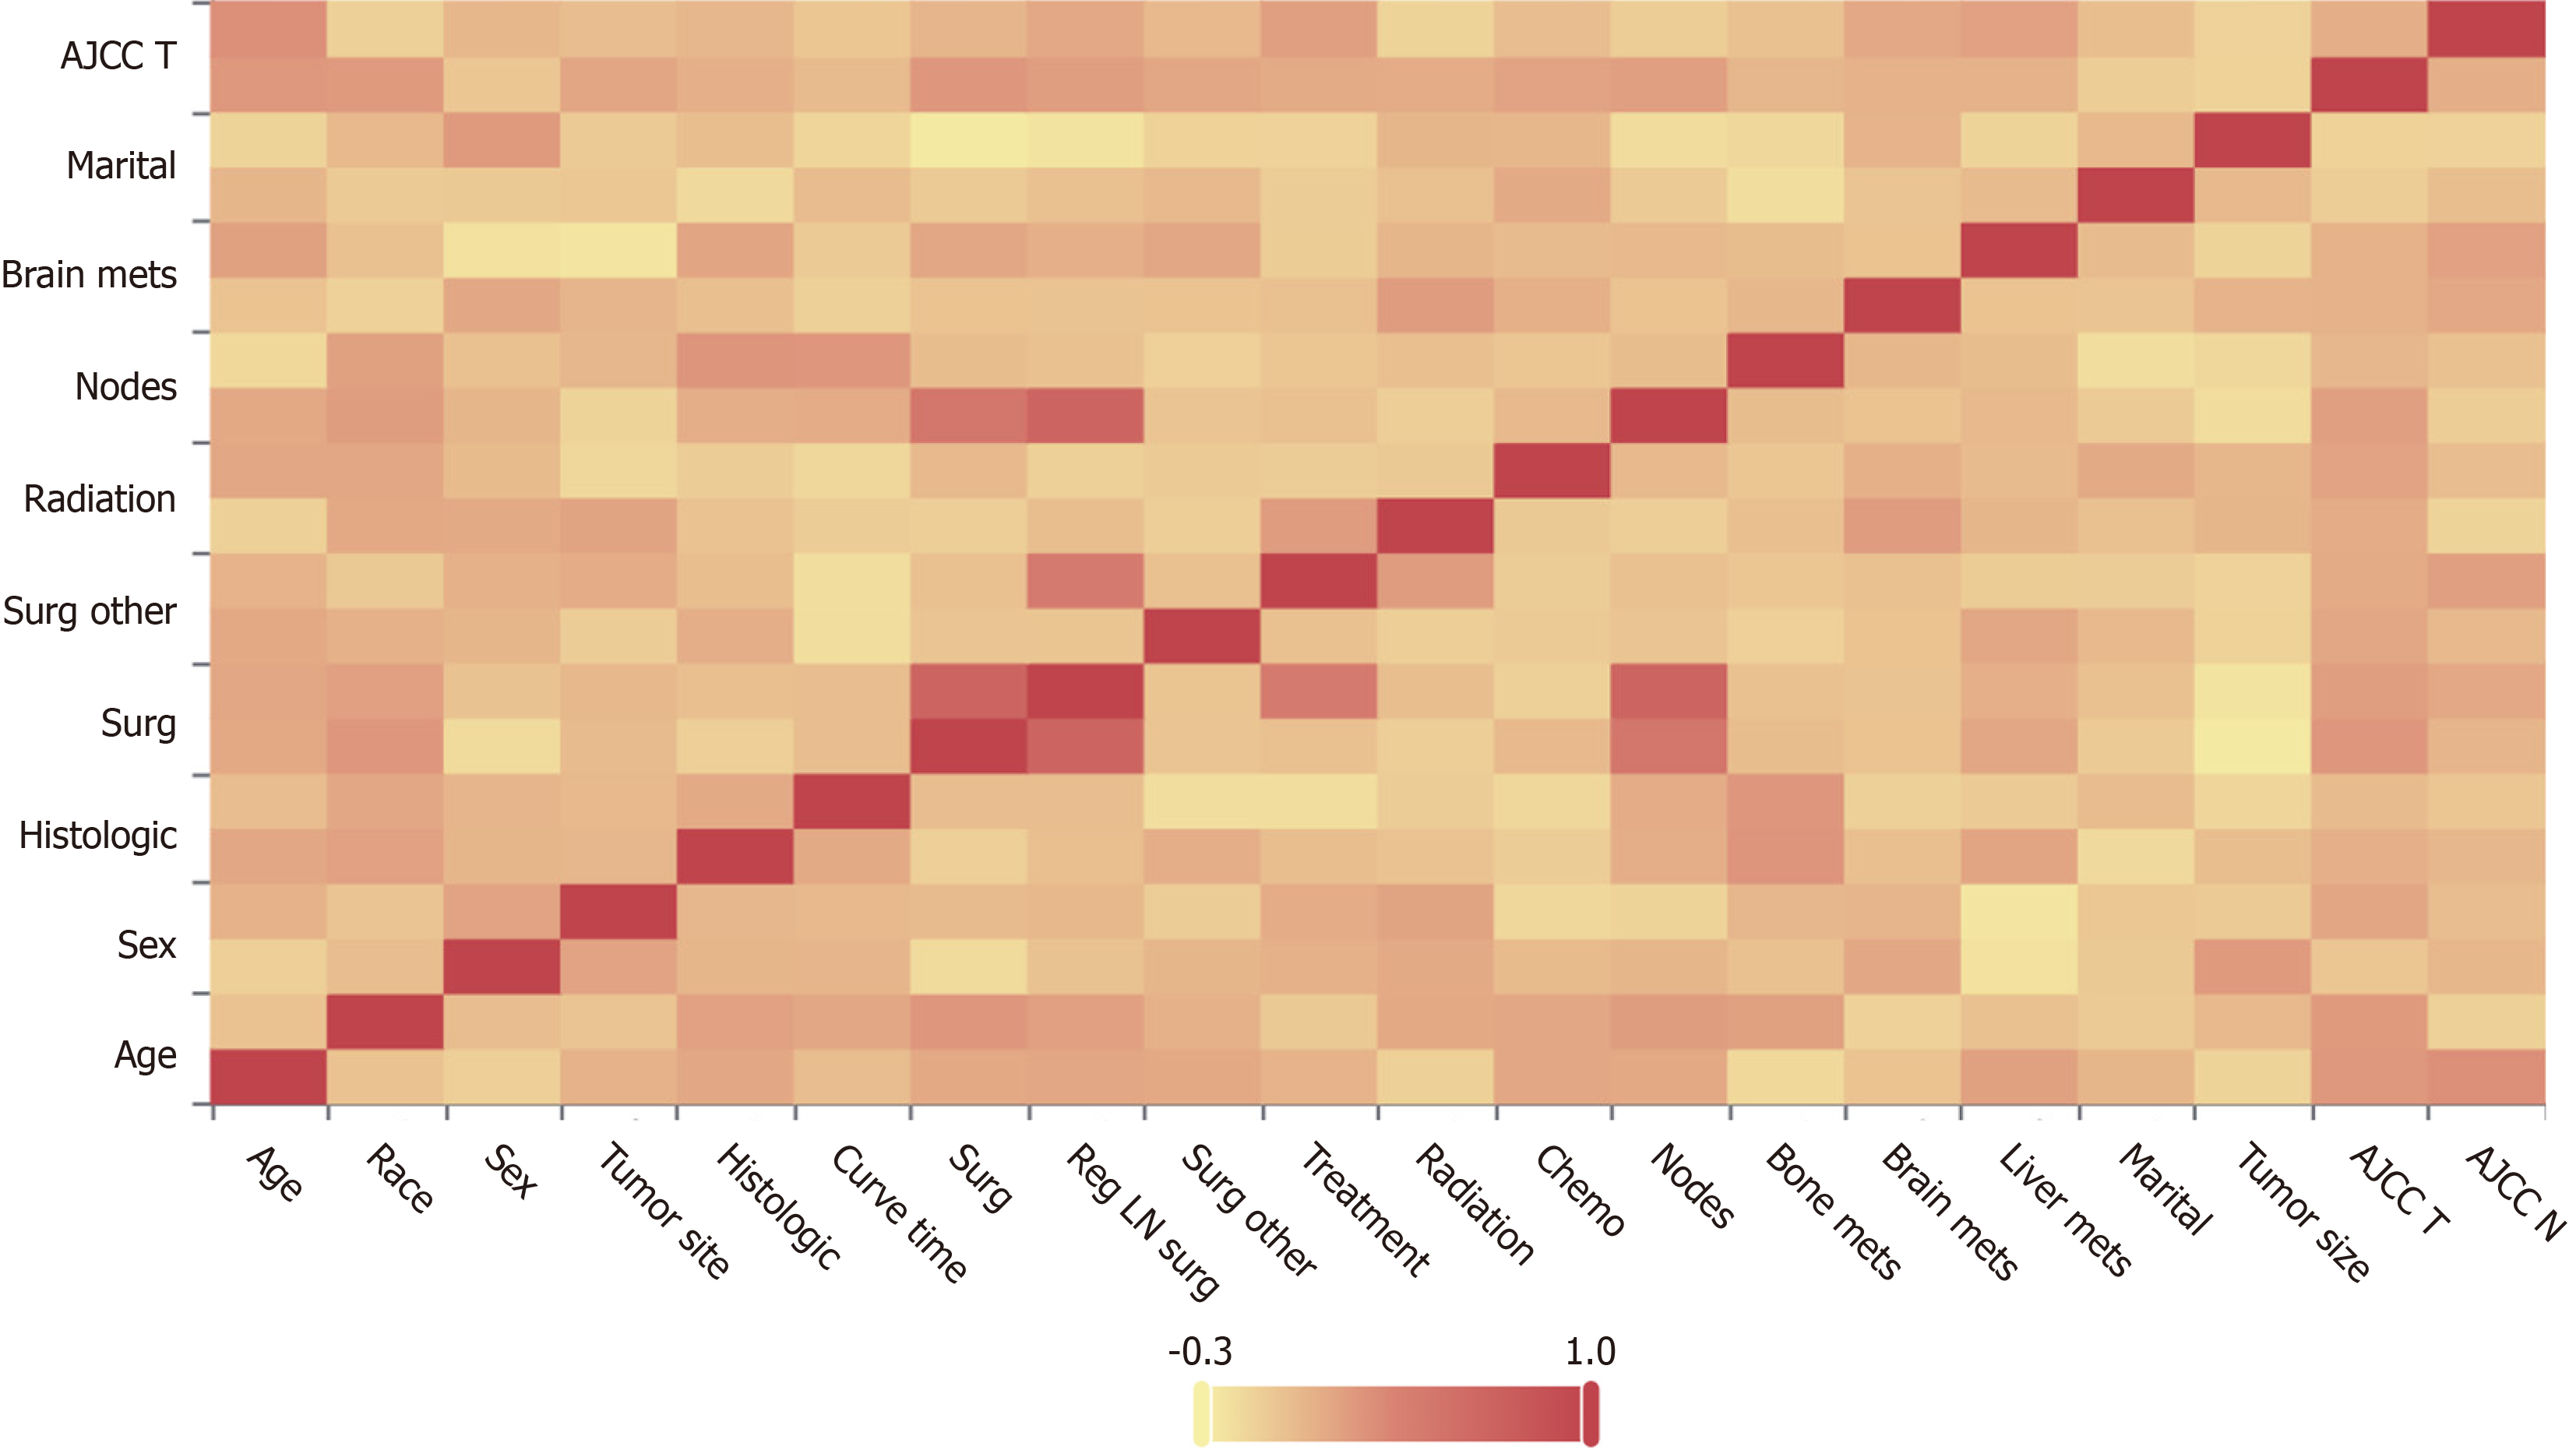
Figure 3 All included variables' Pearson correlation analysis.
AJCC: American Joint Committee on Cancer; Surg: Surgery; T: Tumor; N: Node; LN: Lymph node; Reg: Regional.
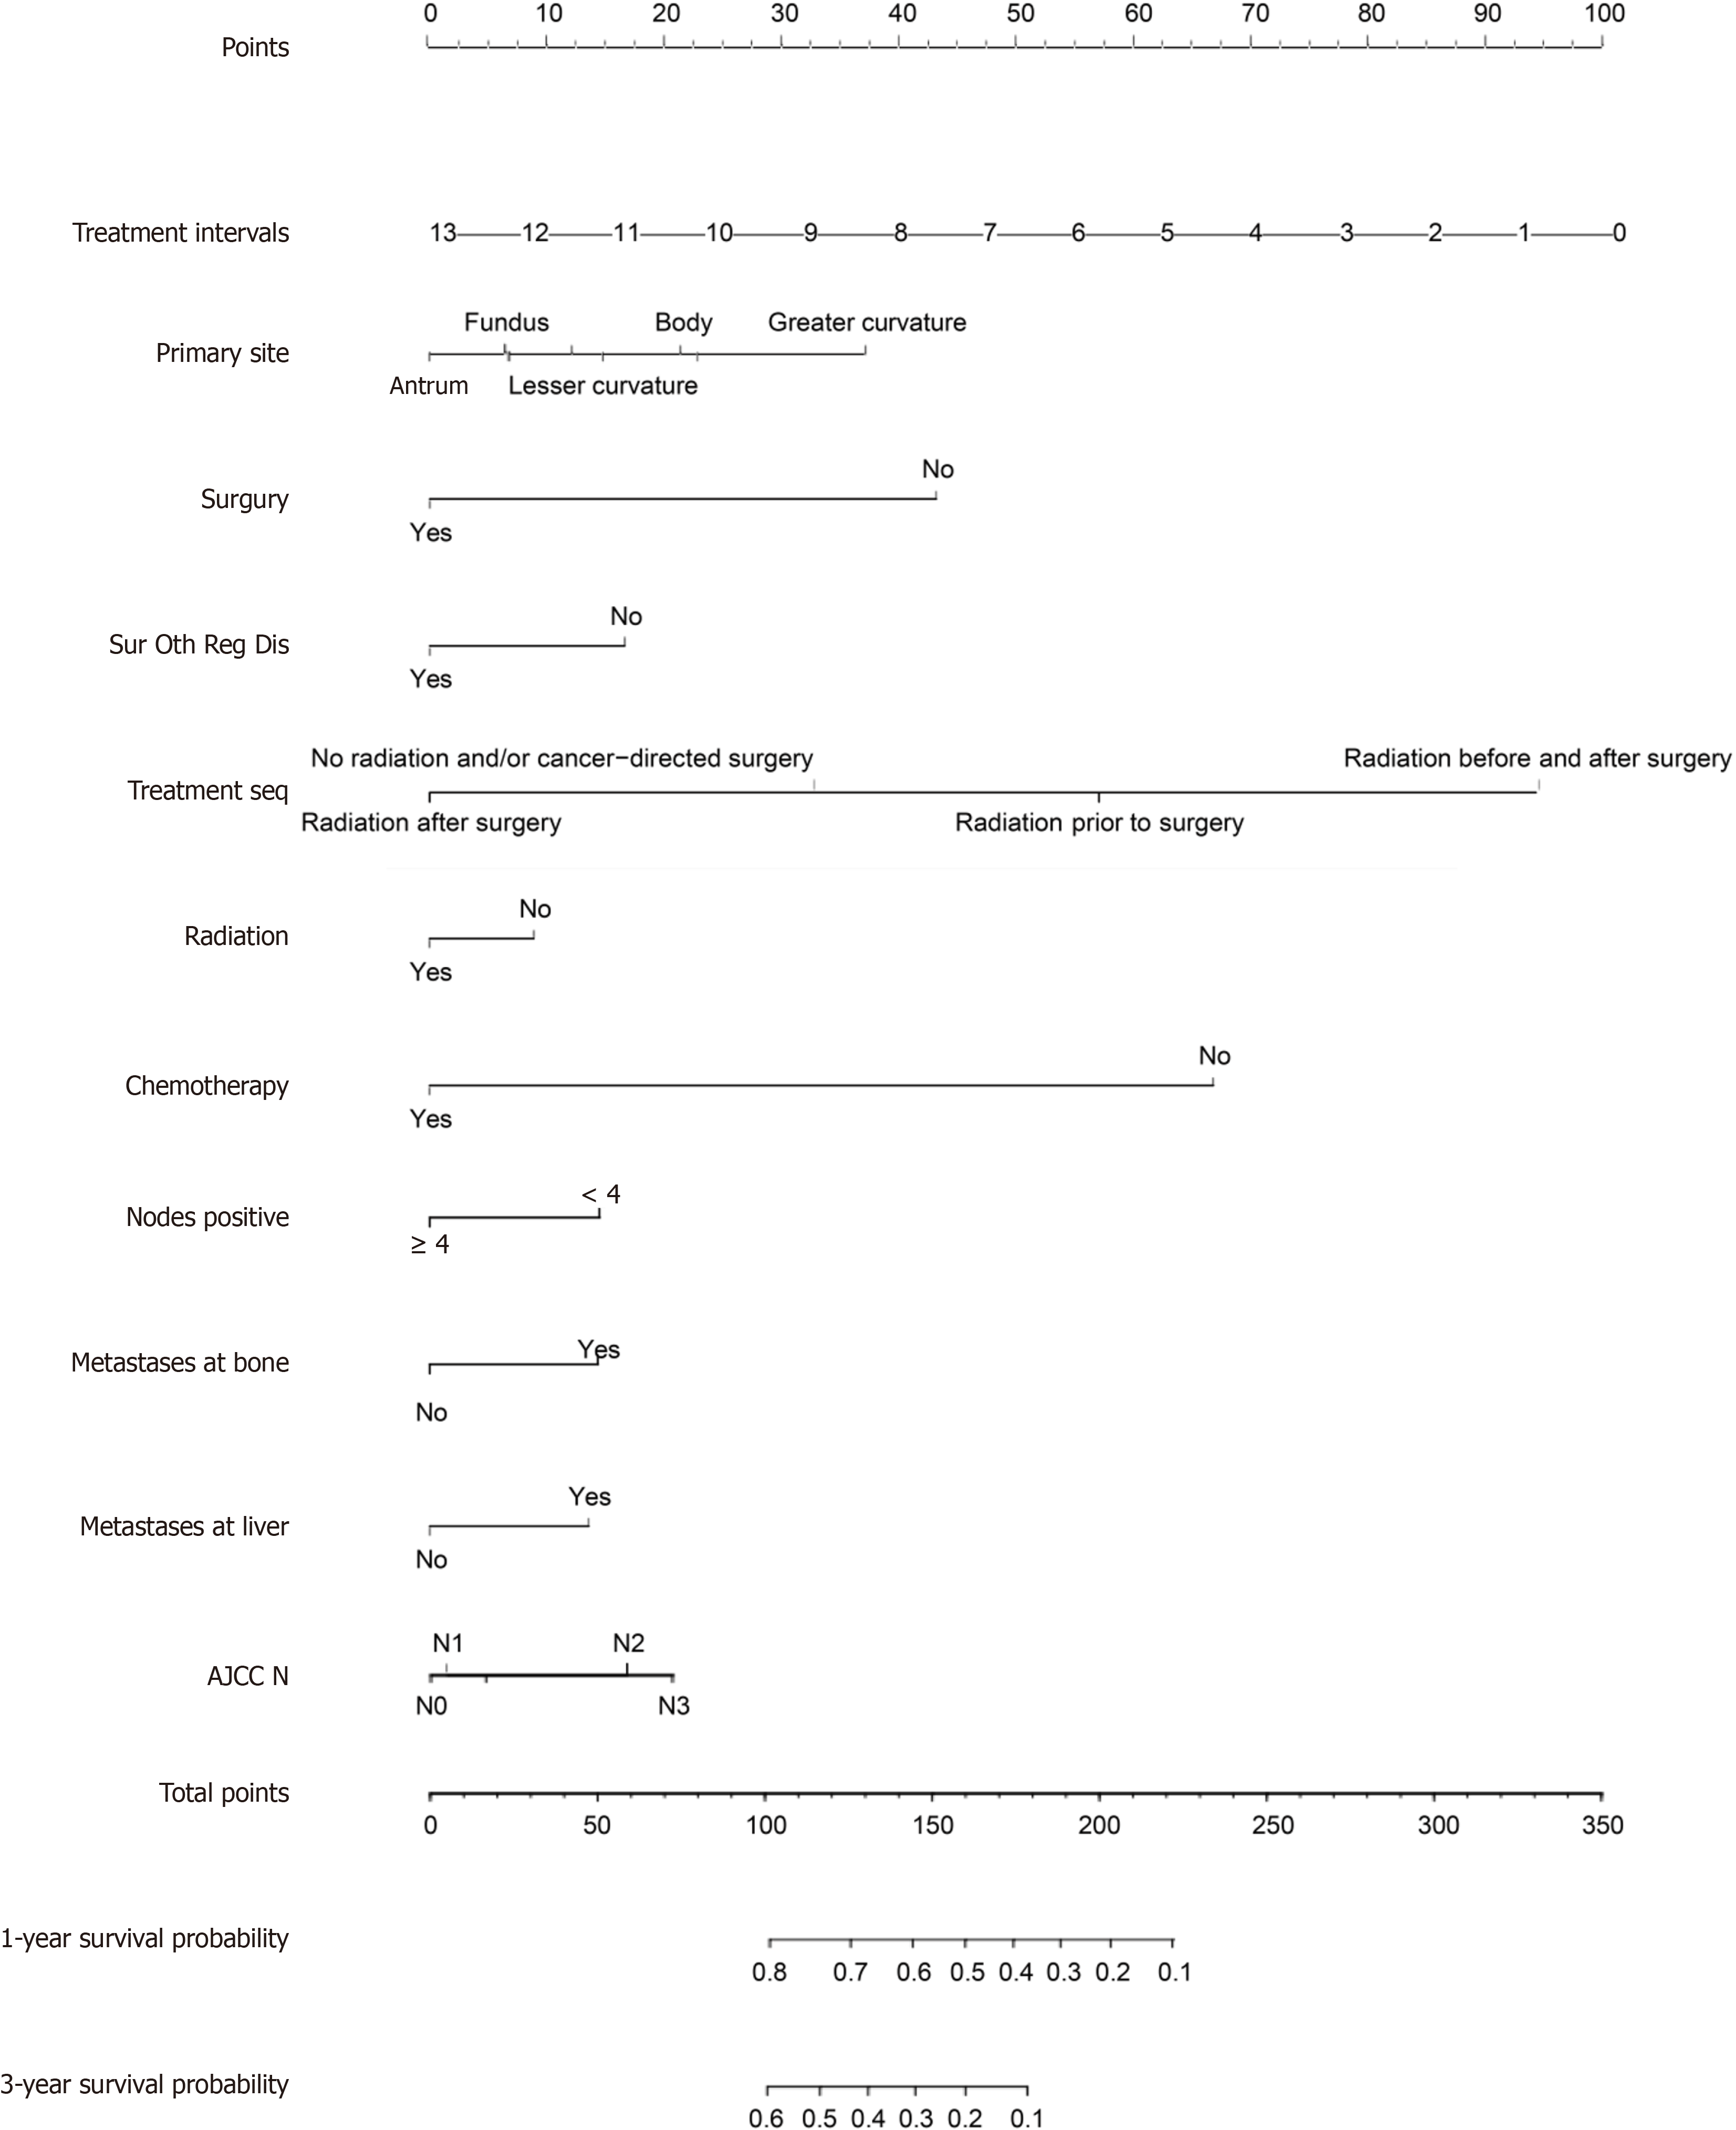
Figure 4 The overall survival Nomgram for gastric cancer with lung metastasis.
AJCC: American Joint Committee on Cancer; Surg: Surgery; T: Tumor; N: Node; LN: Lymph node; Reg: Regional; Surg: Surgery; Oth: Other; Dis: Disease.
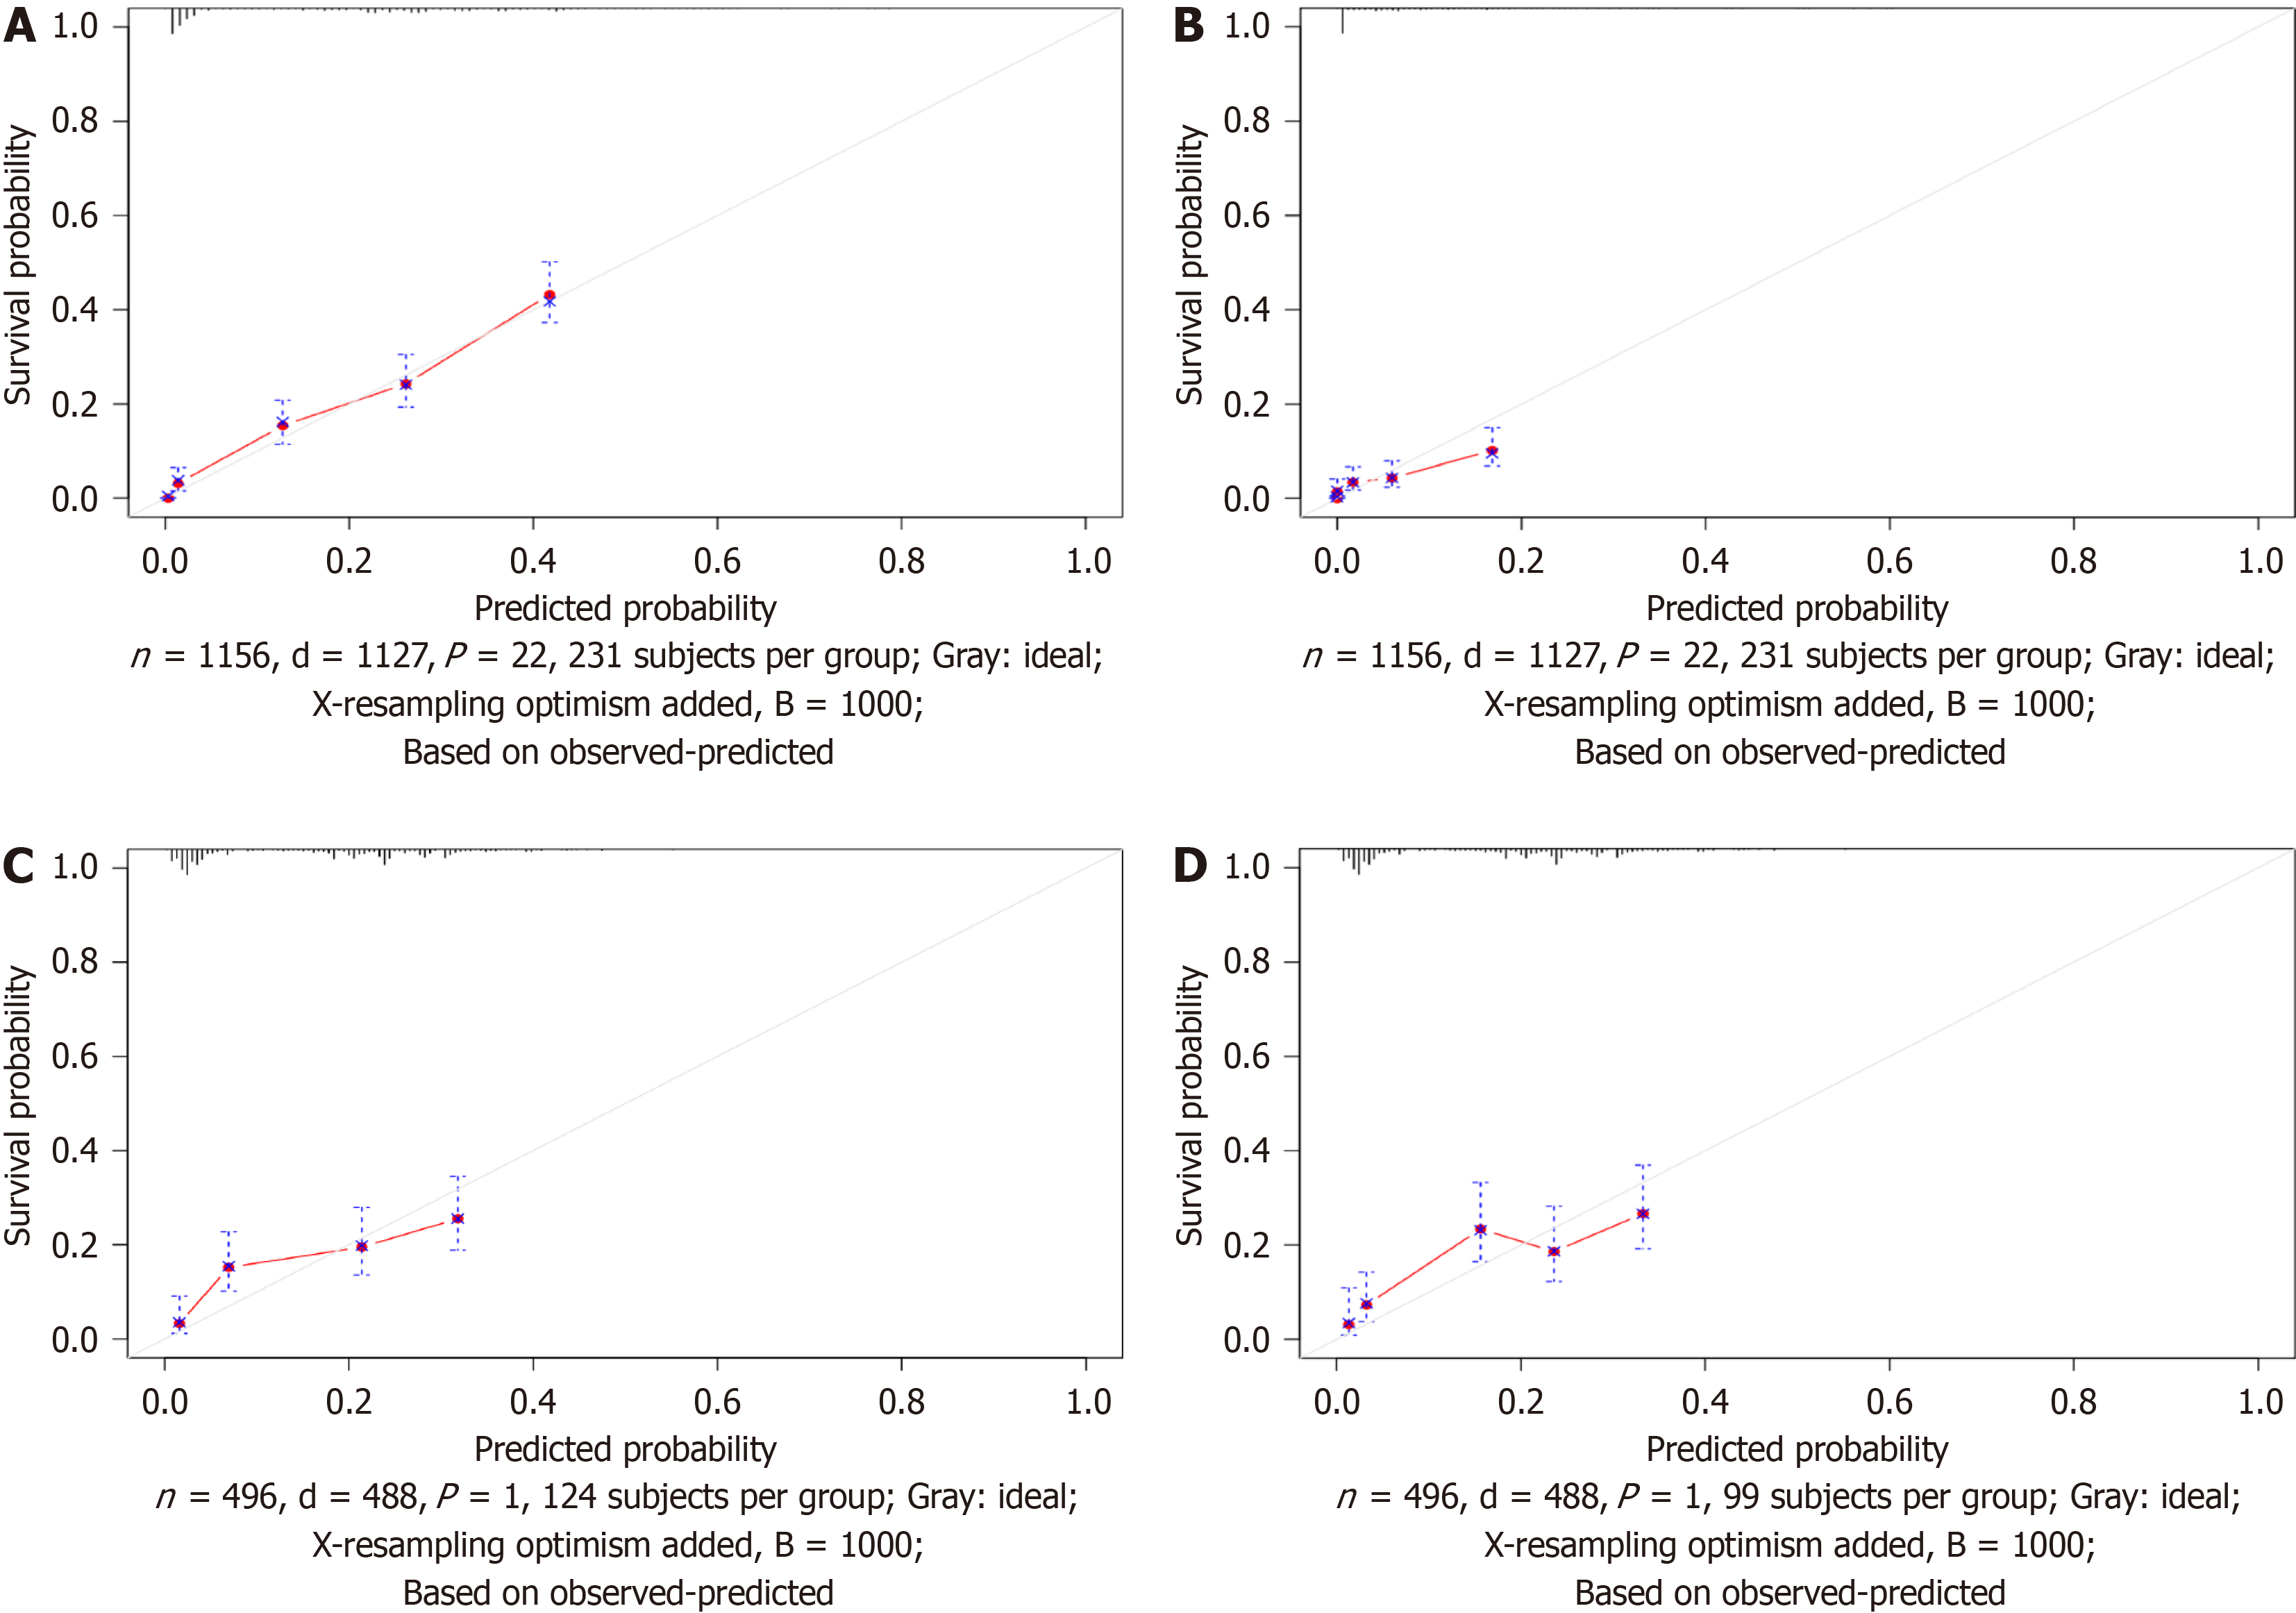
Figure 5 Gastric cancer with lung metastasis calibration curves.
A: 12-month likelihoods of overall survival (OS) in the training dataset; B: 36-month likelihoods of OS in the training dataset; C: 12-month likelihoods of OS in the validation dataset; D: 36-month likelihoods of OS in the validation dataset.
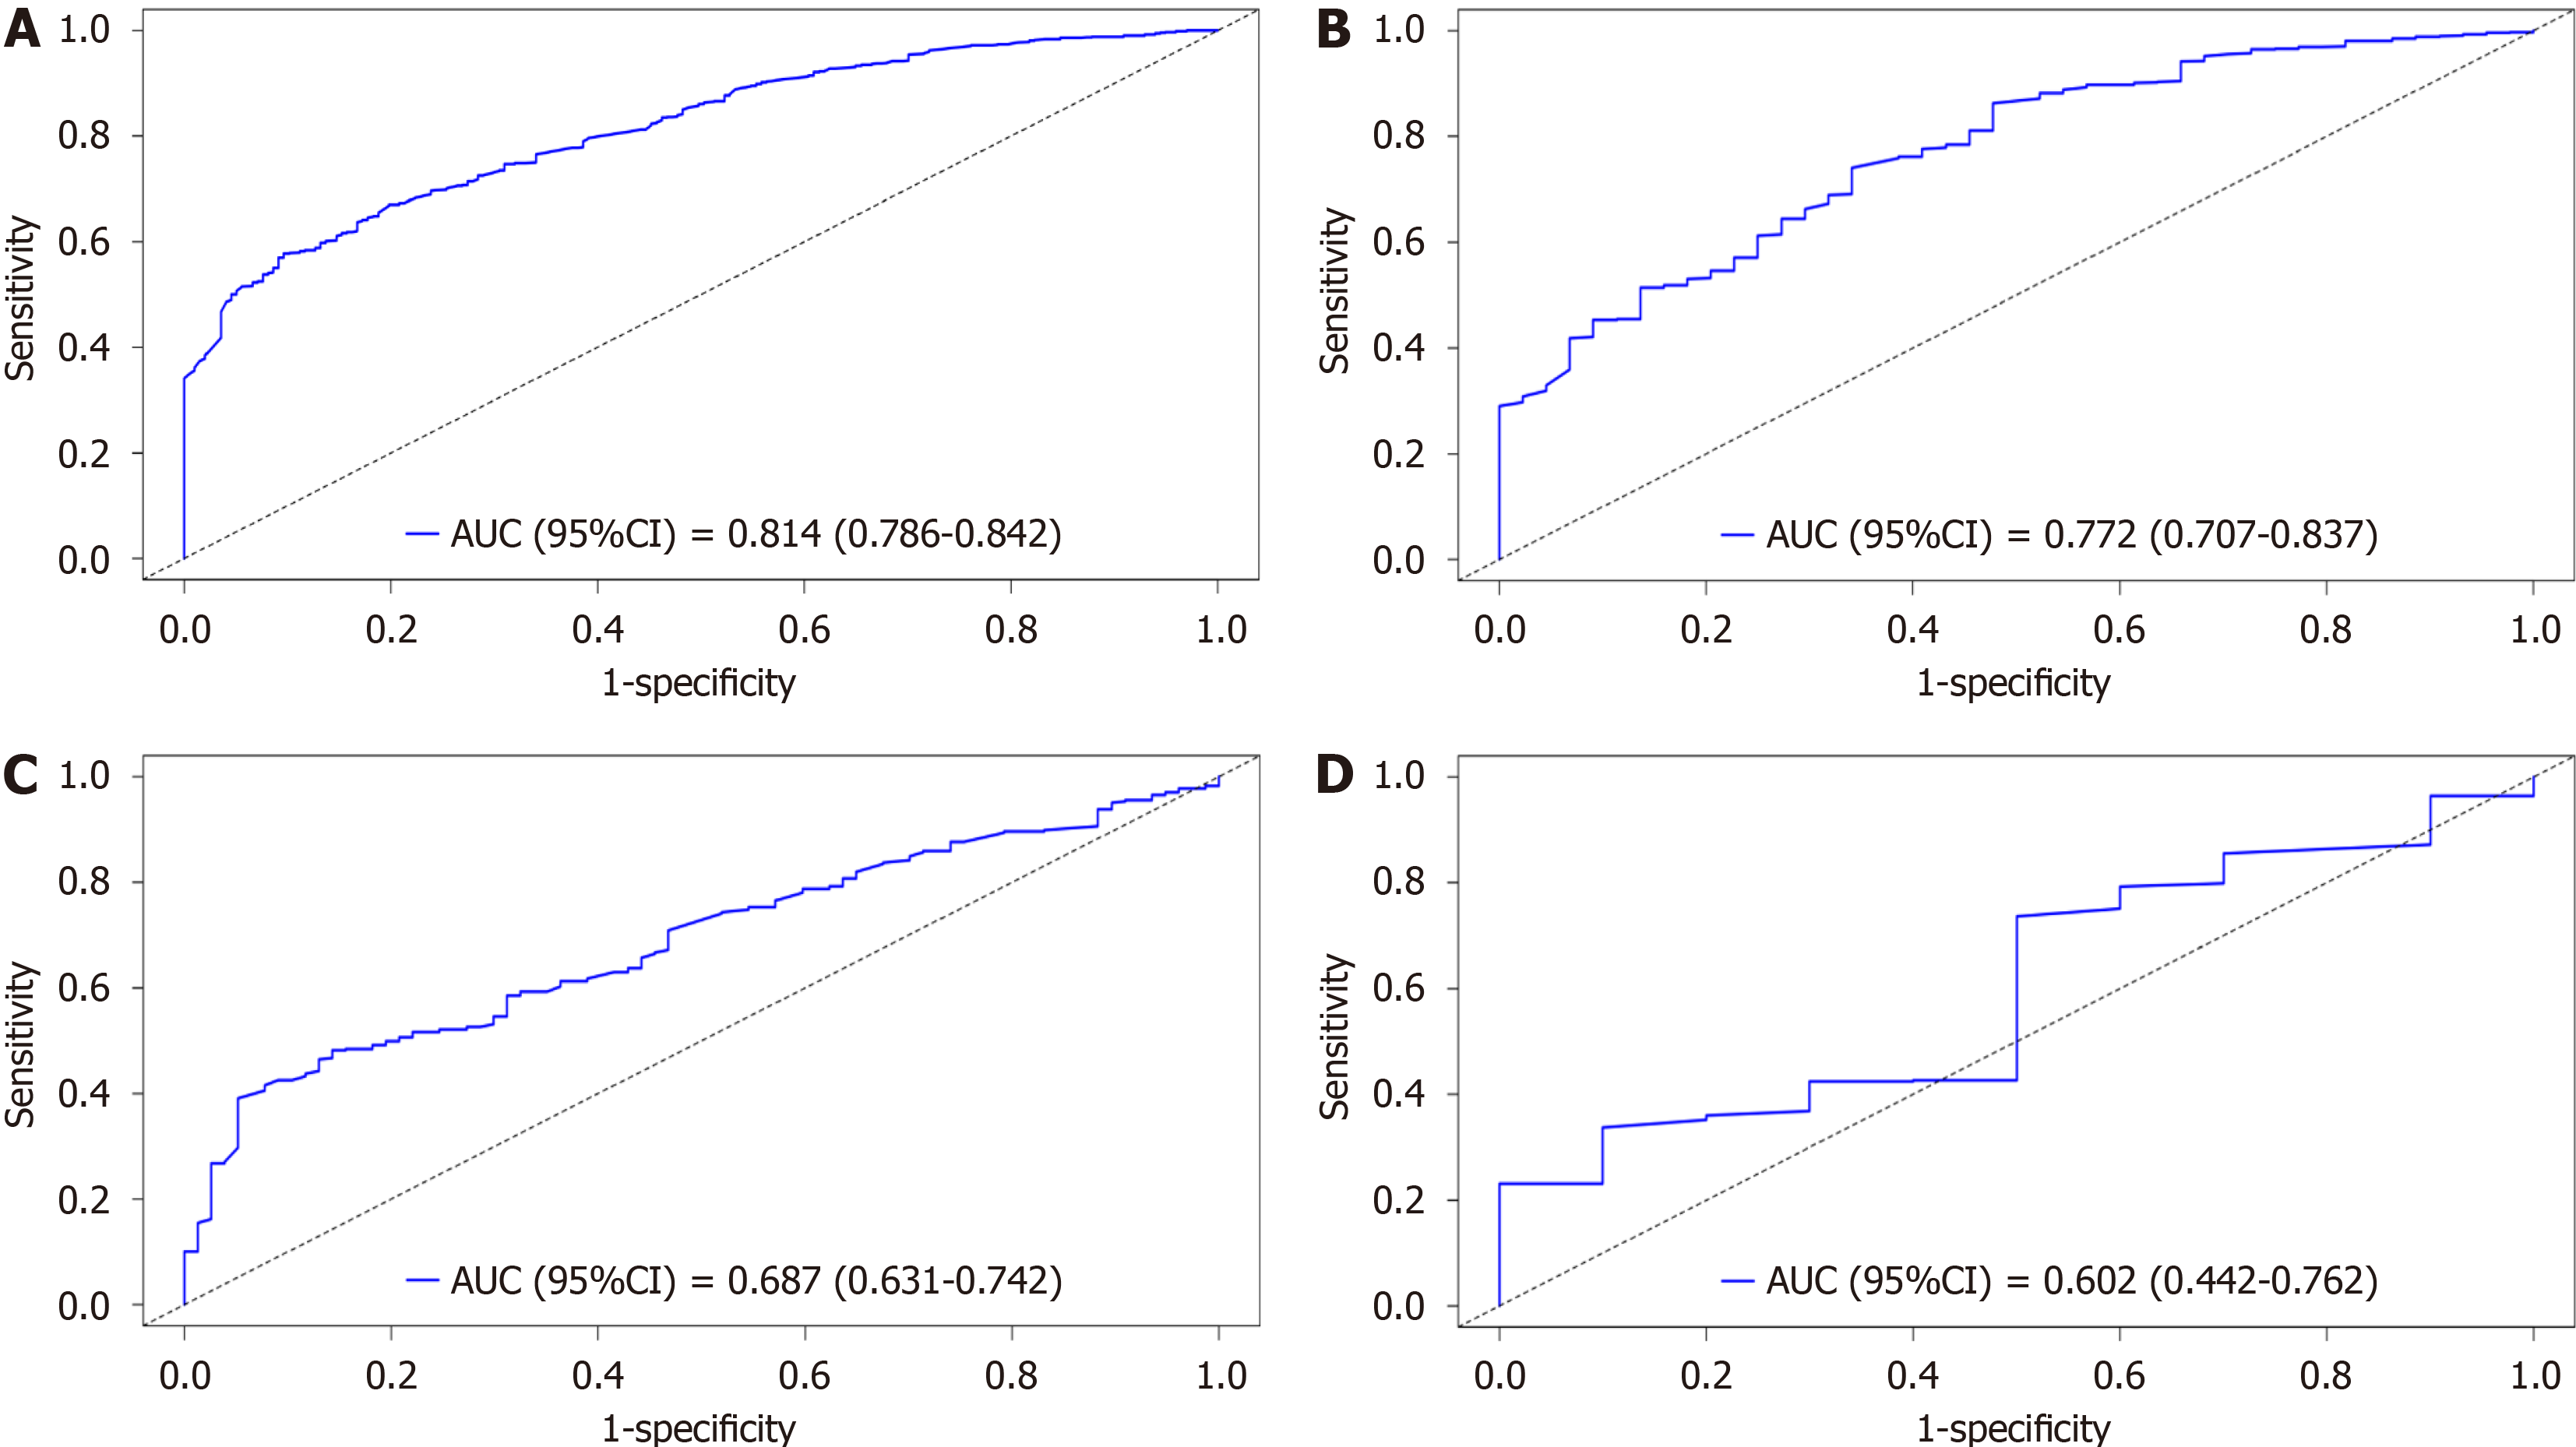
Figure 6 Time-dependent area under the curve and receiver operating characteristic curves of overall survival.
A: Receiver operating characteristic (ROC) curves corresponding to 1-year in the training cohort; B: ROC curves corresponding to 3-year overall survival in the training cohort; C: ROC curves corresponding to 1-year in the validation cohort; D: ROC curves corresponding to 3-year cancer-specific survival in the validation cohort. AUC: Area under the curve.
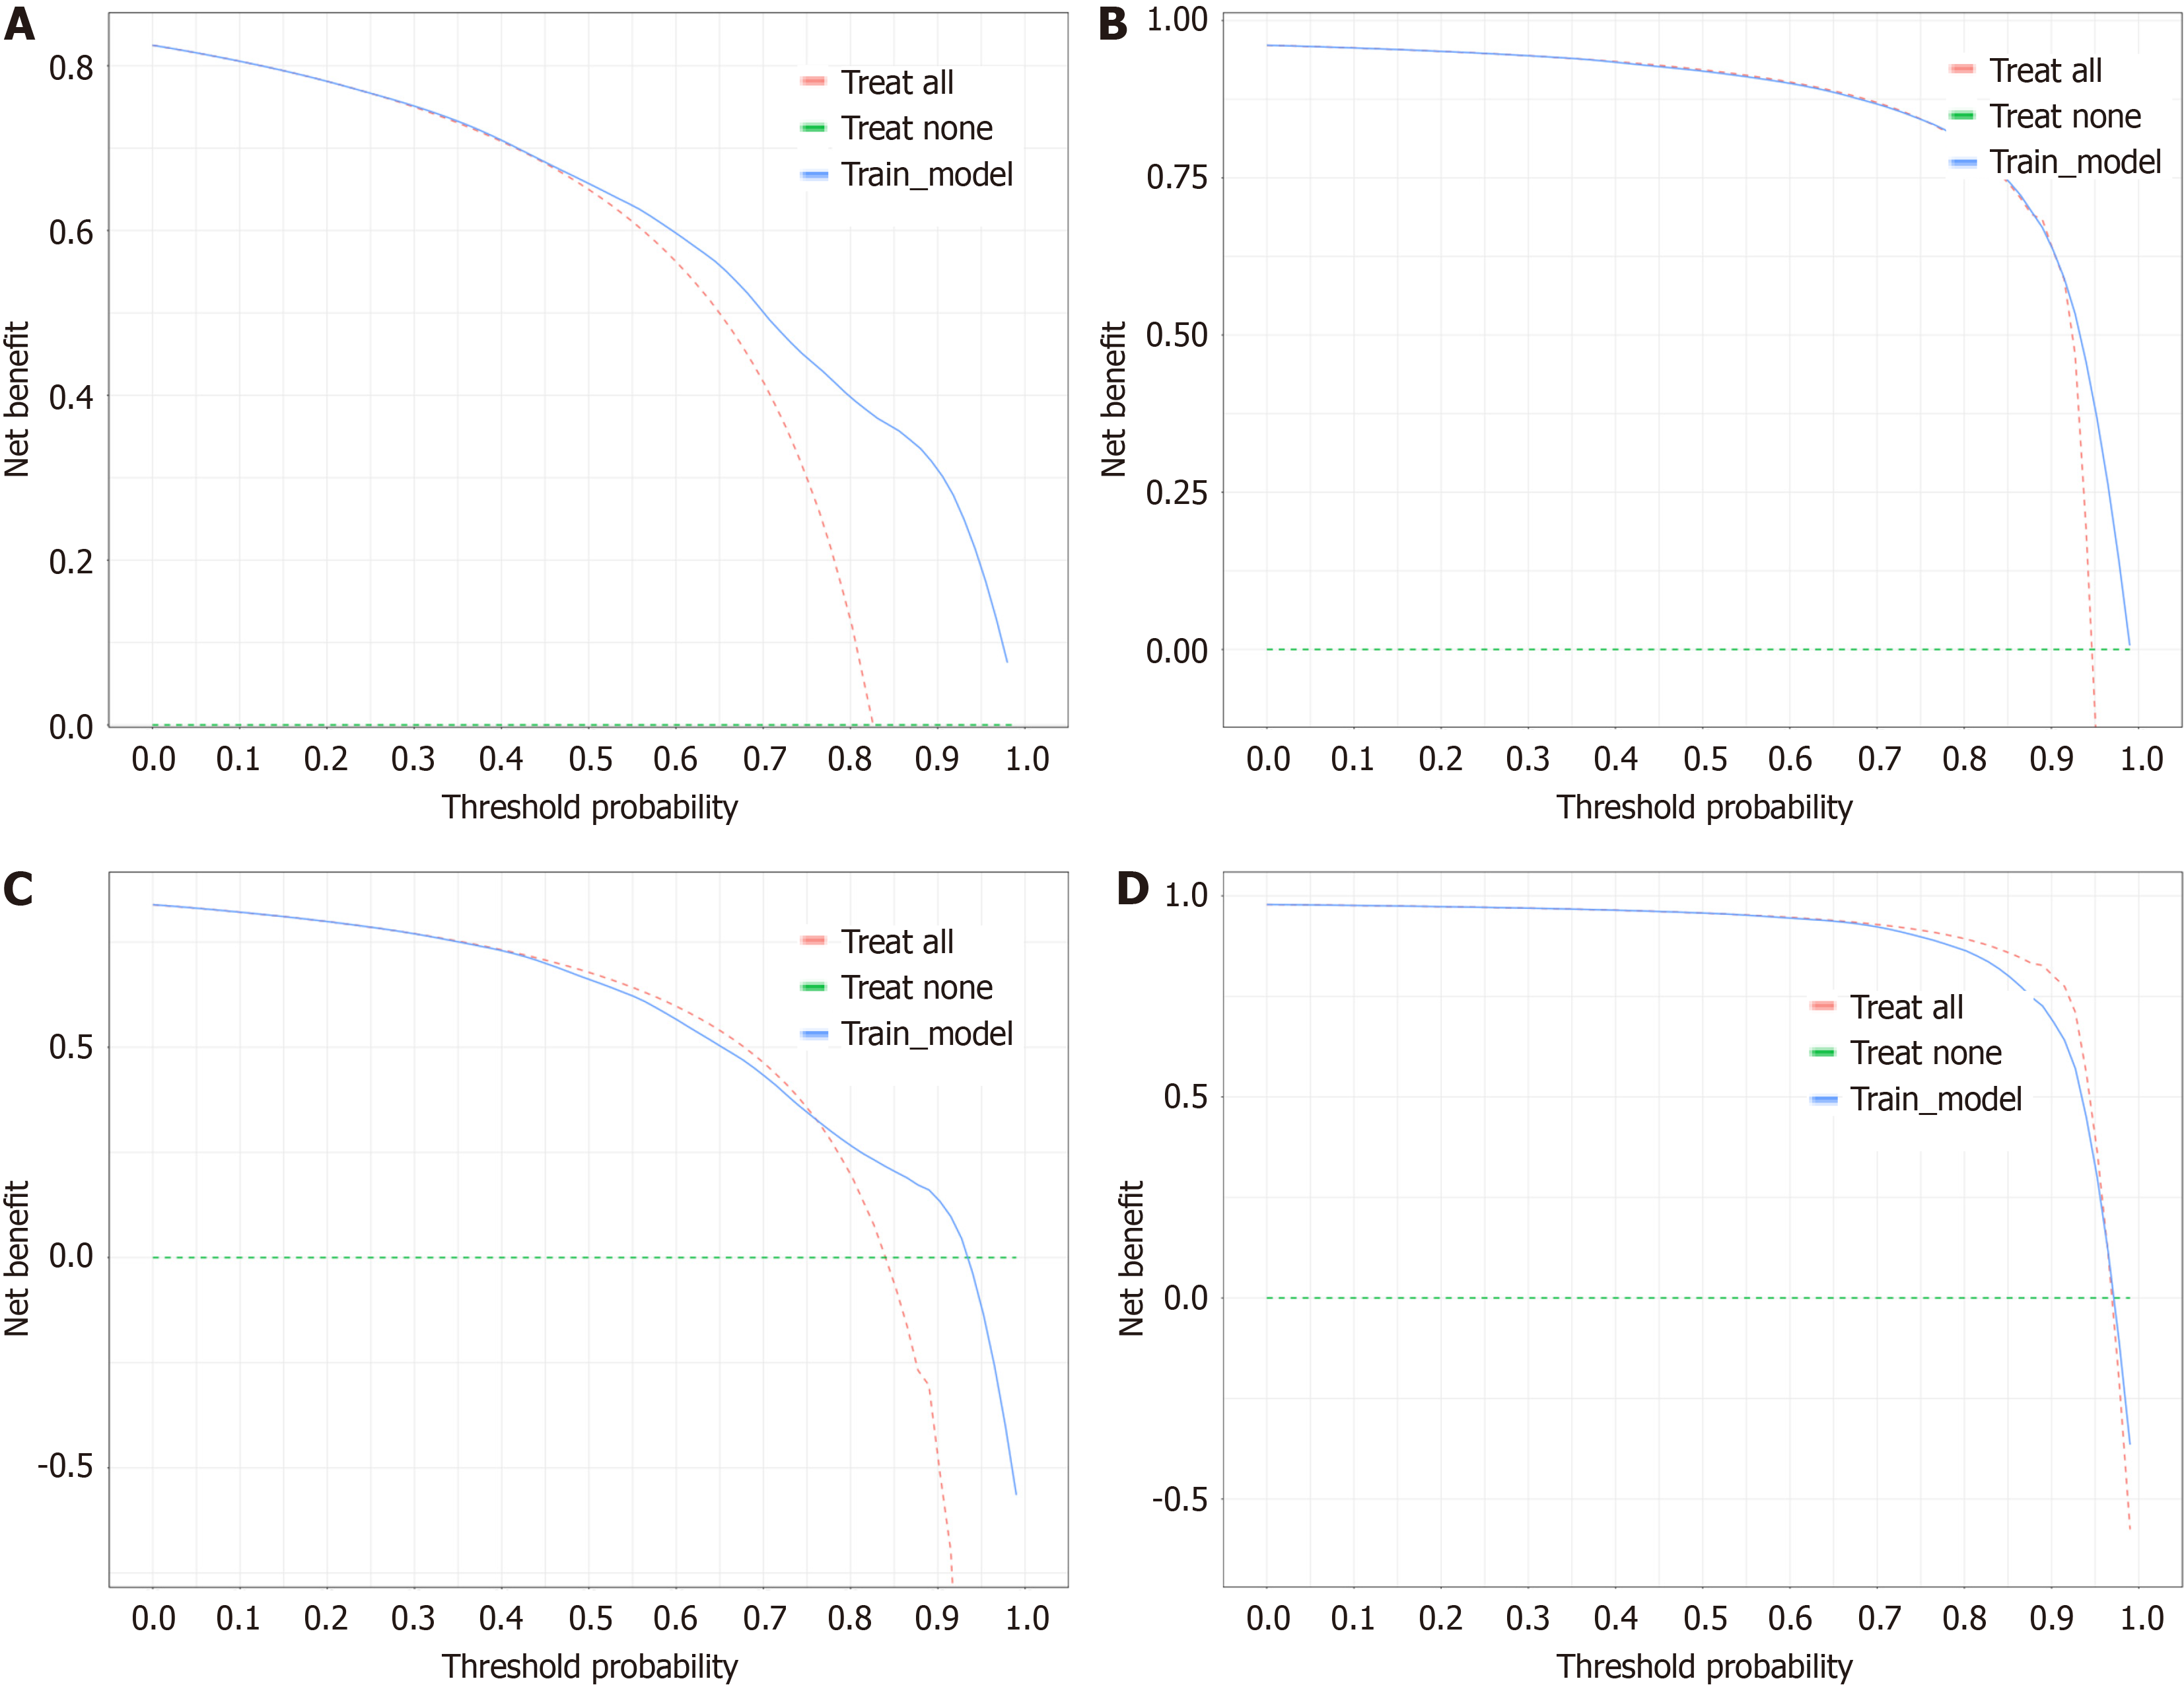
Figure 7 Decision curve analysis of the nomogram in the estimation of overall survival.
A: The Decision curve analysis (DCA) curve for the 1-year overall survival of the training dataset; B: The DCA curve for the 1-year overall survival of the validation dataset; C: The DCA curve for the 3-year overall survival of the training dataset; D: The DCA curve for the 3-year overall survival of the validation dataset.
Figure 8 Survival curves for different features of overall survival.
A: Primary site; B: Surgery; C: Surgery other regional distant; D: Treatment Sequence; E: Radiation; F: Chemotherapy; G: Node stage; H: Metastasis at bone; I: Metastasis at liver. HR: Hazard ratio; Surg: Surgery; Oth: Other; Reg: Regional; Dis: Disease.
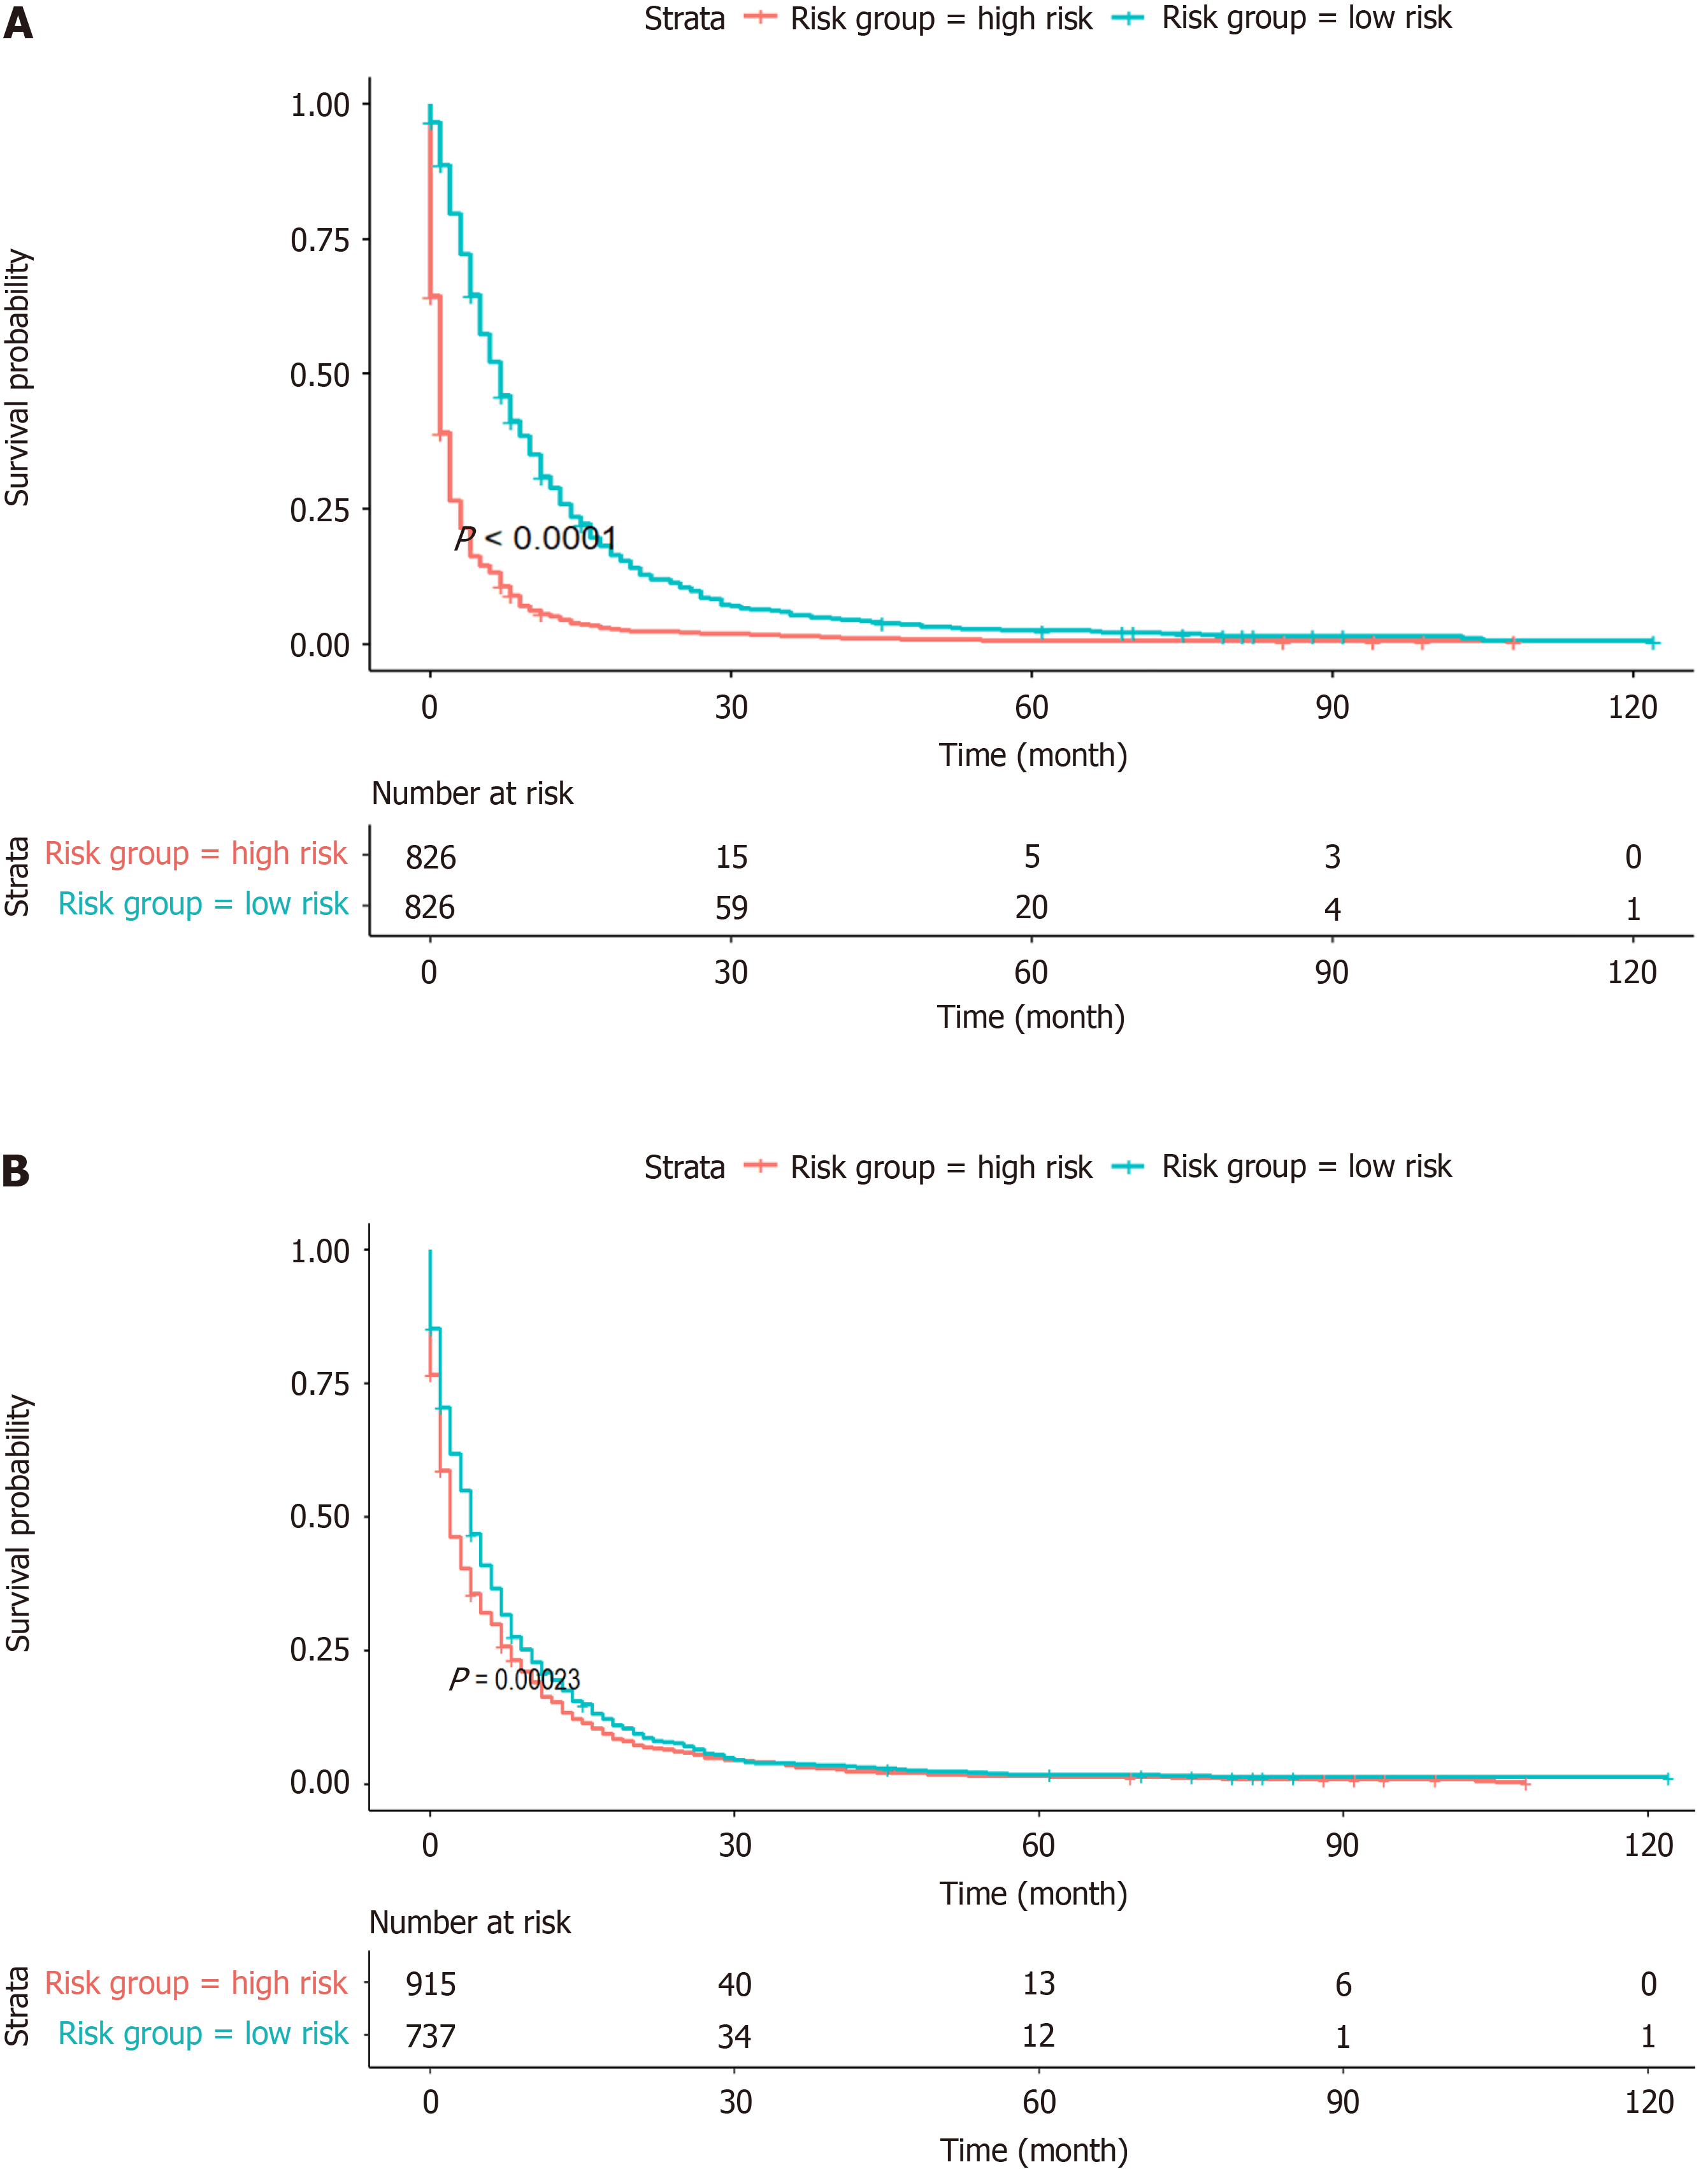
Figure 9 Comparison of Kaplan–Meier curves of gastric cancer with lung metastasis patients between new Cox model and Cox-American Joint Committee on Cancer.
A: Kaplan–Meier overall survival curves of gastric cancer with lung metastasis (GCLM) patients with different risks stratified; B: Kaplan–Meier Cox-American Joint Committee on Cancer curves of GCLM patients with different risks stratified.
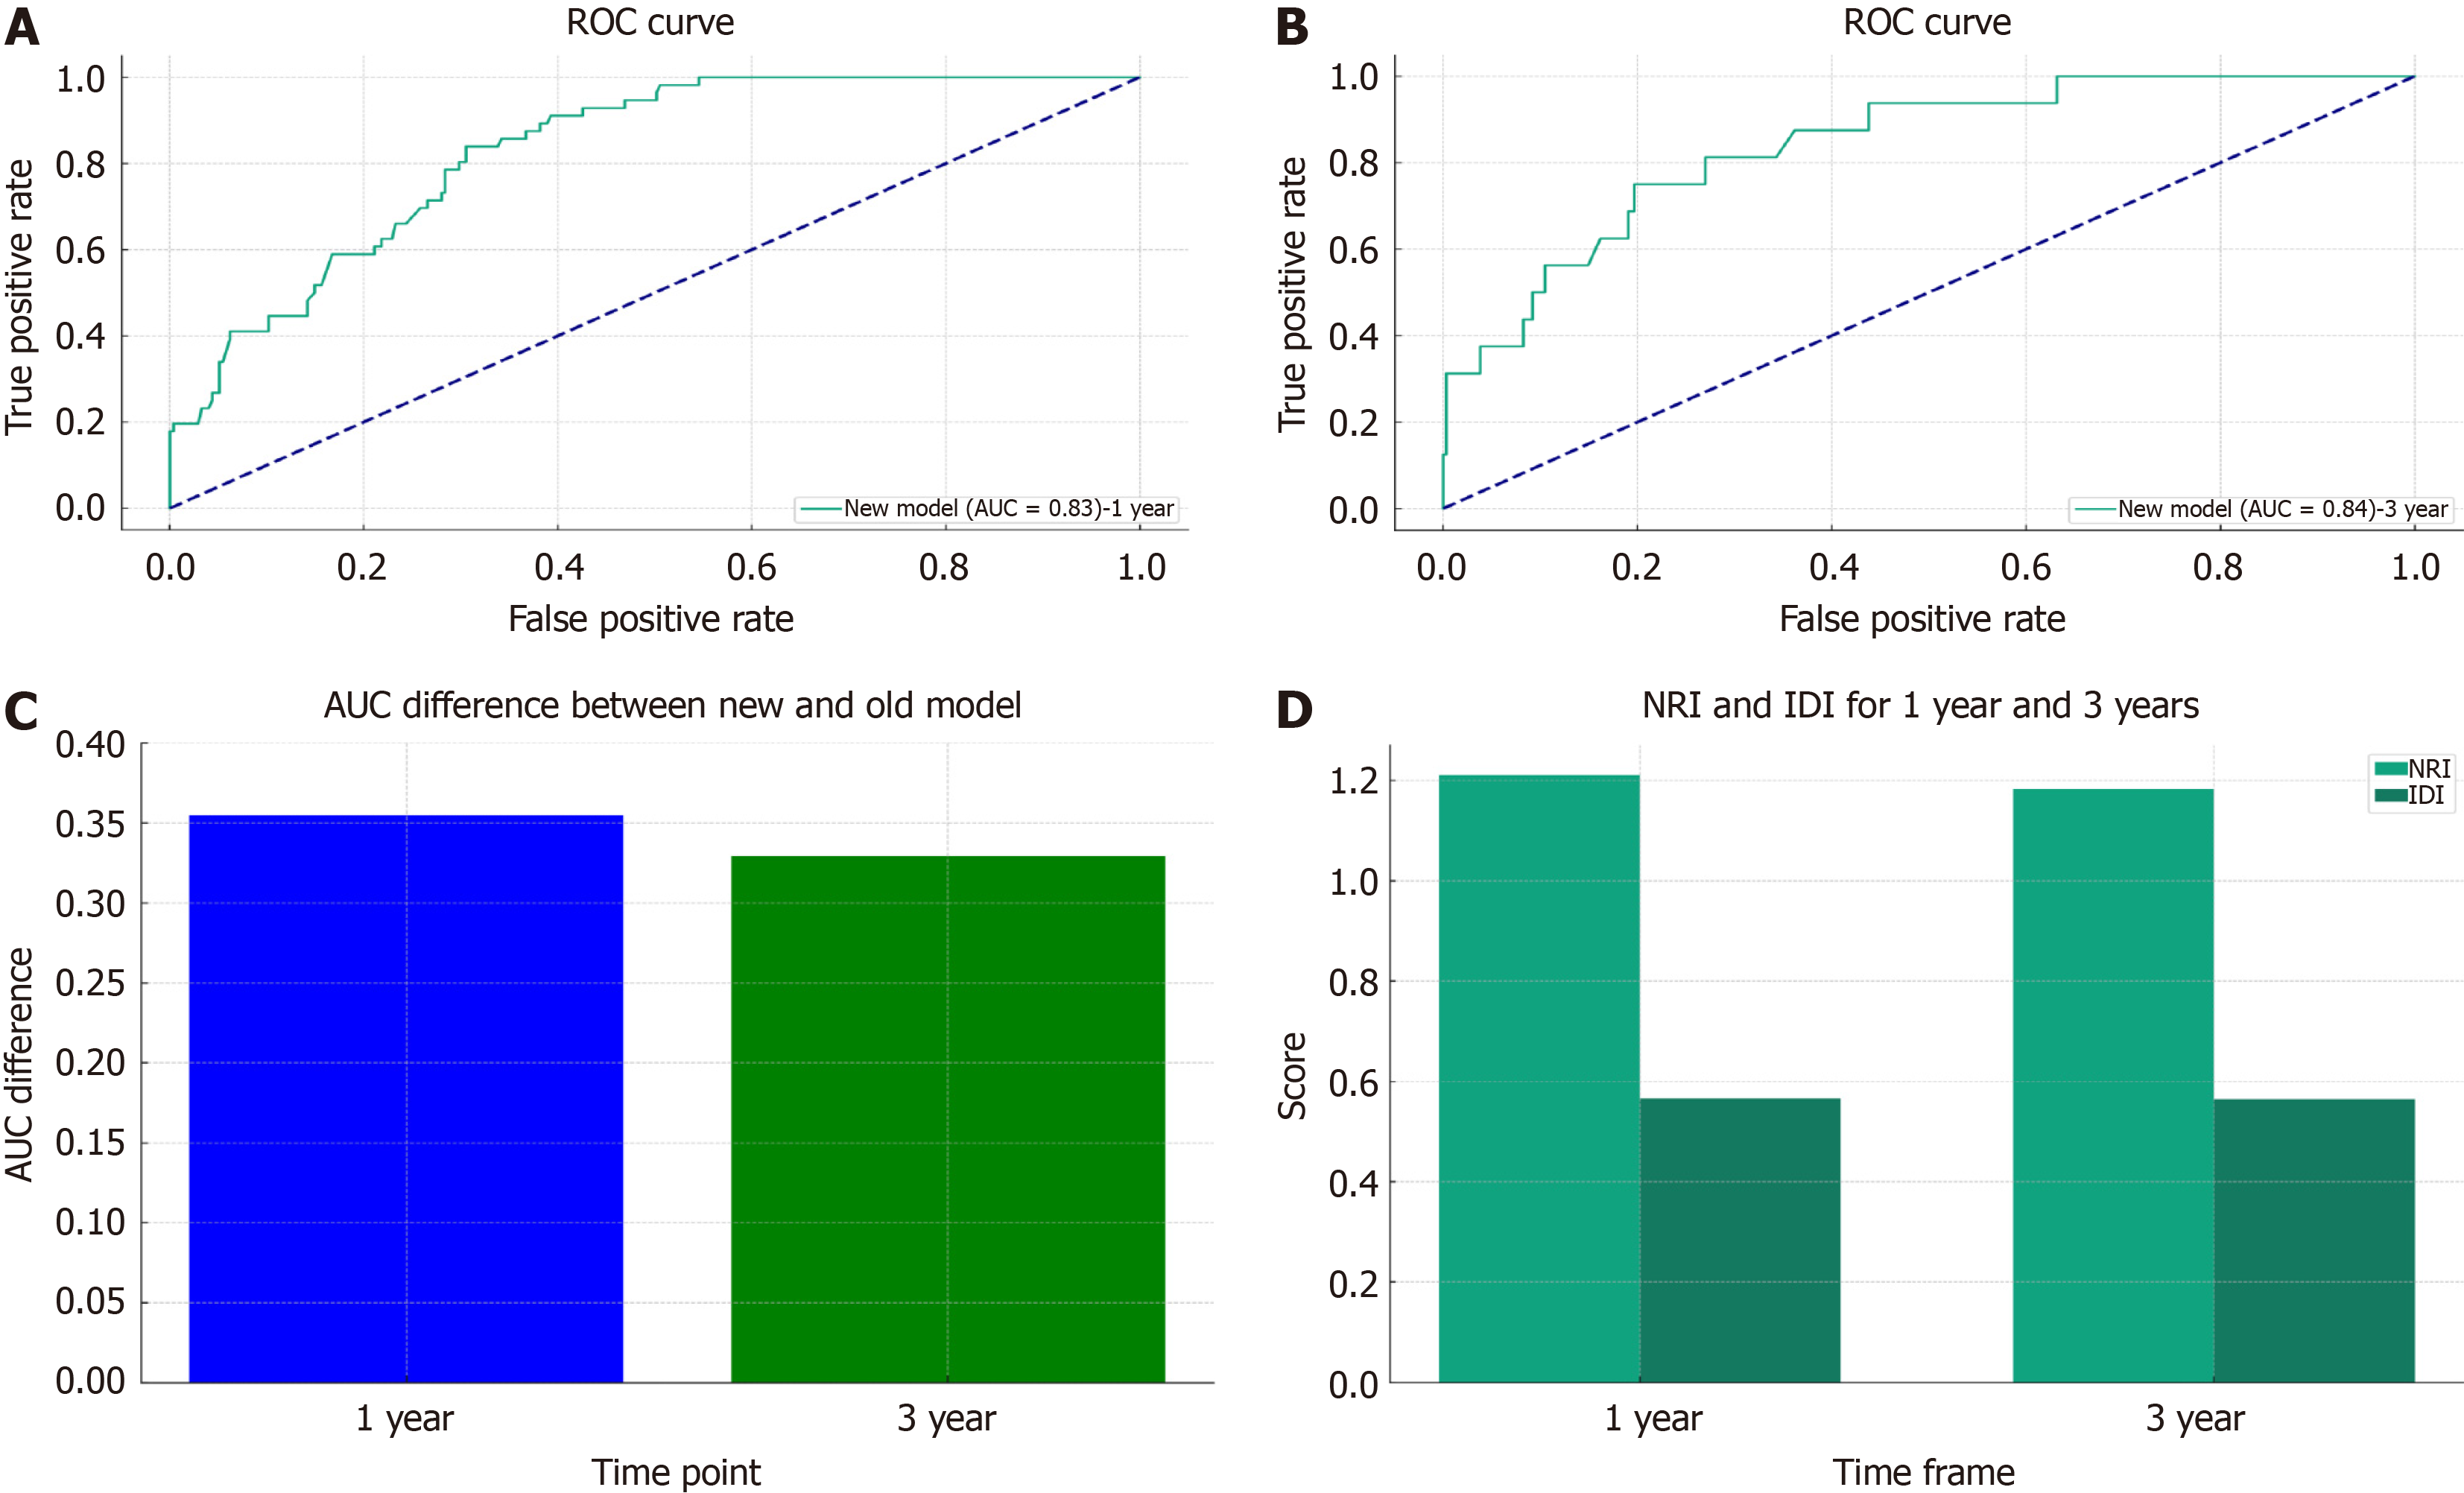
Figure 10 Comparison between the new and old models of net reclassification improvement and integrated discrimination improvement.
A: Receiver operating characteristic (ROC) curve of the participants in the 1-year integrated discrimination improvement (IDI) of the new model; B: ROC curve of the participants in the 3-year IDI of the new model; C: Area under the receiver operating characteristic curve difference between new and old model in 1-year and 3-year; D: New model net reclassification improvement and IDI for 1 Year and 3 Years. ROC: Receiver operating characteristic; AUC: Area under the receiver operating characteristic curve; NRI: Net reclassification improvement; IDI: Integrated discrimination improvement.
- Citation: Chen ZR, Yang MF, Xie ZY, Wang PA, Zhang L, Huang ZH, Luo Y. Risk stratification in gastric cancer lung metastasis: Utilizing an overall survival nomogram and comparing it with previous staging. World J Gastrointest Surg 2024; 16(2): 357-381
- URL: https://www.wjgnet.com/1948-9366/full/v16/i2/357.htm
- DOI: https://dx.doi.org/10.4240/wjgs.v16.i2.357


