Copyright
©The Author(s) 2024.
World J Gastrointest Surg. Oct 27, 2024; 16(10): 3334-3342
Published online Oct 27, 2024. doi: 10.4240/wjgs.v16.i10.3334
Published online Oct 27, 2024. doi: 10.4240/wjgs.v16.i10.3334
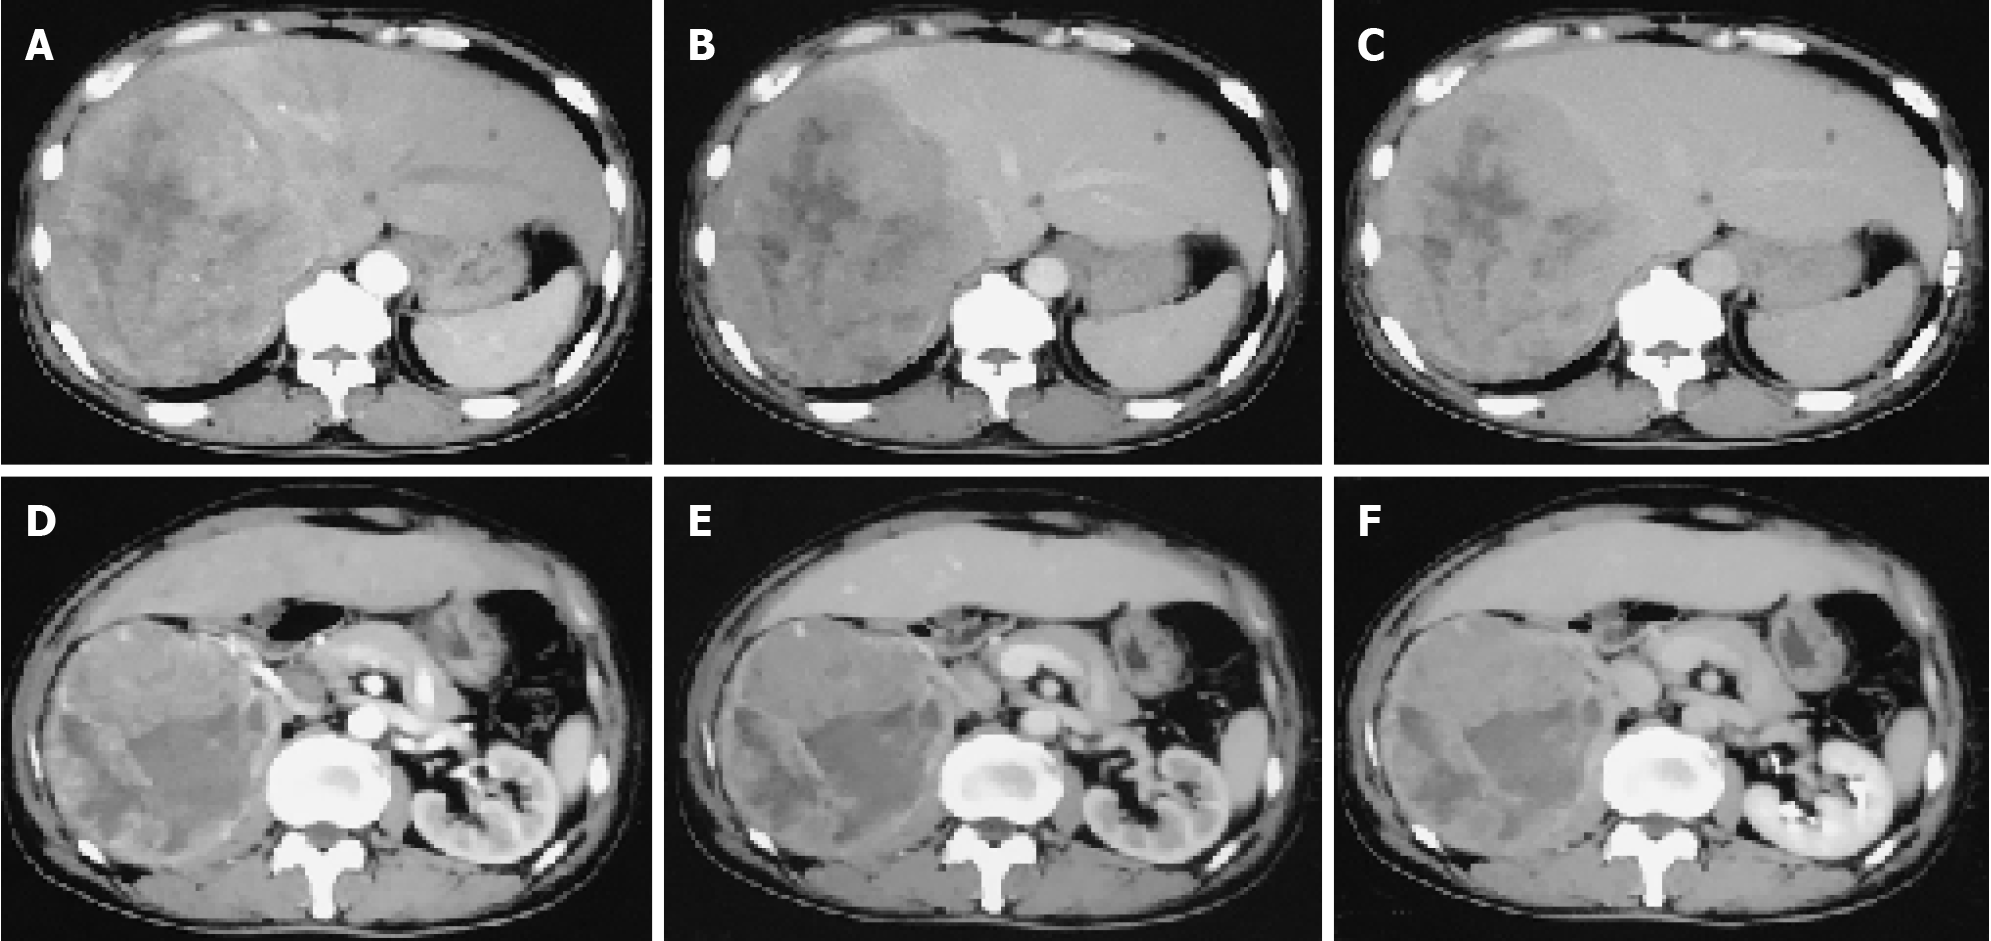
Figure 1 Images of the patient before hepatic artery perfusion chemotherapy.
A: Contrast-enhanced computed tomography (CT) scans showed a well-circumscribed mass with multiple low-density patchy shadows, measuring 140 cm × 16.0 cm in the right lobe of the liver during the arterial phase; B: Contrast-enhanced CT scans in the right lobe of the liver during the portal phase; C: Contrast-enhanced CT scans in the right lobe of the liver during the delayed phase; D: Contrast-enhanced CT scans showed a distinct soft tissue mass with clear-boundaries and low-density foci, measuring 115 cm × 12.0 cm, was identified in the upper pole of the right kidney during the arterial phase; E: Contrast-enhanced CT scans in the upper pole of the right kidney during the portal phase; F: Contrast-enhanced CT scans in the upper pole of the right kidney during the delayed phase.
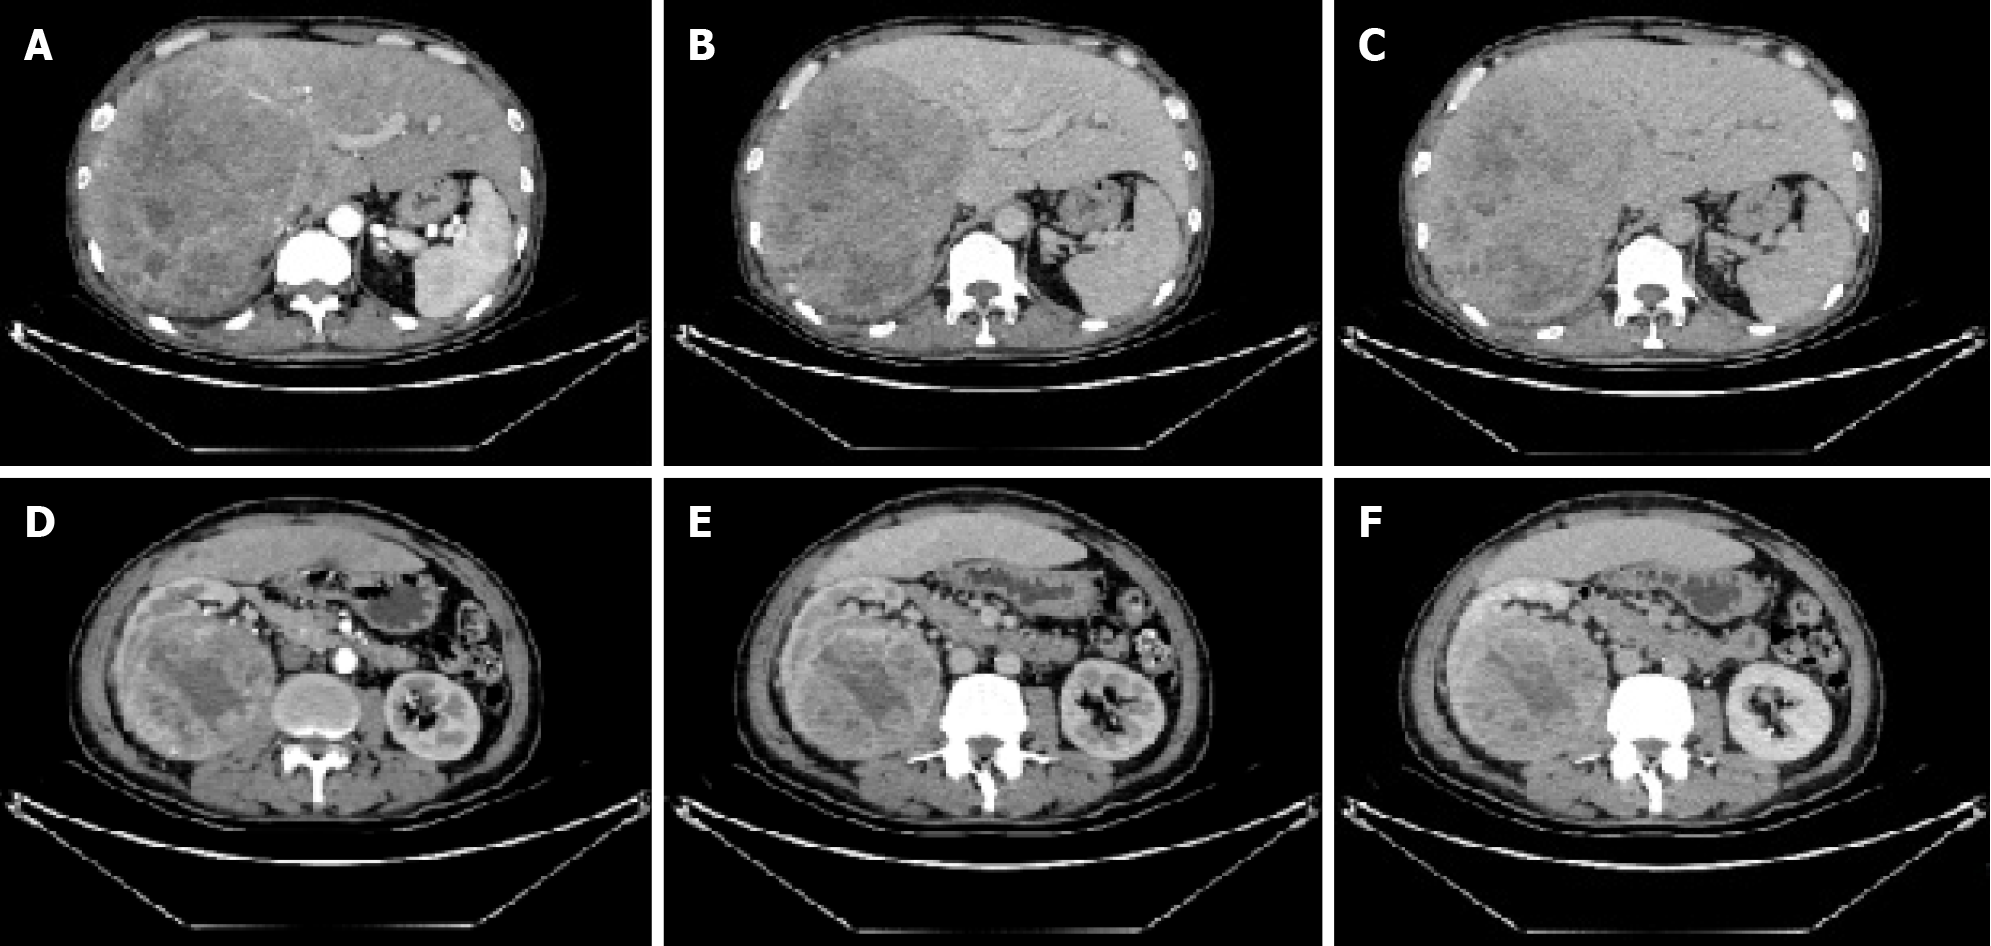
Figure 2 Images of the patient after hepatic artery perfusion chemotherapy.
A: Contrast-enhanced computed tomography (CT) scans showed a well-circumscribed mass with multiple low-density patchy shadows, measuring 145 cm × 18.5 cm × 26.4 cm in the right lobe of the liver during the arterial phase; B: Contrast-enhanced CT scans in the right lobe of the liver during the portal phase; C: Contrast-enhanced CT scans in the right lobe of the liver during the delayed phase; D: A distinct soft tissue mass with clear-boundaries and low-density foci, measuring 116 cm × 11.9 cm × 12.2 cm, was identified in the upper pole of the right kidney during the arterial phase; E: Contrast-enhanced CT scans in the upper pole of the right kidney during the portal phase; F: Contrast-enhanced CT scans in the upper pole of the right kidney during the delayed phase.
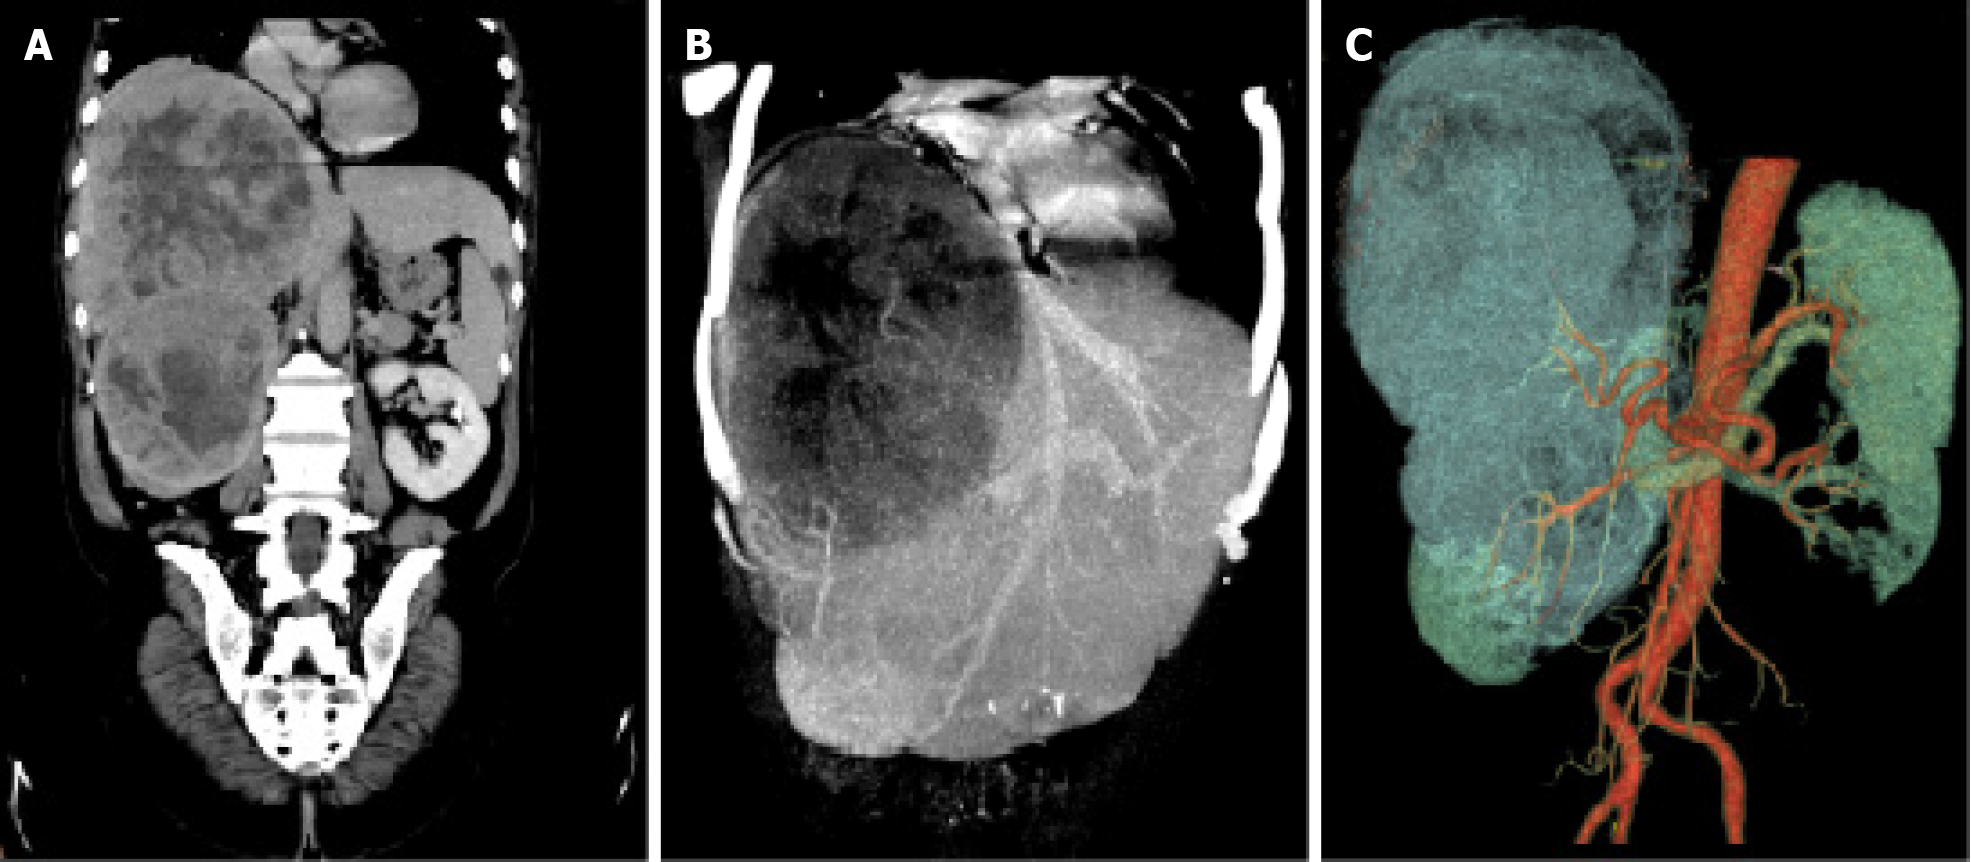
Figure 3 Images of tumor vascular supply.
A: The computed tomography reconstructions displayed a large well-circumscribed mass with uneven density in the right lobe of the liver and a clear-boundary and round-like neoplasm in the right kidney at the coronal level; B: In the maximum intensity projection images, there was no visualization of the right hepatic vein and the middle hepatic vein appeared compressed and deformed due to the presence of the tumor; C: The volume rendering technique images revealed that the hepatic tumor was supplied by branches of the proper hepatic artery and the renal neoplasm received blood supply from branches of the renal artery.
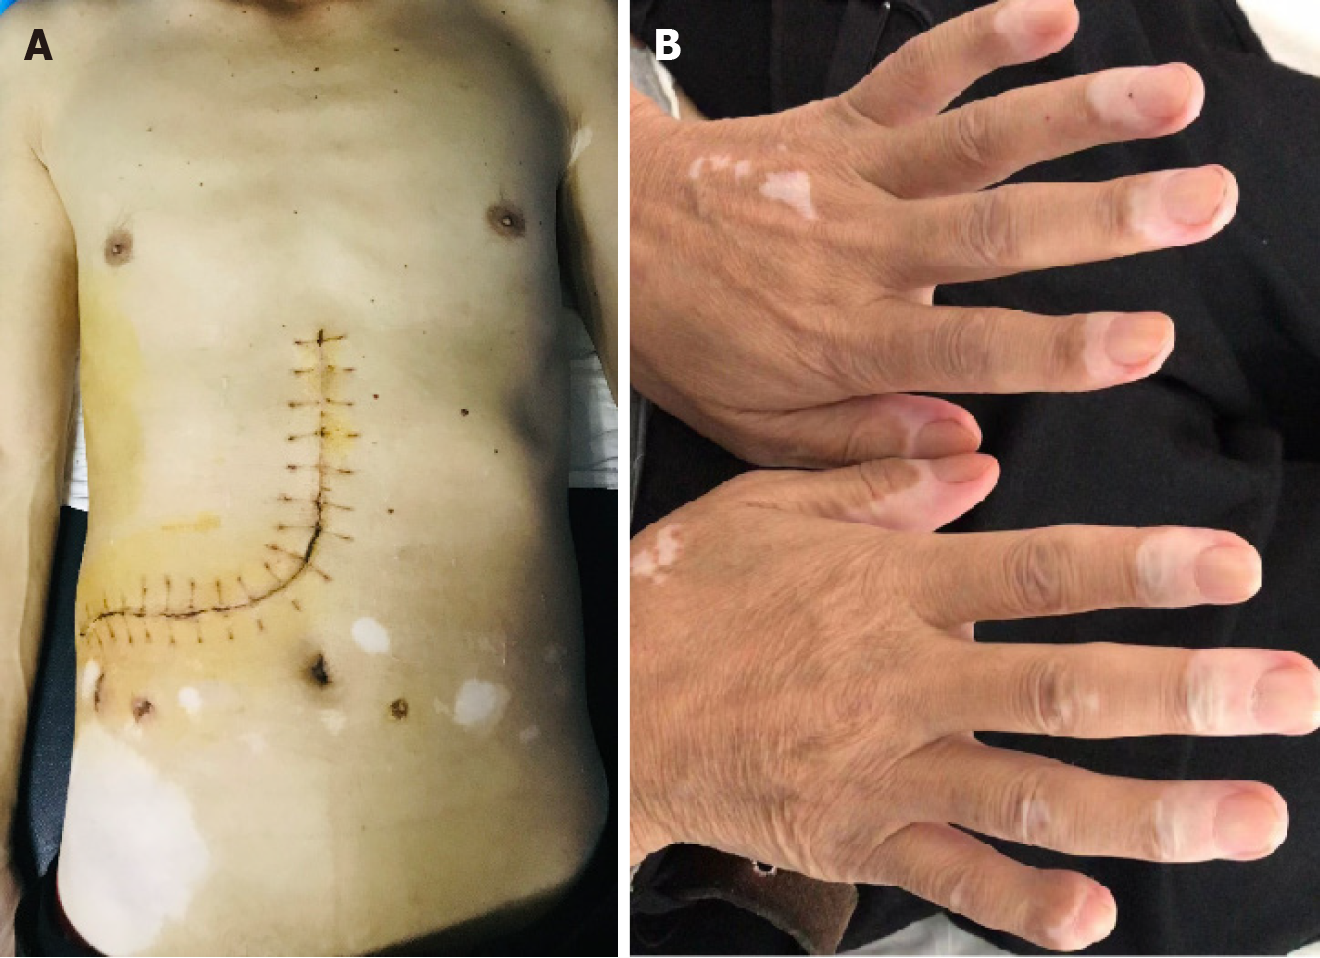
Figure 4 Depigmented macules.
A: They were observed in parts of axillary region and abdomen; B: They were observed in parts of fingers and hand dorsum.
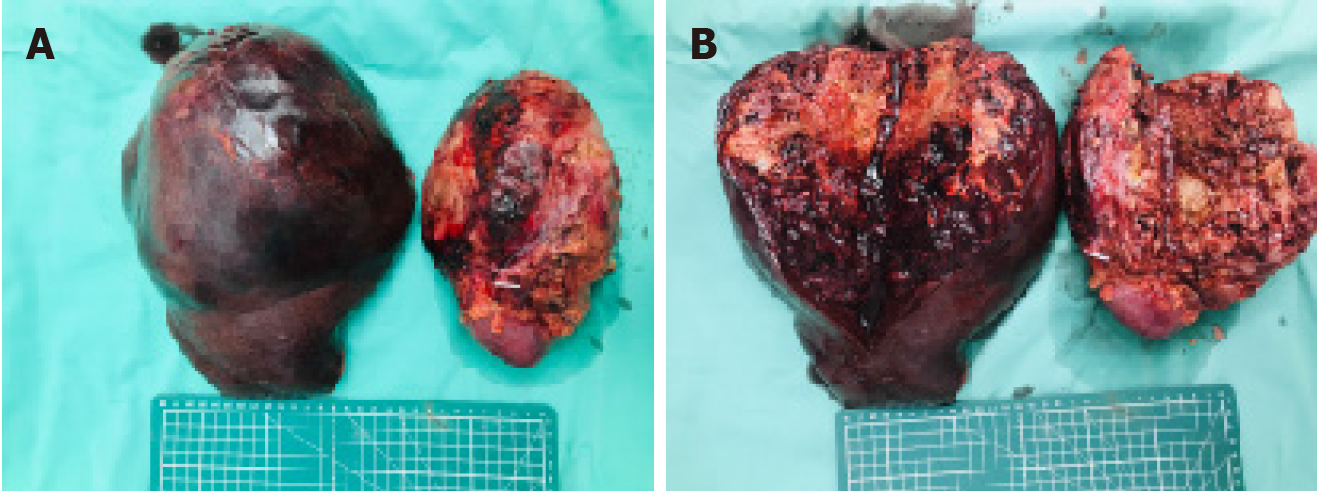
Figure 5 Images of surgical specimens.
A: The neoplasm in the liver was approximately 24 cm × 17 cm × 14.5 cm in size and the neoplasm in the kidney measured approximately 12 cm × 10 cm × 11.7 cm on the gross examination of the surgical specimens; B: Upon sectioning, both tumors exhibited focal haemorrhage and displayed gray-yellow or gray-red colors.
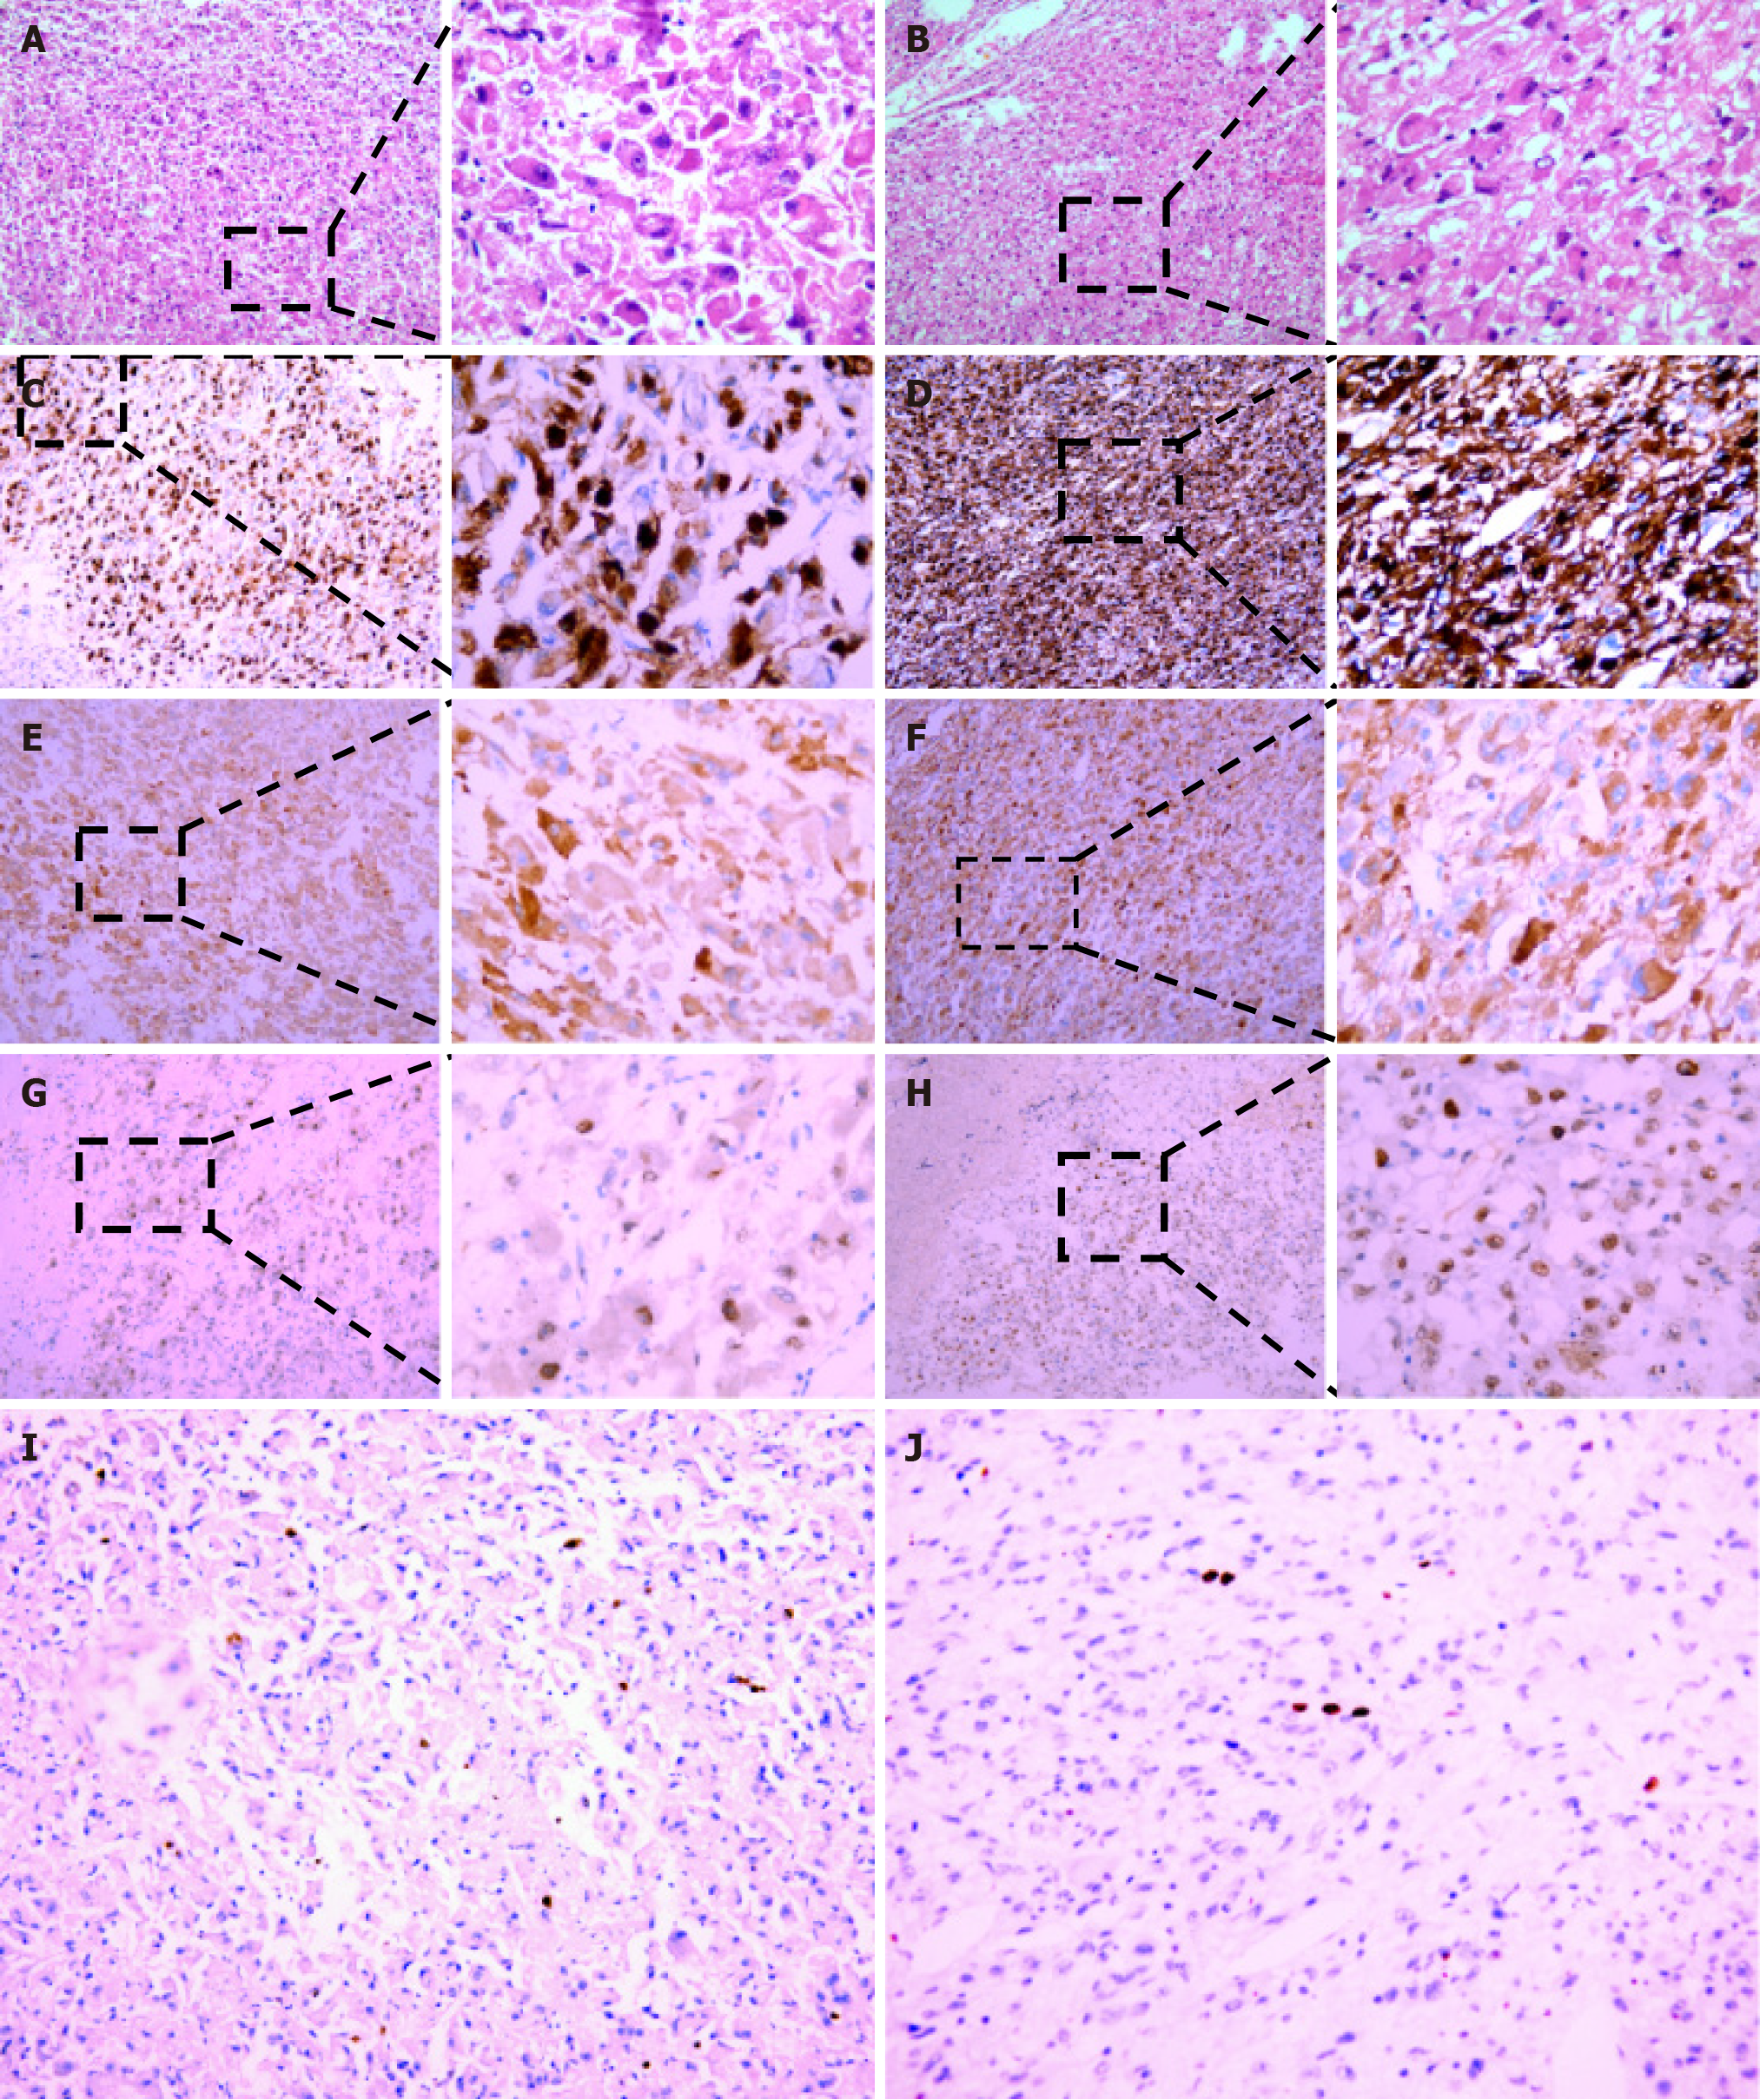
Figure 6 Pathological findings of surgical specimens.
A and B: The histopathological examination of surgical specimens from liver and kidney lesions showed tumor lesions mainly composed of dysplasia epithelioid cells with rich and red-stained cytoplasm and large, atypical and vacuolated nuclei, and prominent nucleolus (hematoxylin-eosin, original magnification × 100 and × 400); C and D: The surgical specimens from the liver and kidney lesions showed strong and diffuse granular cytoplasmic immunoreactivity for HMB-45 in epithelioid tumor cells (original magnification × 100 and × 400); E and F: The surgical specimens from the liver and kidney lesions exhibited intense and partly cytoplasmic expression of melan-A, with a staining pattern similar to that of HMB-45 (original magnification × 100 and × 400); G and H: The surgical specimens from the liver and kidney lesions revealed weak and punctate nuclear immunoreactivity for TFE3 in the epithelioid tumor cells (original magnification × 100 and × 400); I and J: The surgical specimens from the liver and kidney lesions displayed weak expression of Ki67 in the nuclei of the epithelioid cells (original magnification × 100).
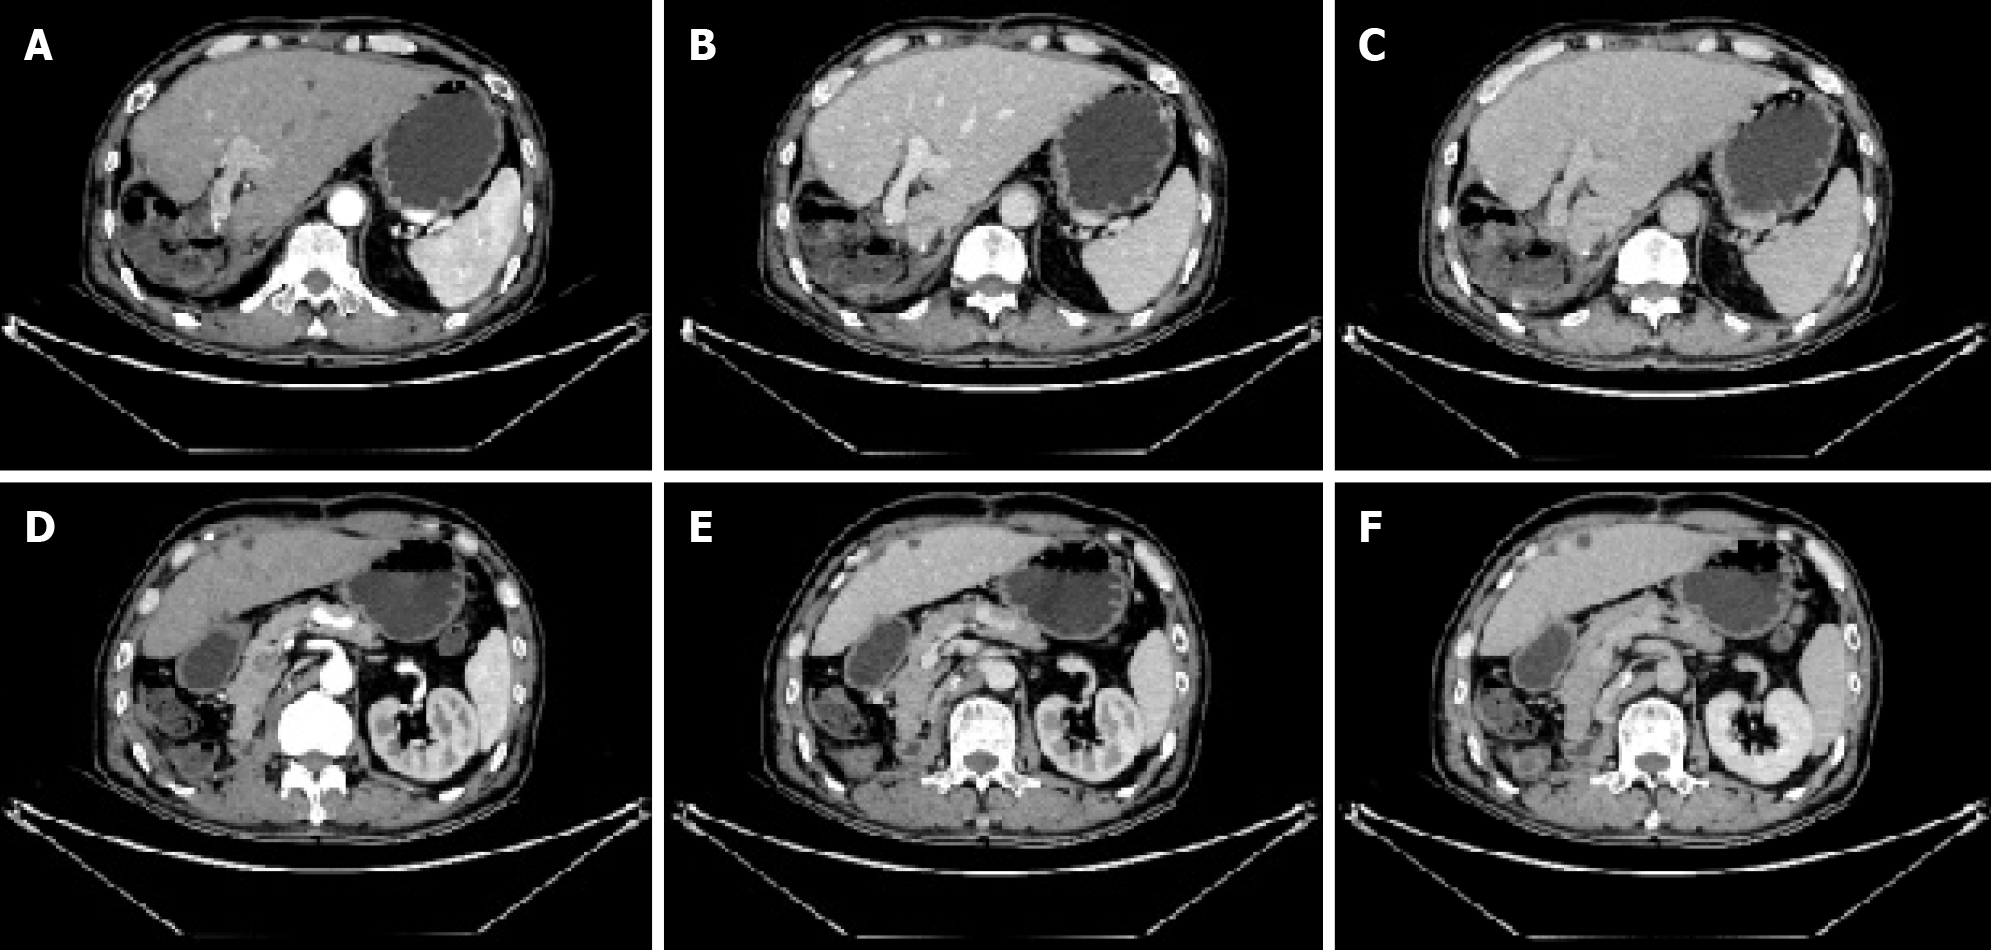
Figure 7 Images of the patient 1 year after discharge.
A: Contrast-enhanced computed tomography (CT) scans revealed banded low-density shadows in the liver surgical area during the arterial phase; B: Contrast-enhanced CT scans in the liver surgical area during the portal phase; C: Contrast-enhanced CT scans in the liver surgical area during the delayed phase; D: Contrast-enhanced CT scans revealed banded low-density shadows in the right kidney surgical area during the arterial phase; E: Contrast-enhanced CT scans in the right kidney surgical area during the portal phase; F: Contrast-enhanced CT scans in the right kidney surgical area during the delayed phase.
- Citation: Yang HT, Wang FR, He N, She YH, Du YY, Shi WG, Yang J, Chen G, Zhang SZ, Cui F, Long B, Yu ZY, Zhu JM, Zhang GY. Massive simultaneous hepatic and renal perivascular epithelioid cell tumor benefitted from surgery and everolimus treatment: A case report. World J Gastrointest Surg 2024; 16(10): 3334-3342
- URL: https://www.wjgnet.com/1948-9366/full/v16/i10/3334.htm
- DOI: https://dx.doi.org/10.4240/wjgs.v16.i10.3334


