Copyright
©The Author(s) 2024.
World J Gastrointest Surg. Oct 27, 2024; 16(10): 3239-3252
Published online Oct 27, 2024. doi: 10.4240/wjgs.v16.i10.3239
Published online Oct 27, 2024. doi: 10.4240/wjgs.v16.i10.3239
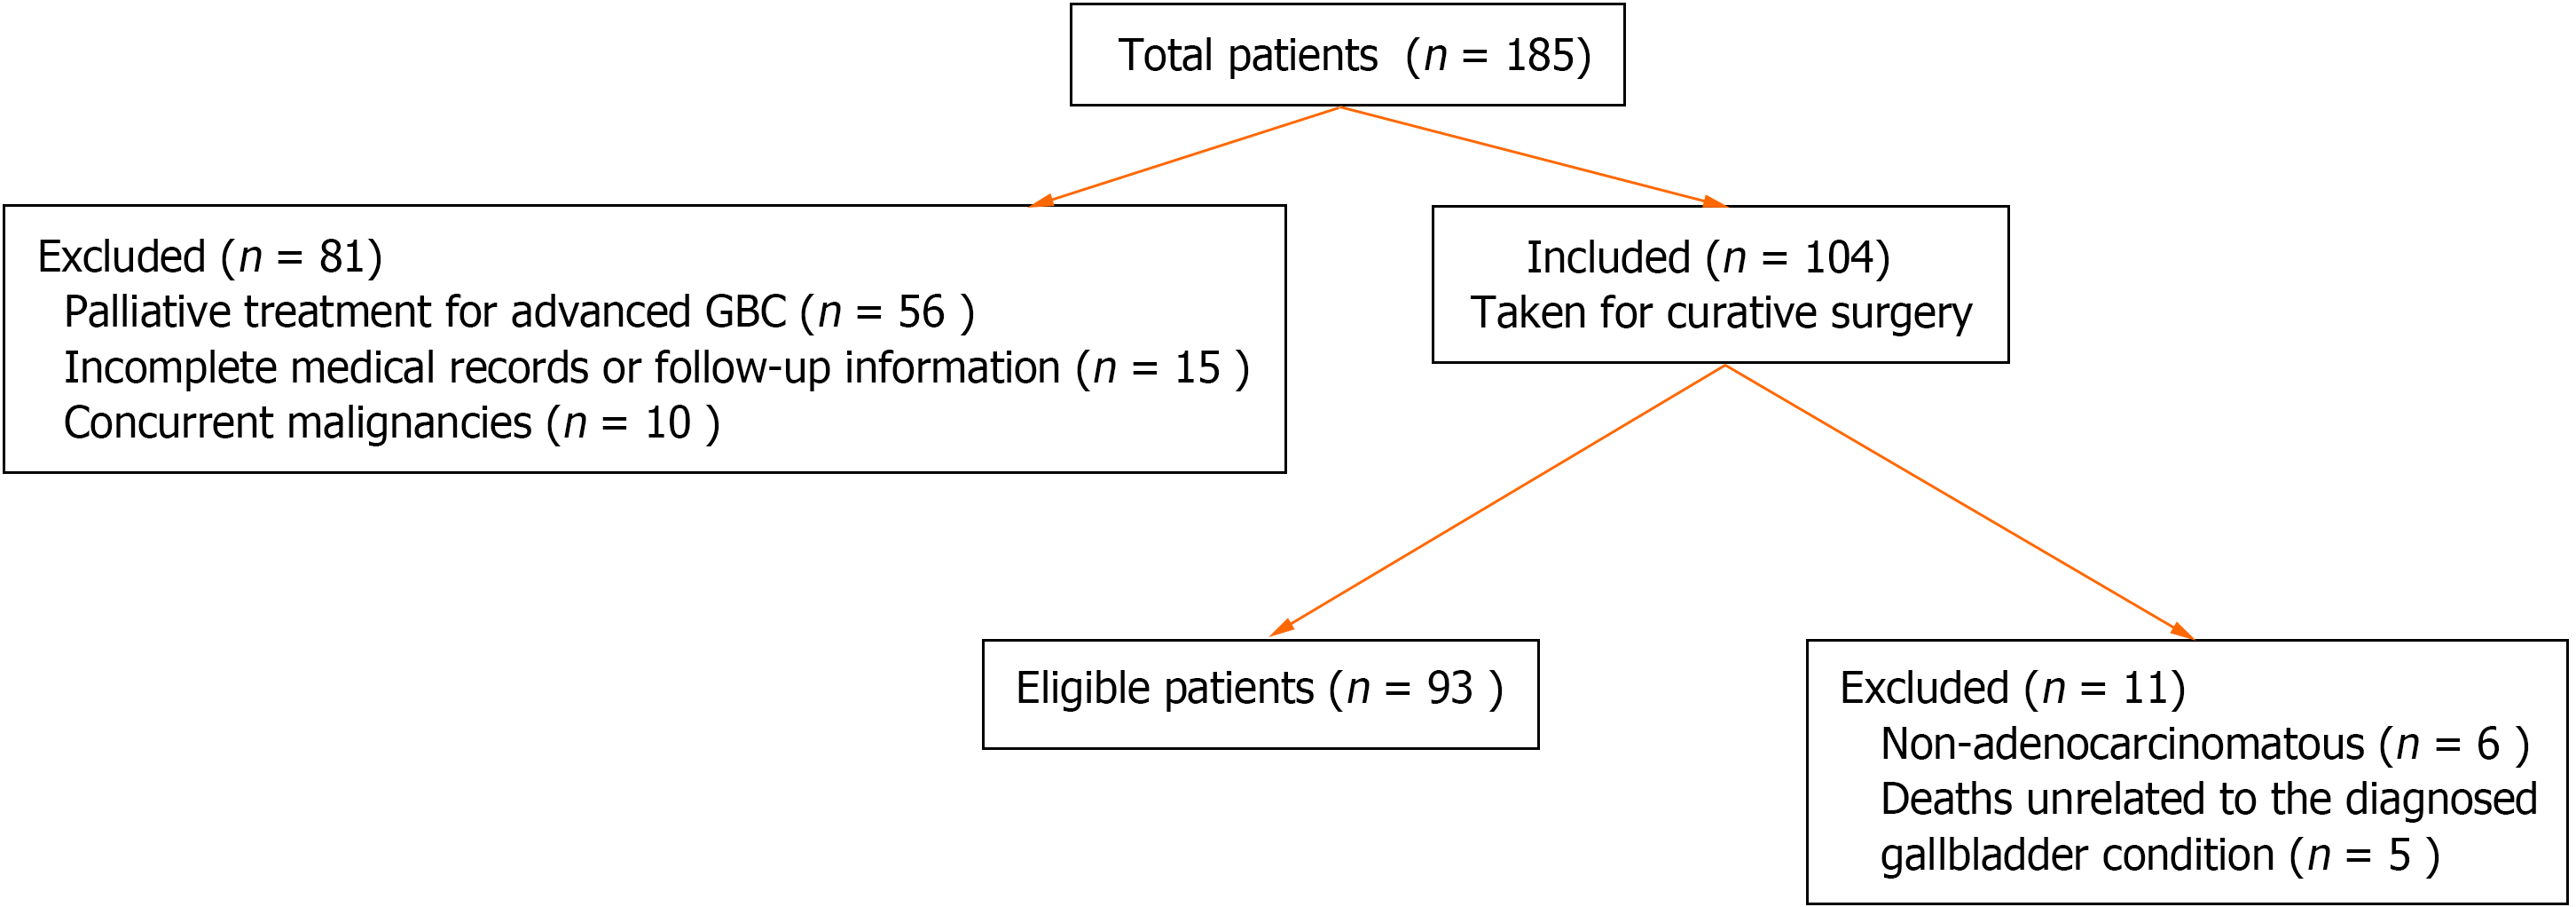
Figure 1
Details of the included patients.
GBC: Gallbladder cancer.
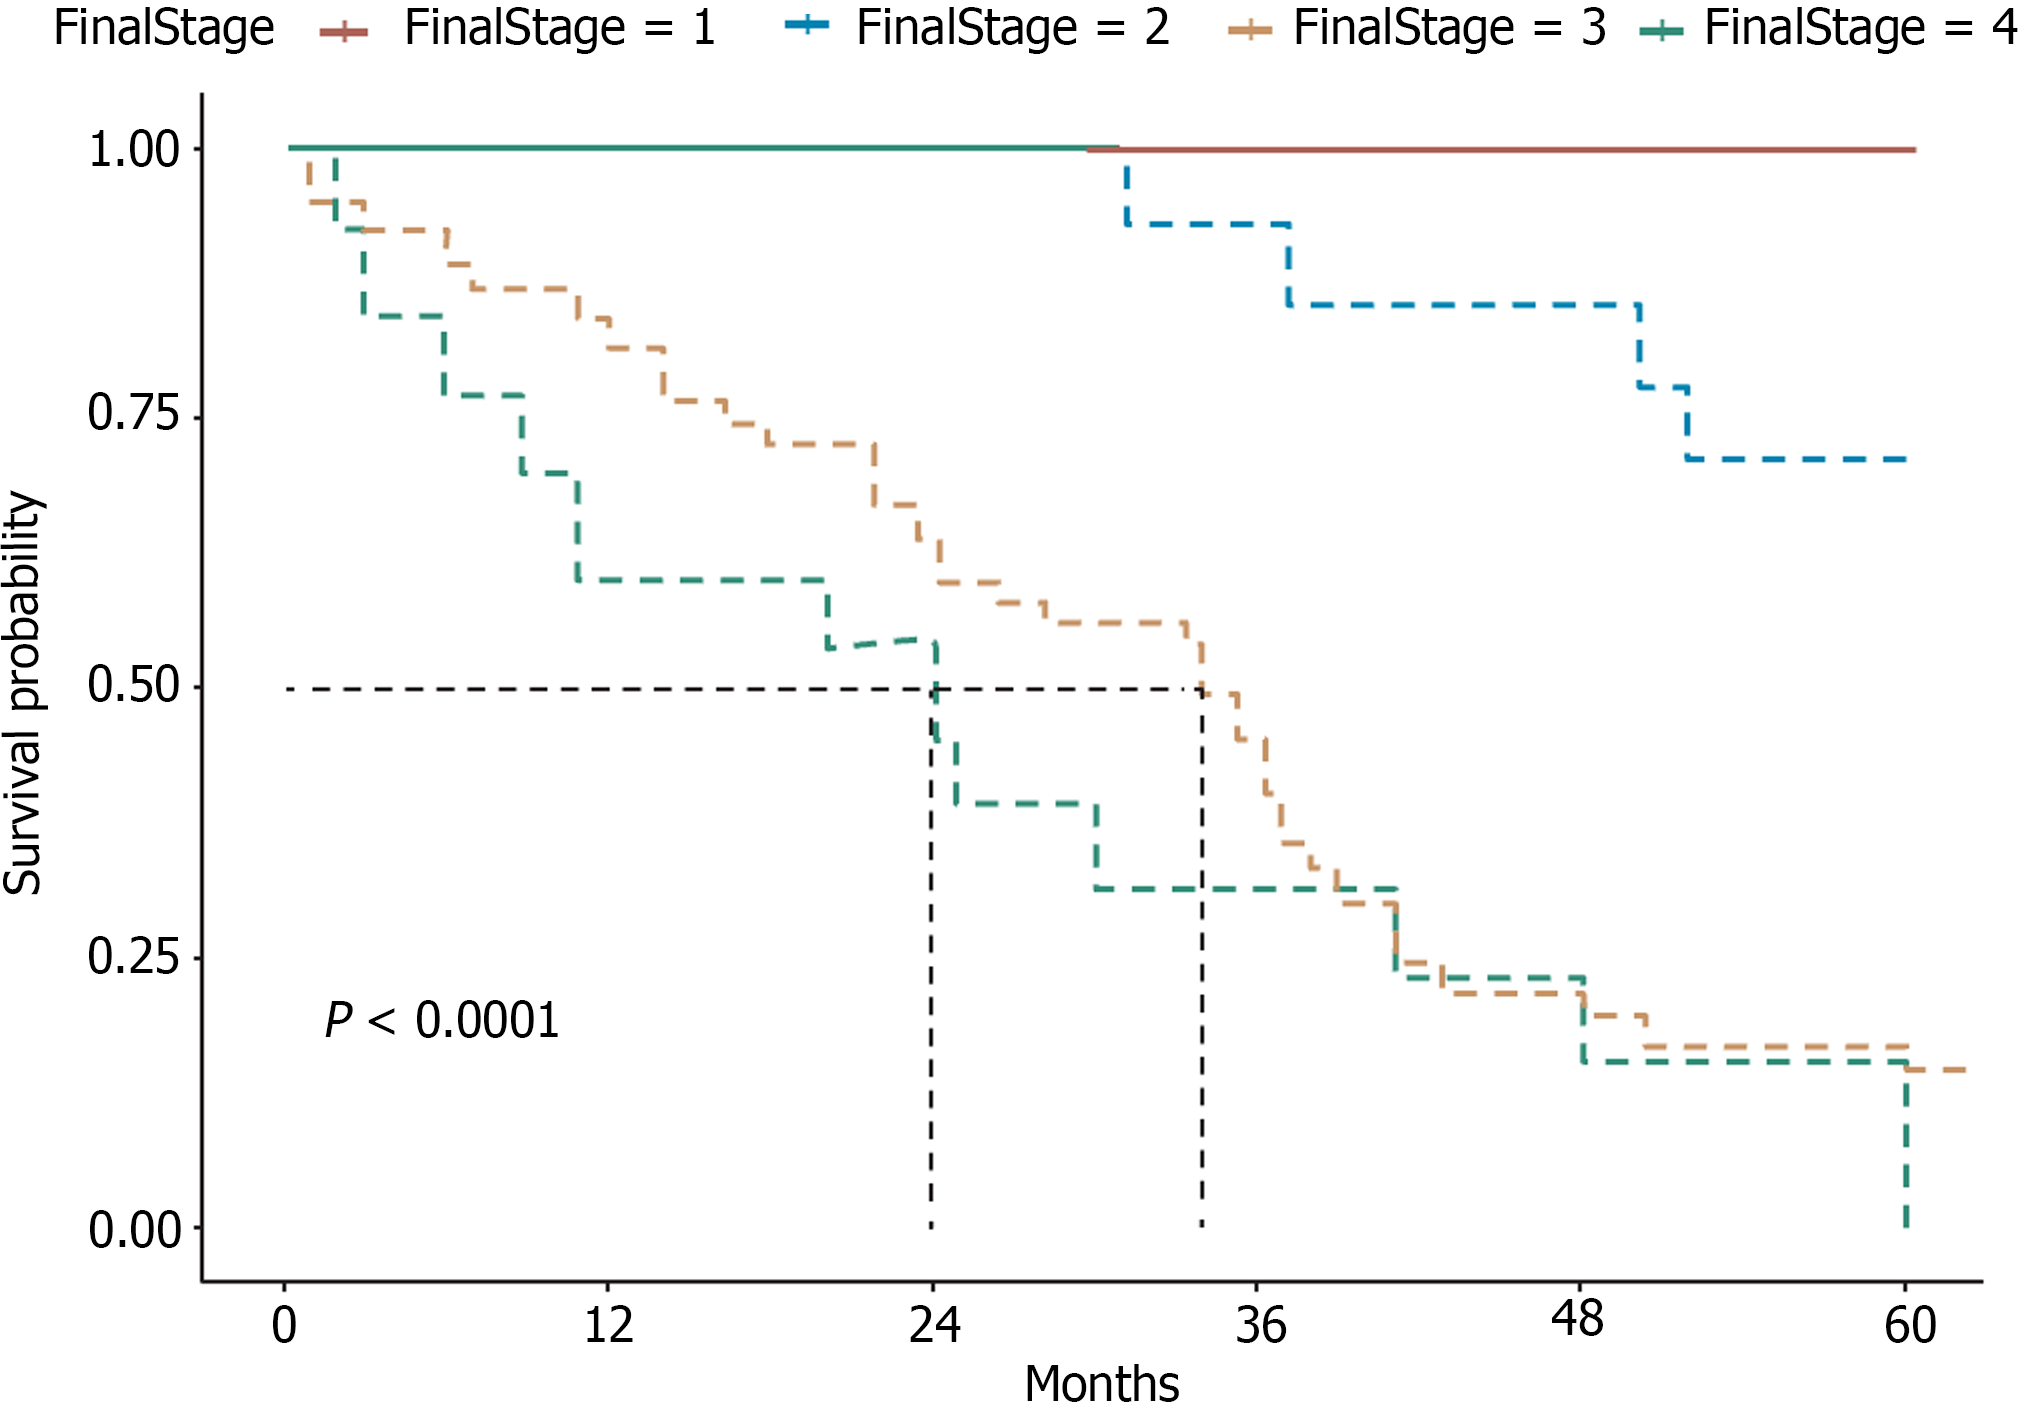
Figure 2
Stagewise overall survival.
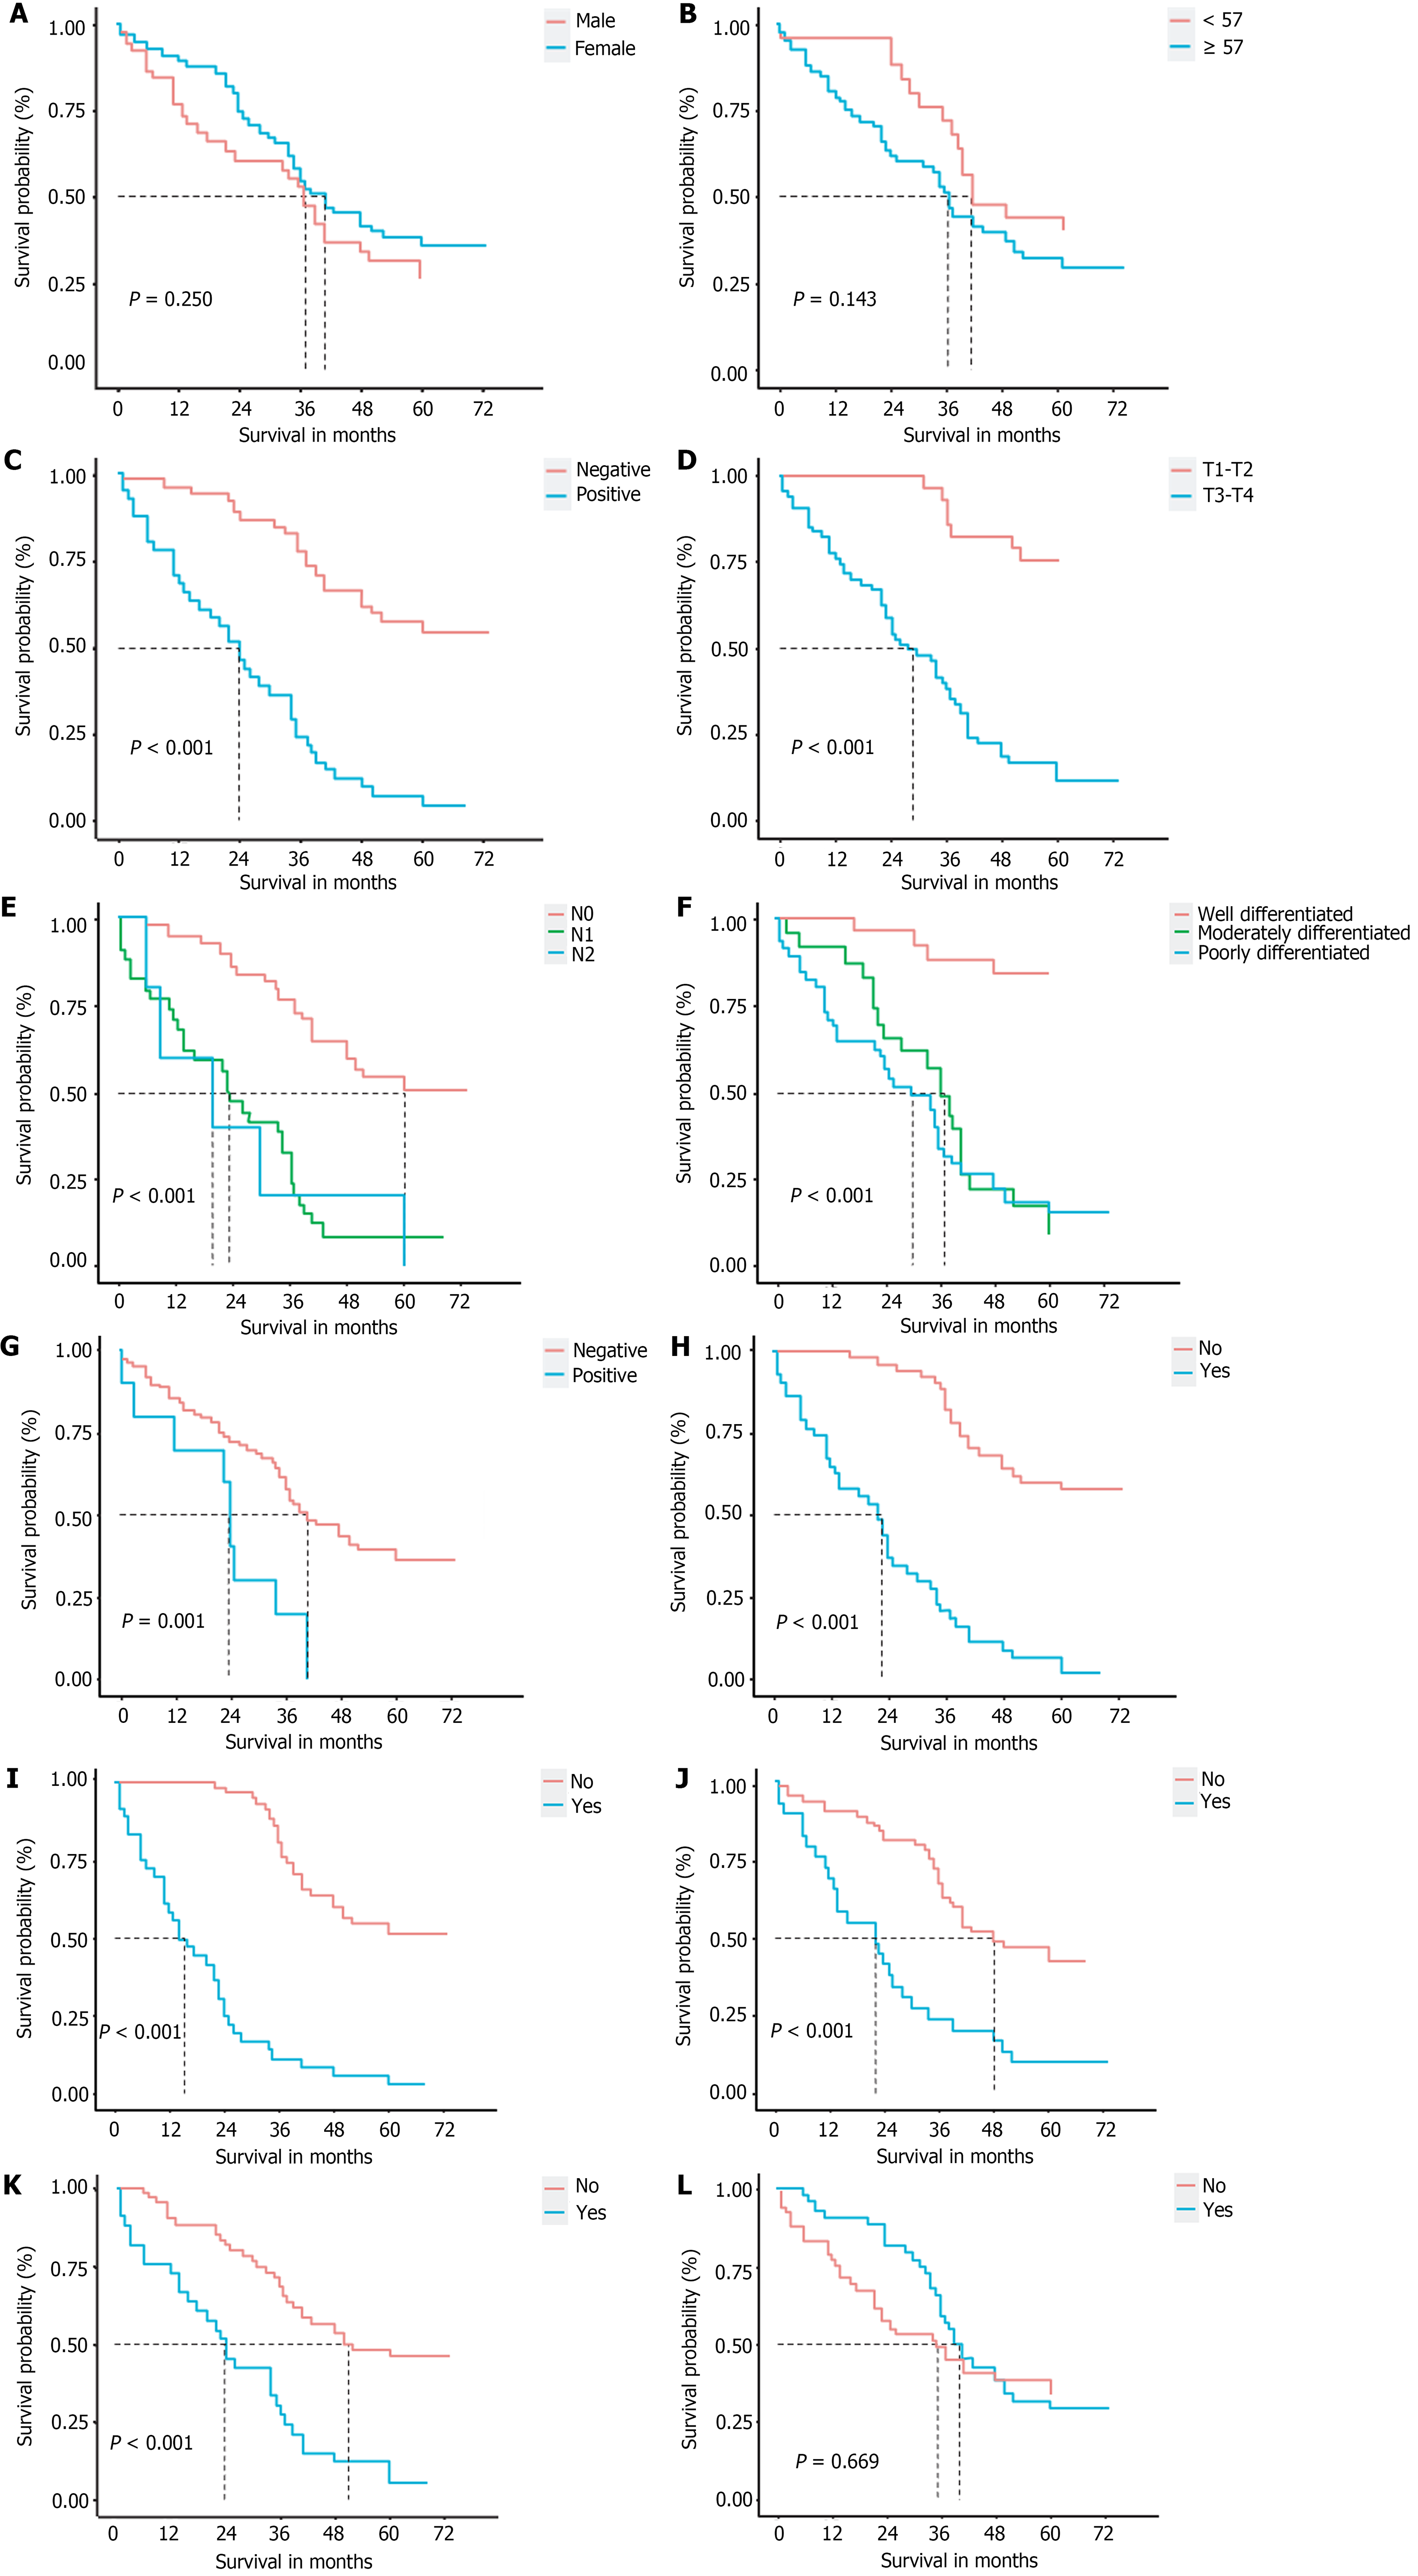
Figure 3 Survival curves of patients.
A: Gender; B: Age; C: Antigen 19-9 glycan antigen; D: T stage; E: Lymph node metastasis; F: Histological grade; G: Surgical margin; H: Liver invasion; I: Extrahepatic bile duct invasion; J: Neural invasion; K: Vascular invasion; L: Postoperative adjuvant therapy.
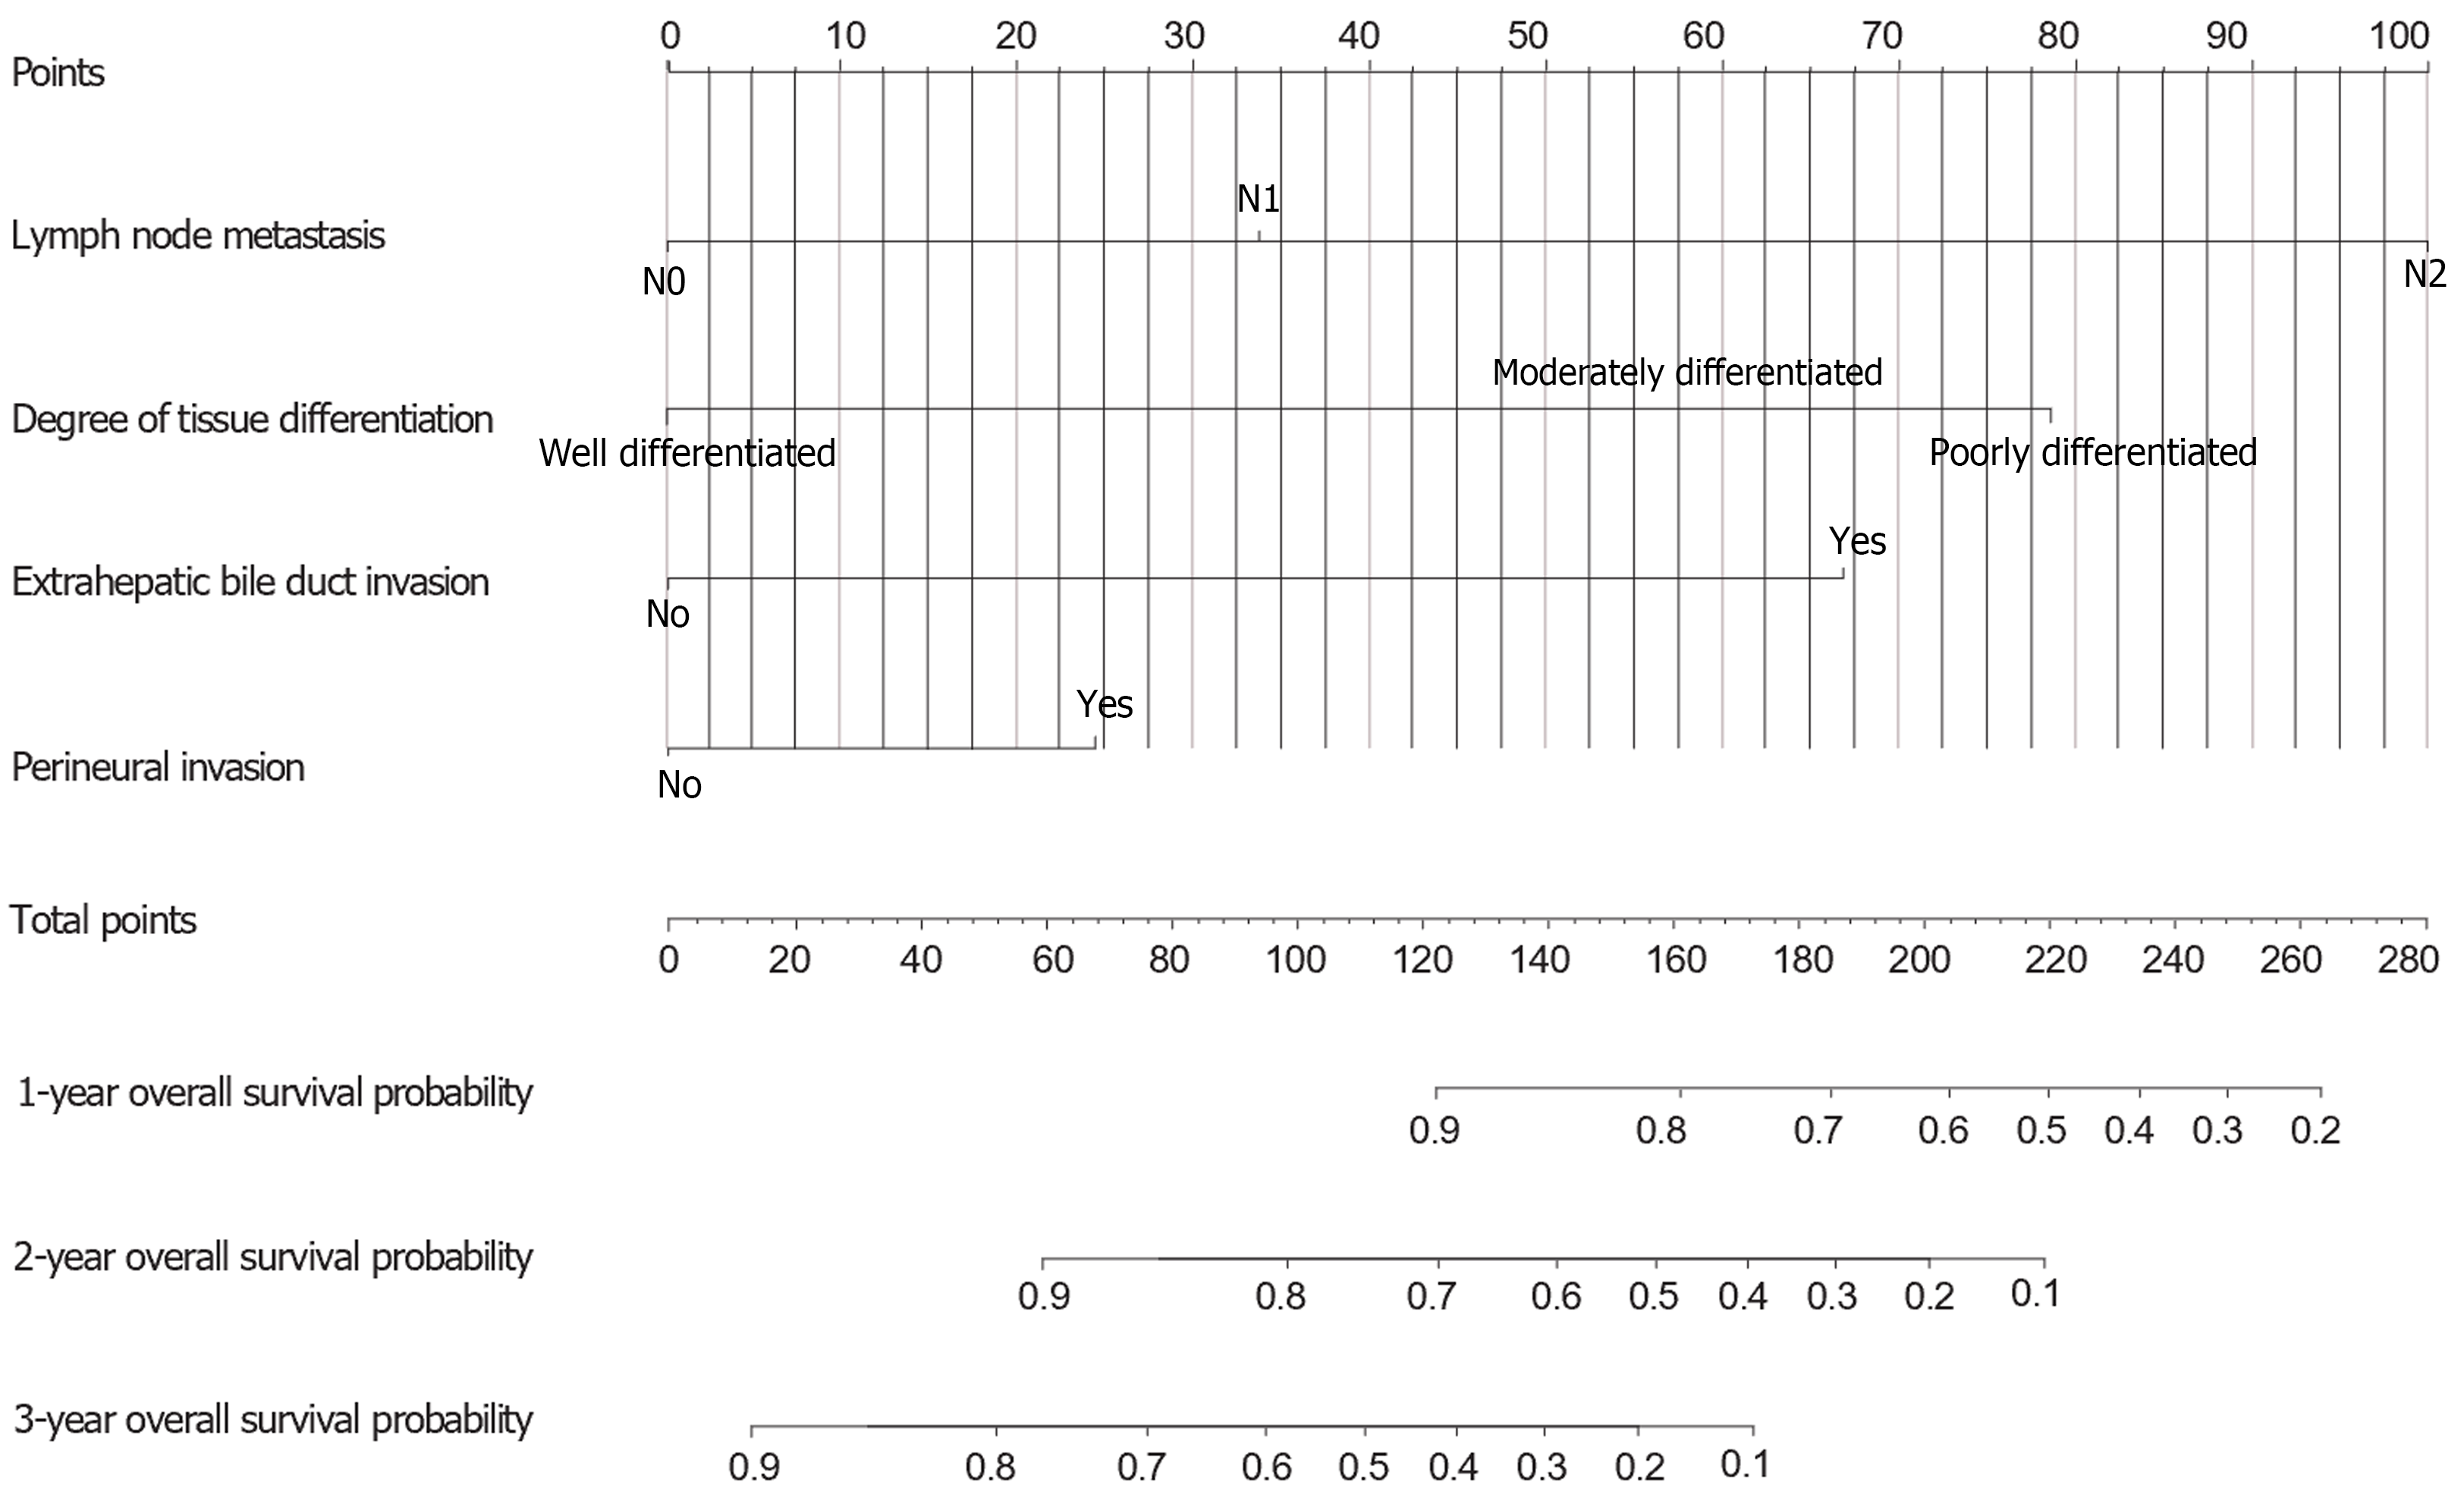
Figure 4
Nomogram for predicting survival in patients after radical surgery.
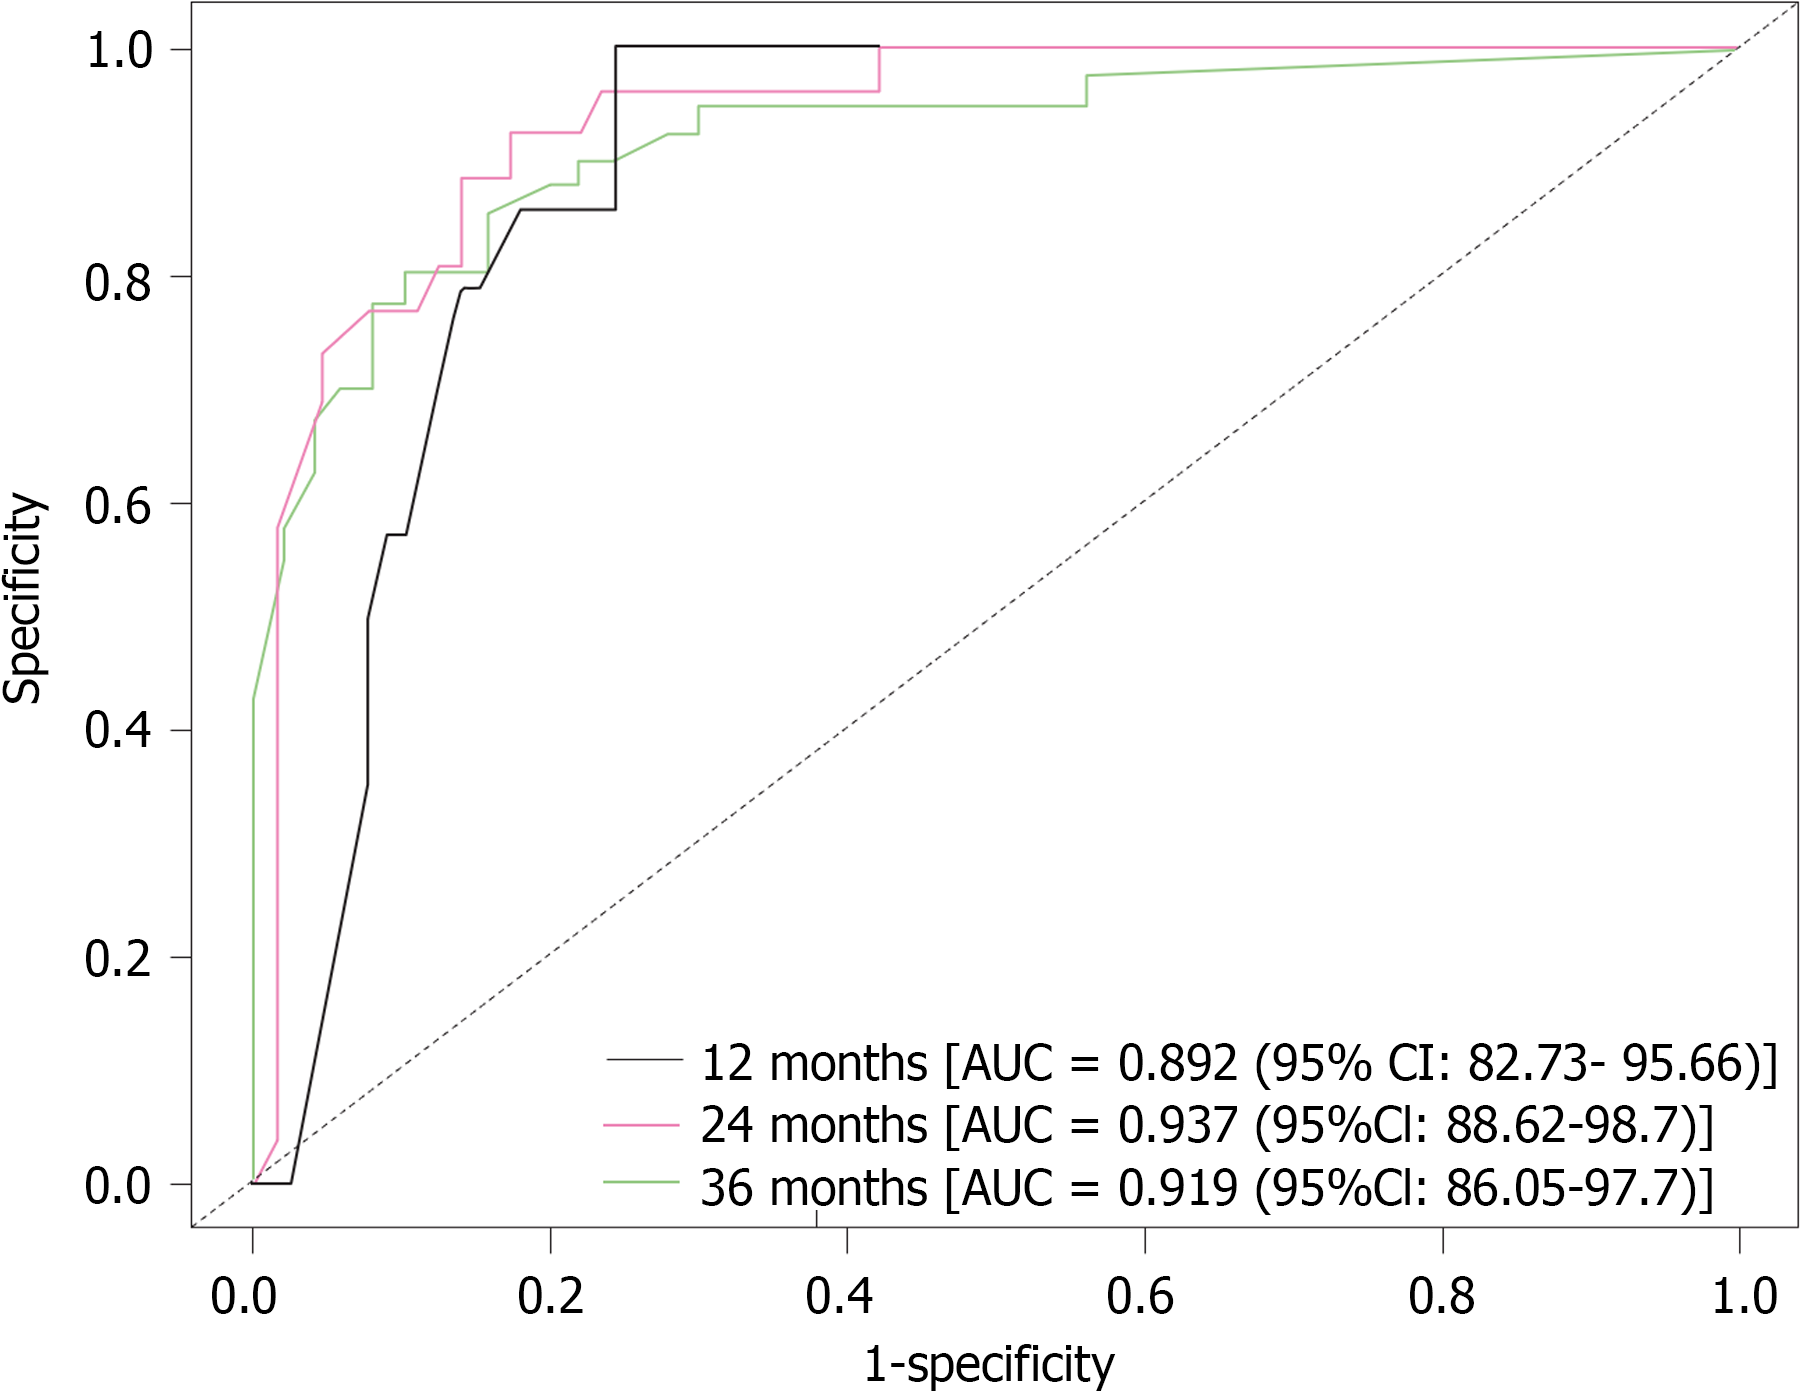
Figure 5 The receiver operating characteristic curves of present prediction model for 1, 2, and 3 years overall survival.
AUC: Area under the curve.
Figure 6
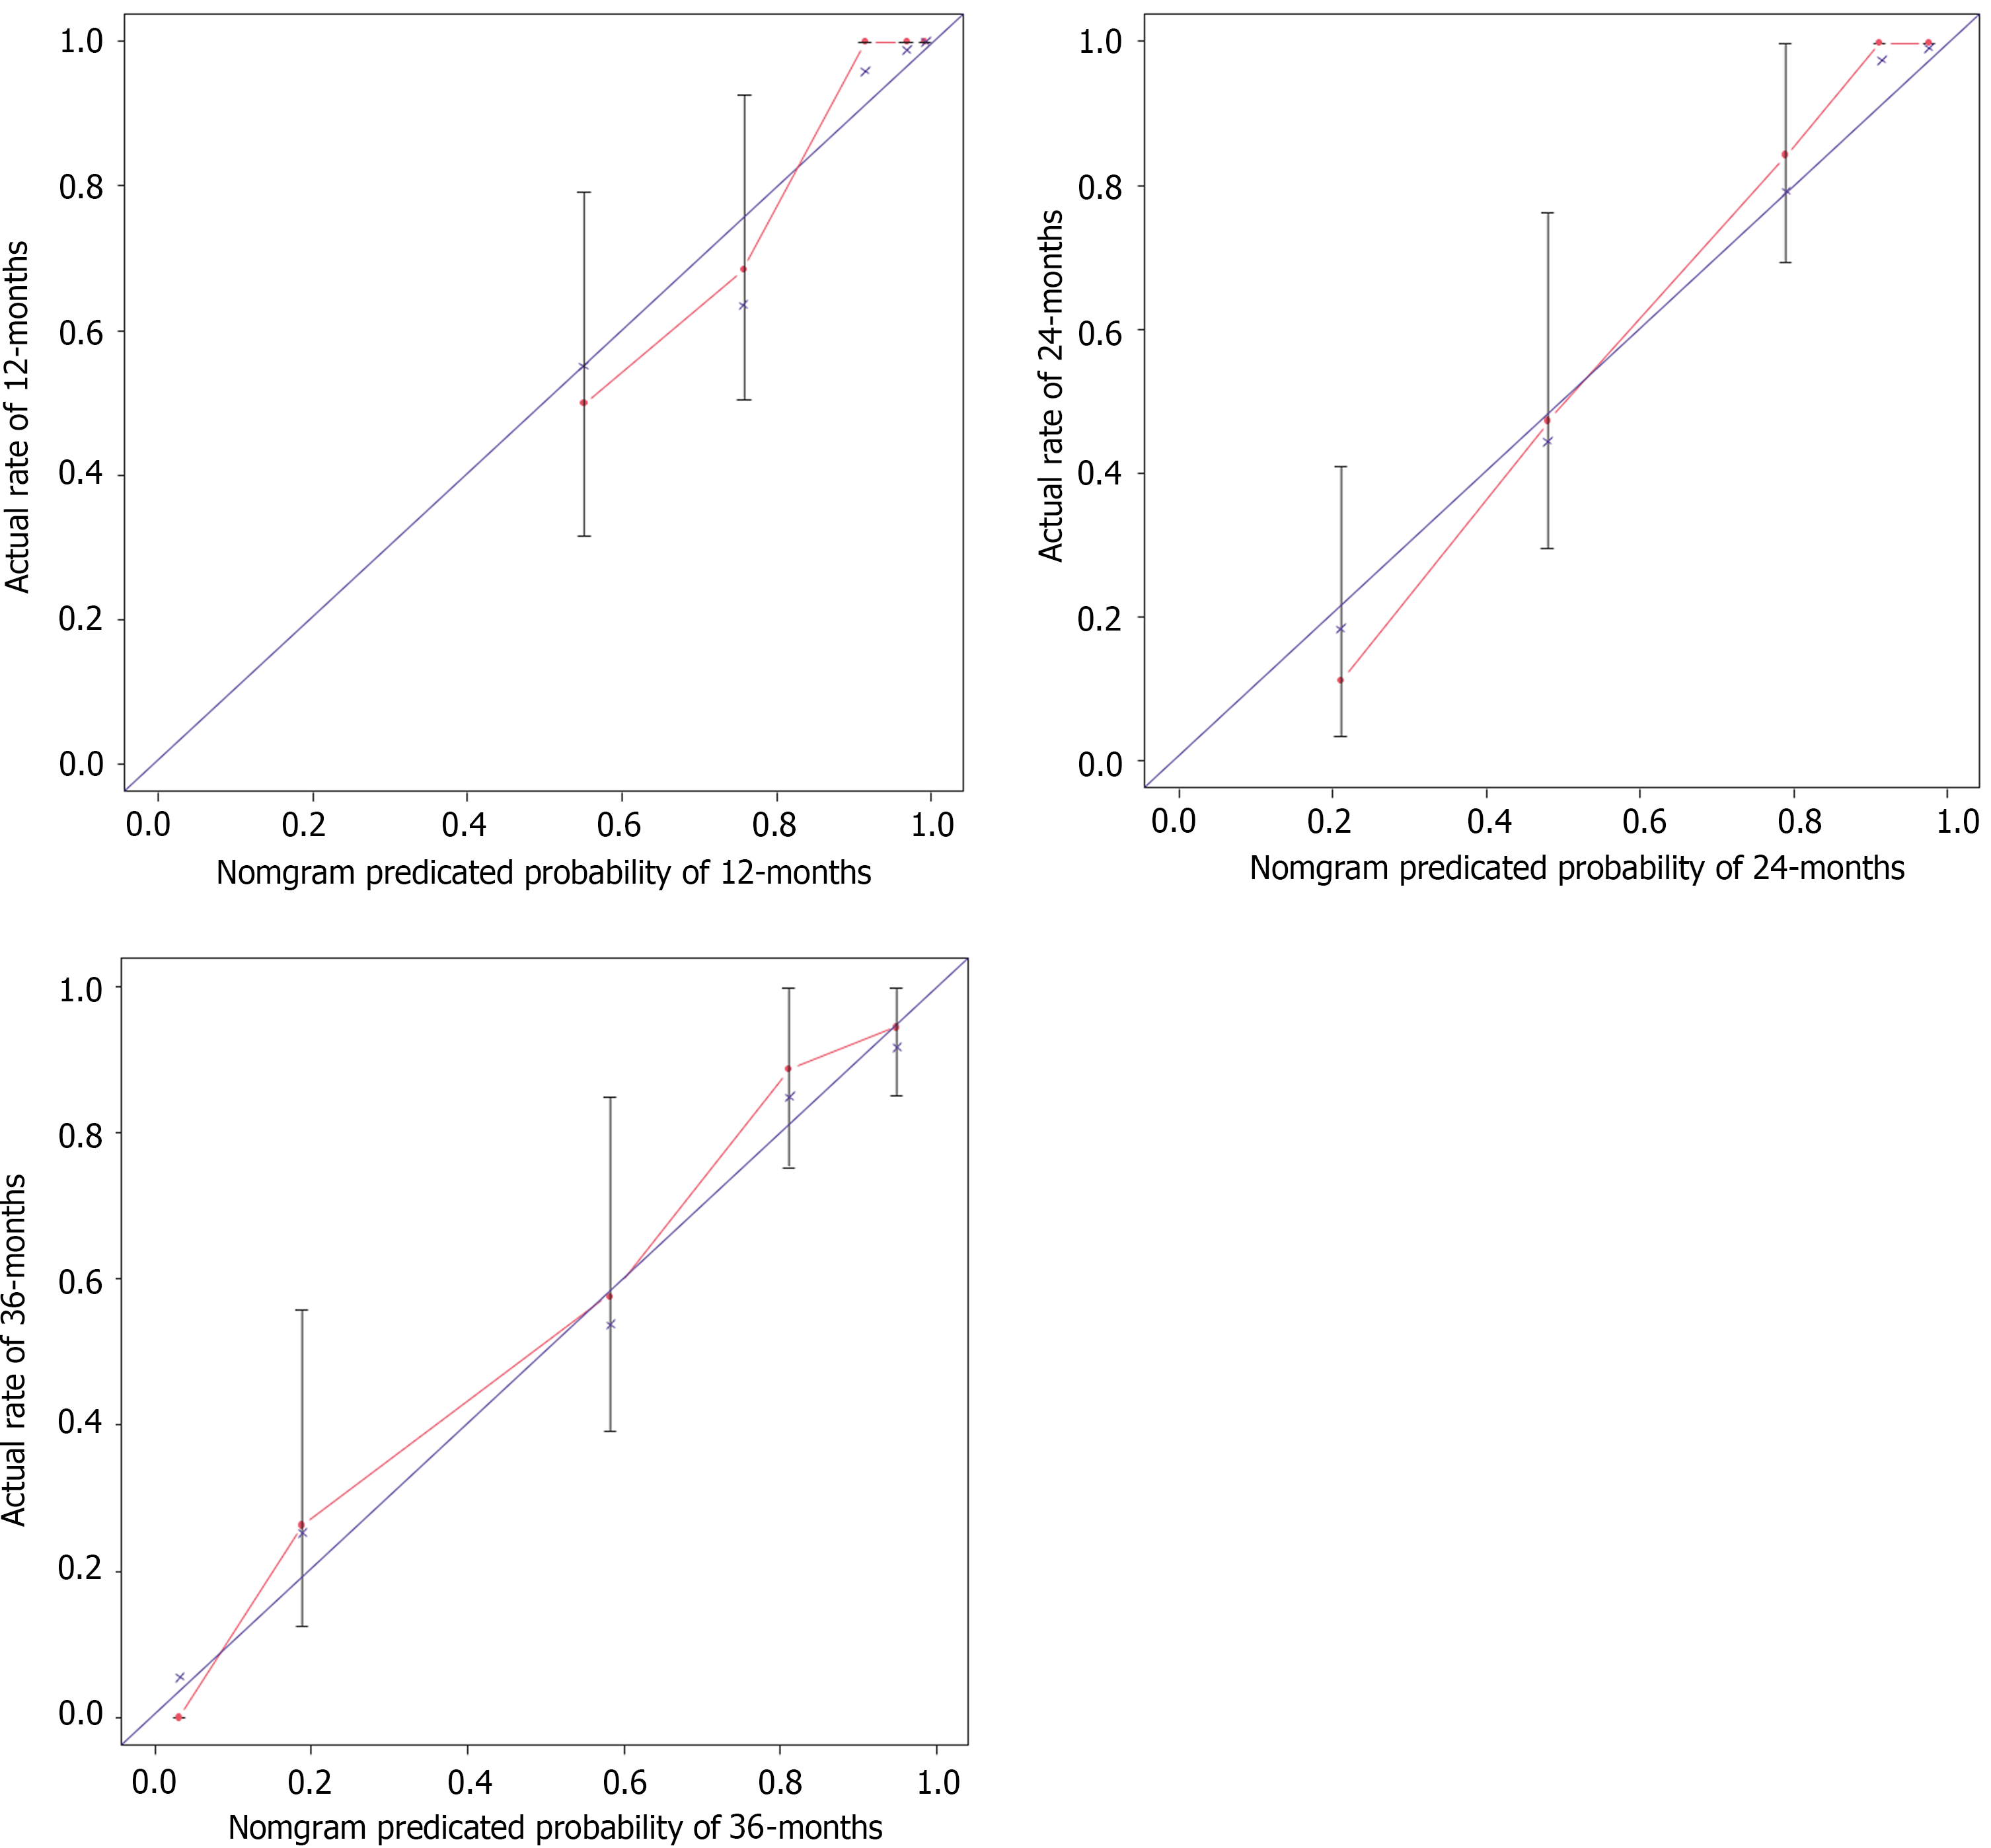
Calibration curves for 1-year, 2-year, and 3-year overall survival in patients following radical resection.
- Citation: Li XF, Ma TT, Li T. Risk factors and survival prediction model establishment for prognosis in patients with radical resection of gallbladder cancer. World J Gastrointest Surg 2024; 16(10): 3239-3252
- URL: https://www.wjgnet.com/1948-9366/full/v16/i10/3239.htm
- DOI: https://dx.doi.org/10.4240/wjgs.v16.i10.3239


