Copyright
©The Author(s) 2024.
World J Gastrointest Surg. Oct 27, 2024; 16(10): 3224-3238
Published online Oct 27, 2024. doi: 10.4240/wjgs.v16.i10.3224
Published online Oct 27, 2024. doi: 10.4240/wjgs.v16.i10.3224
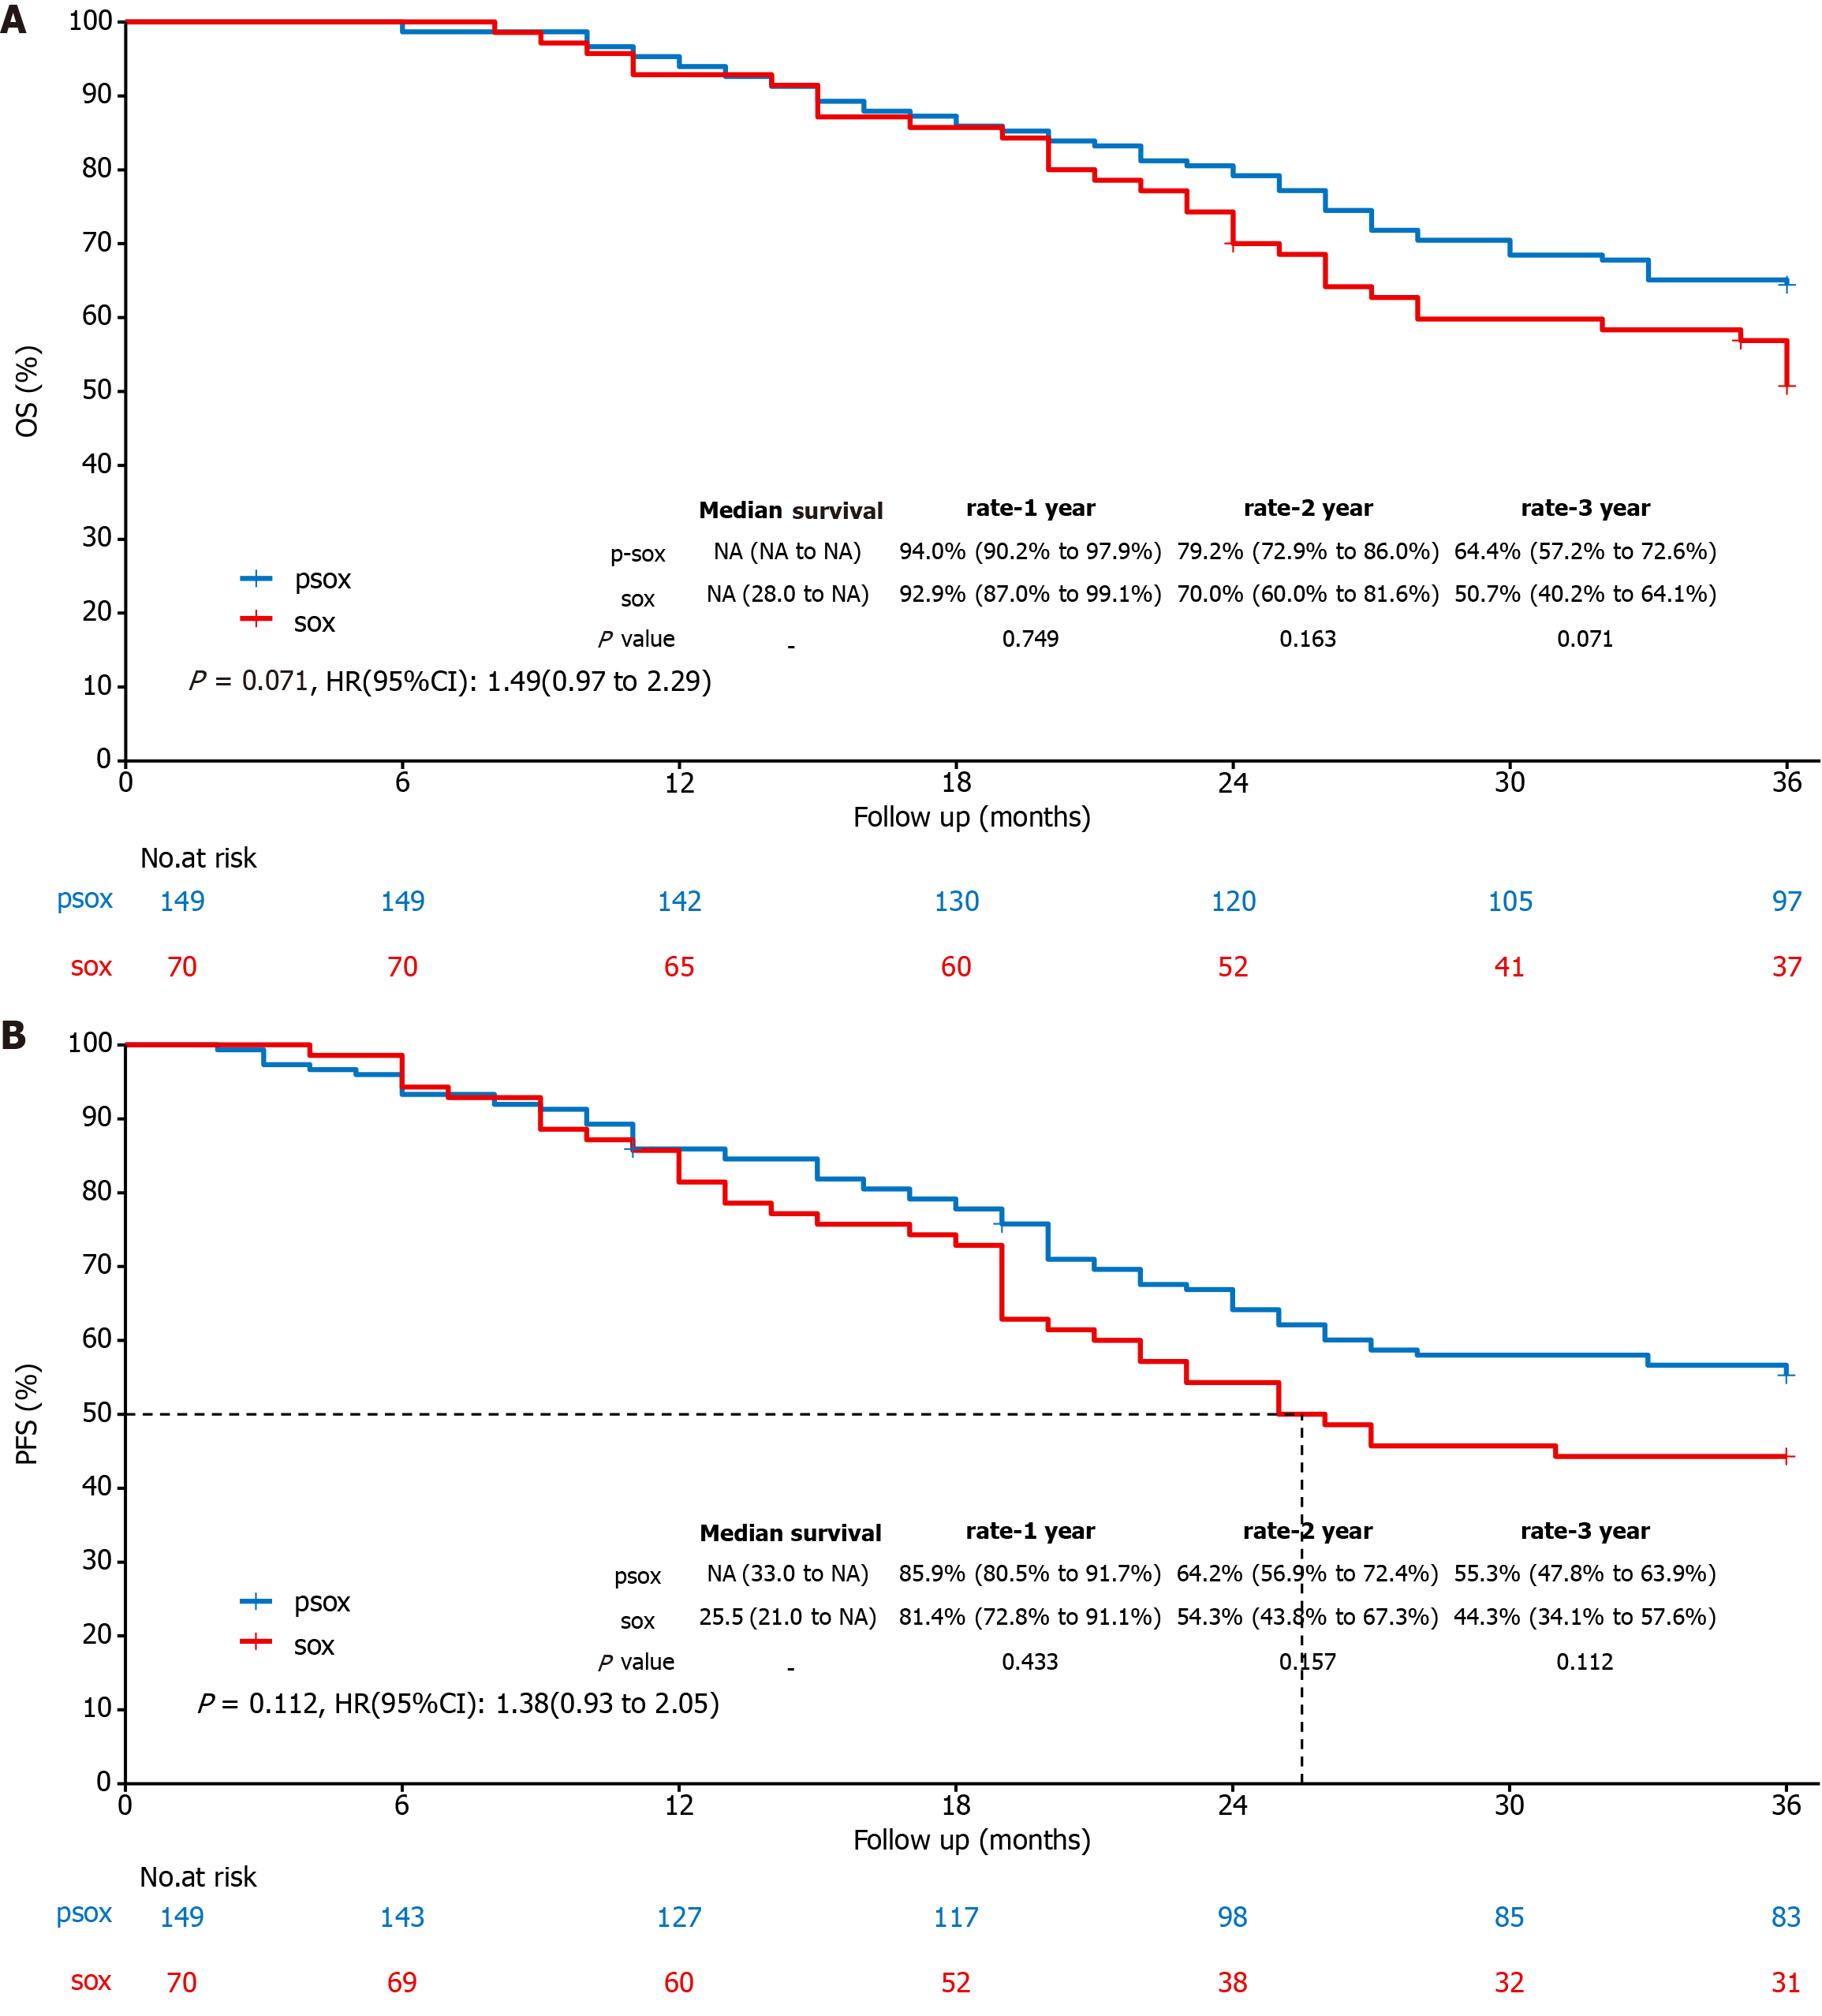
Figure 1 Comparison of overall survival and progression-free survival between the two groups.
A: Overall survival; B: Progression-free survival. P-SOX: Nab-paclitaxel and oxaliplatin + S-1; SOX: Standard S-1 and oxaliplatin; HR: Hazard ratio; PFS: Progression-free survival; OS: Overall survival.
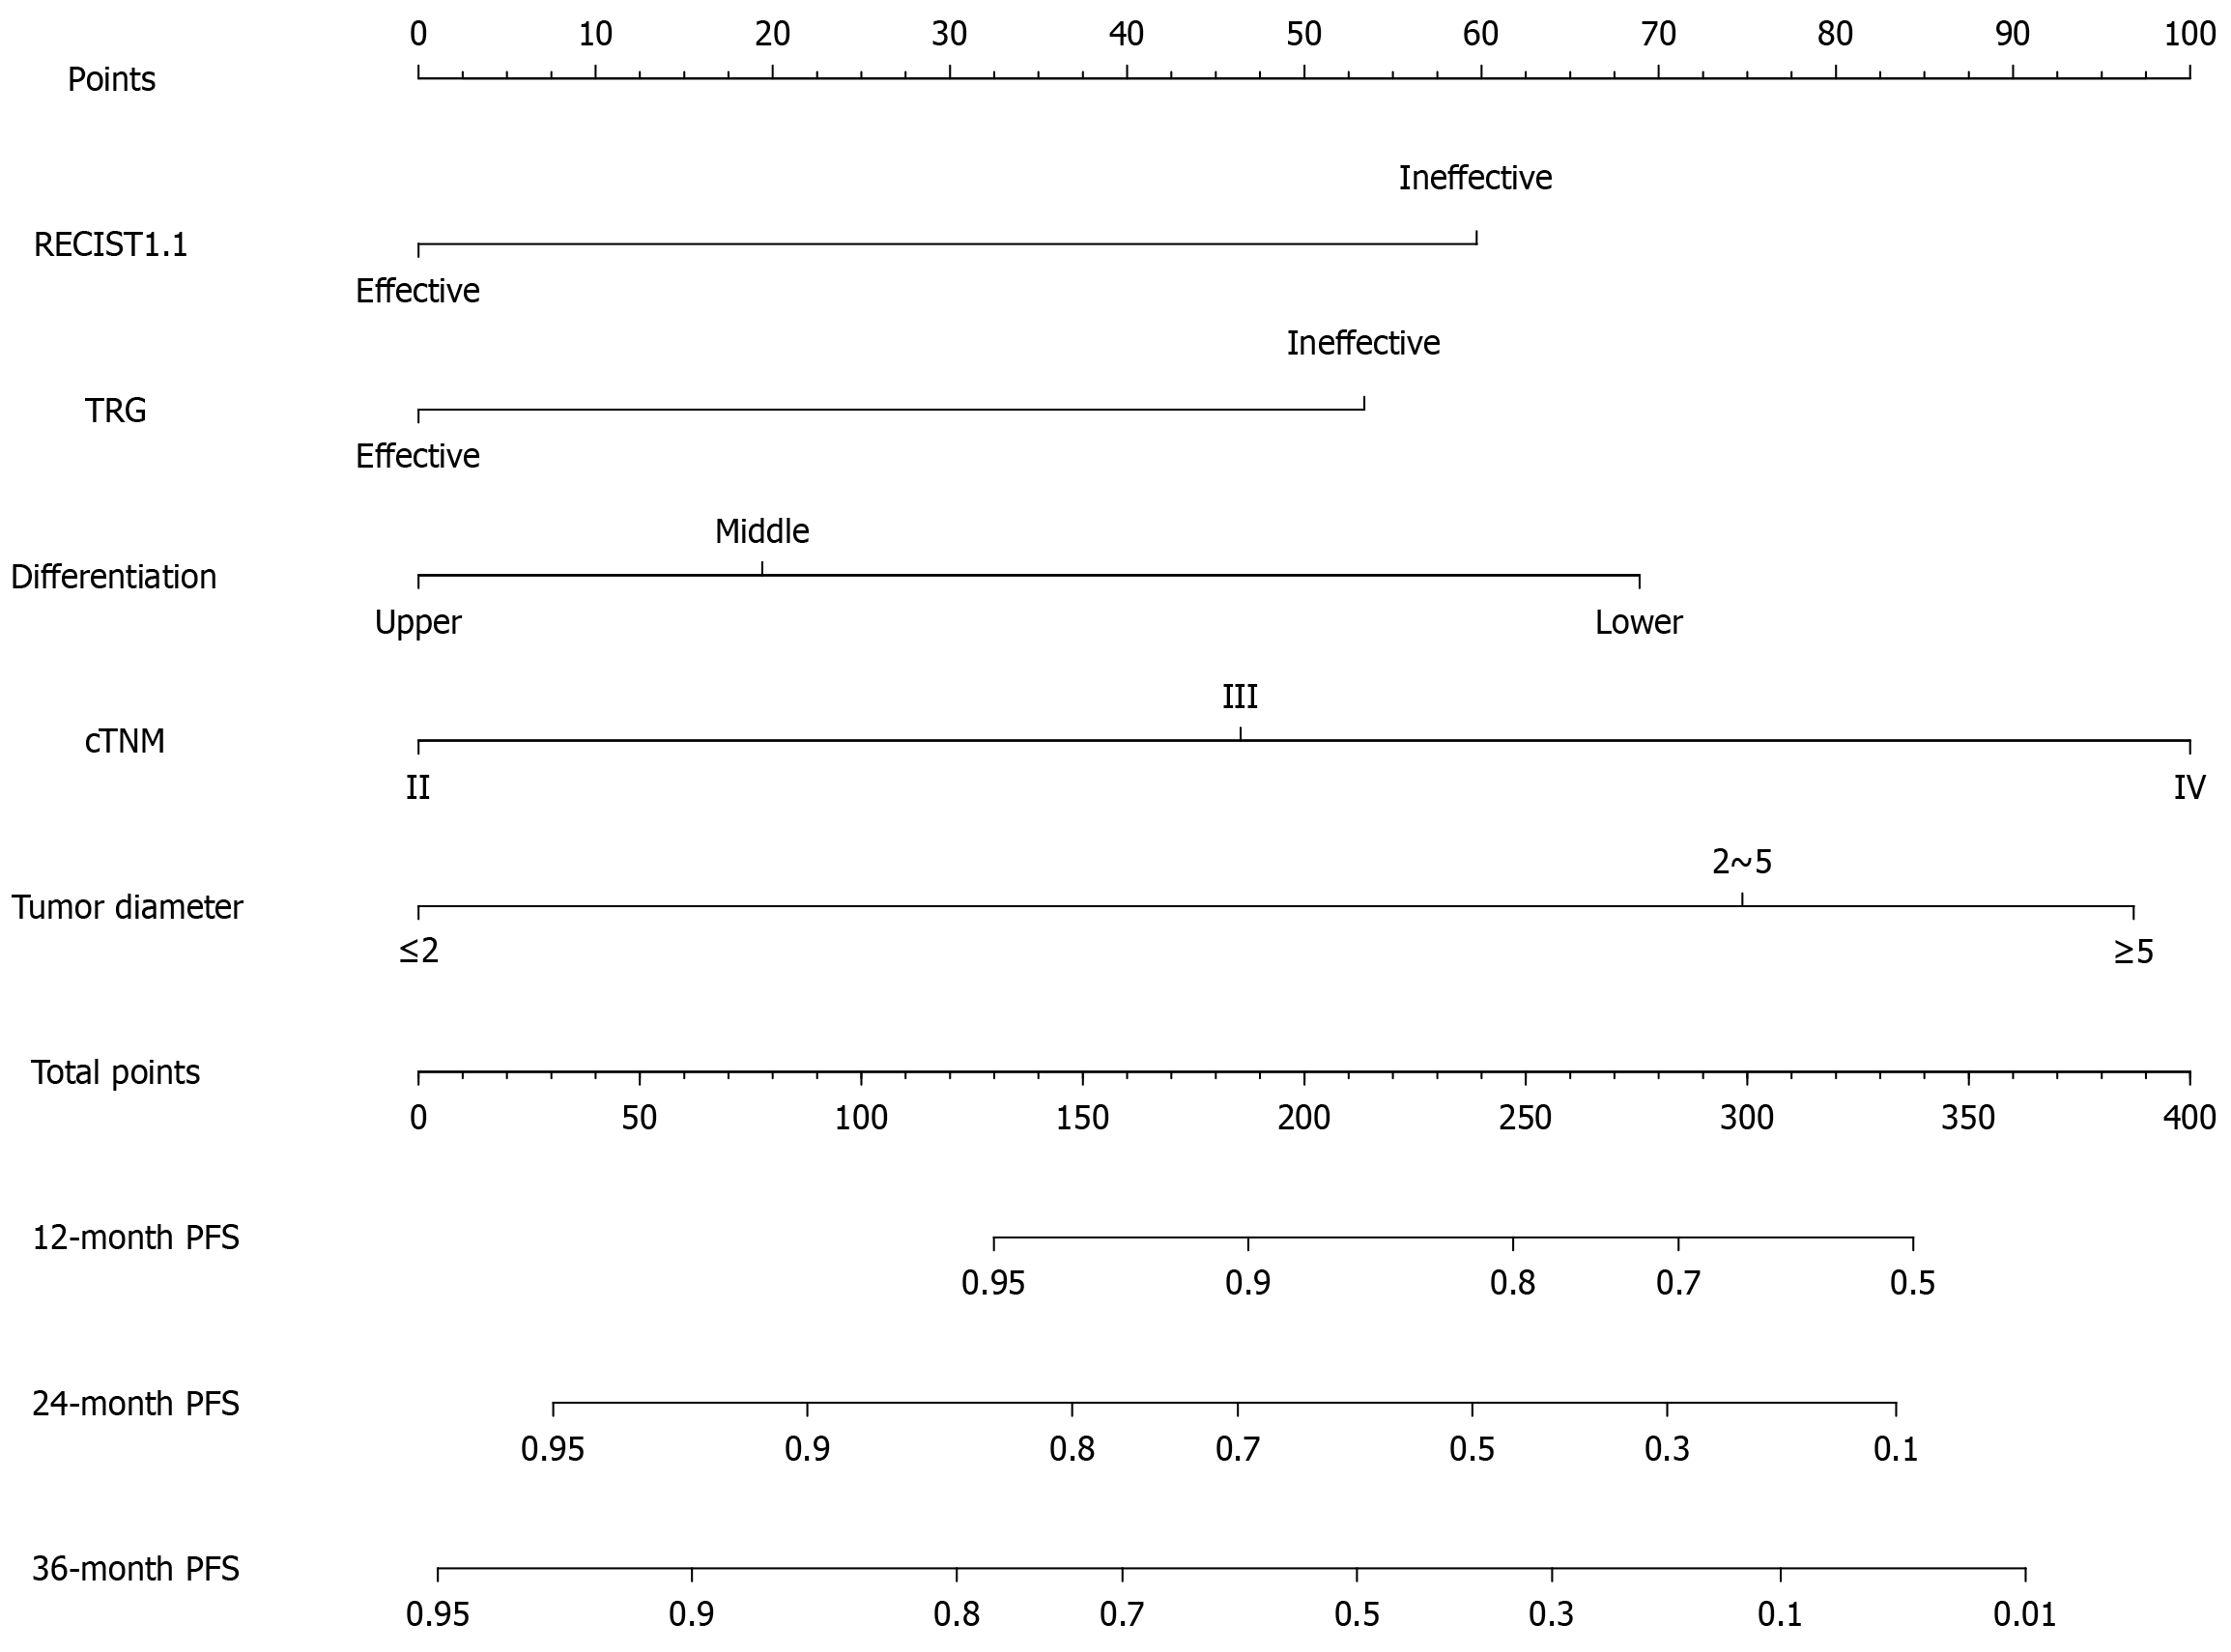
Figure 2 Progression-free survival nomogram (Nab-paclitaxel and oxaliplatin + S-1).
PFS: Progression-free survival; RECIST: Response Evaluation Criteria in Solid Tumors; TRG: Tumor Regression Grade.
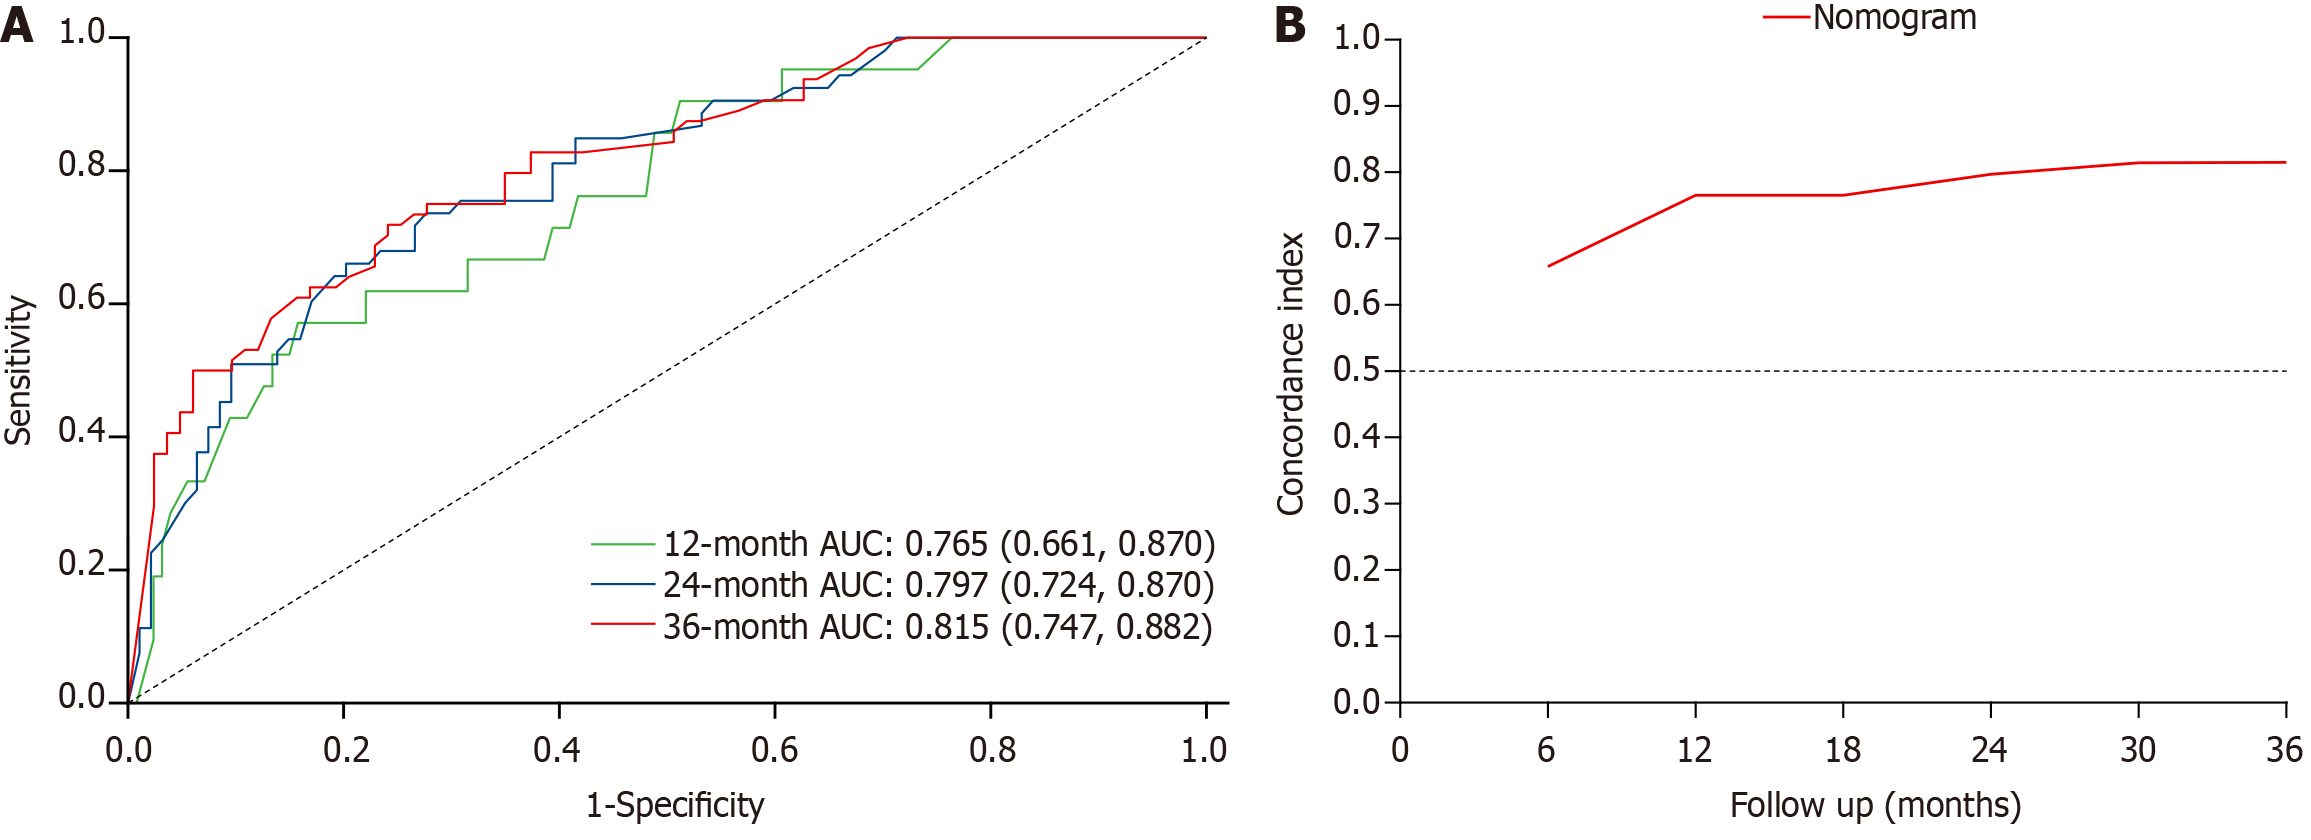
Figure 3 Progression-free survival receiver operating characteristic curve.
A: Sensitivity; B: Concordance index. AUC: The area under the operating characteristic curve.
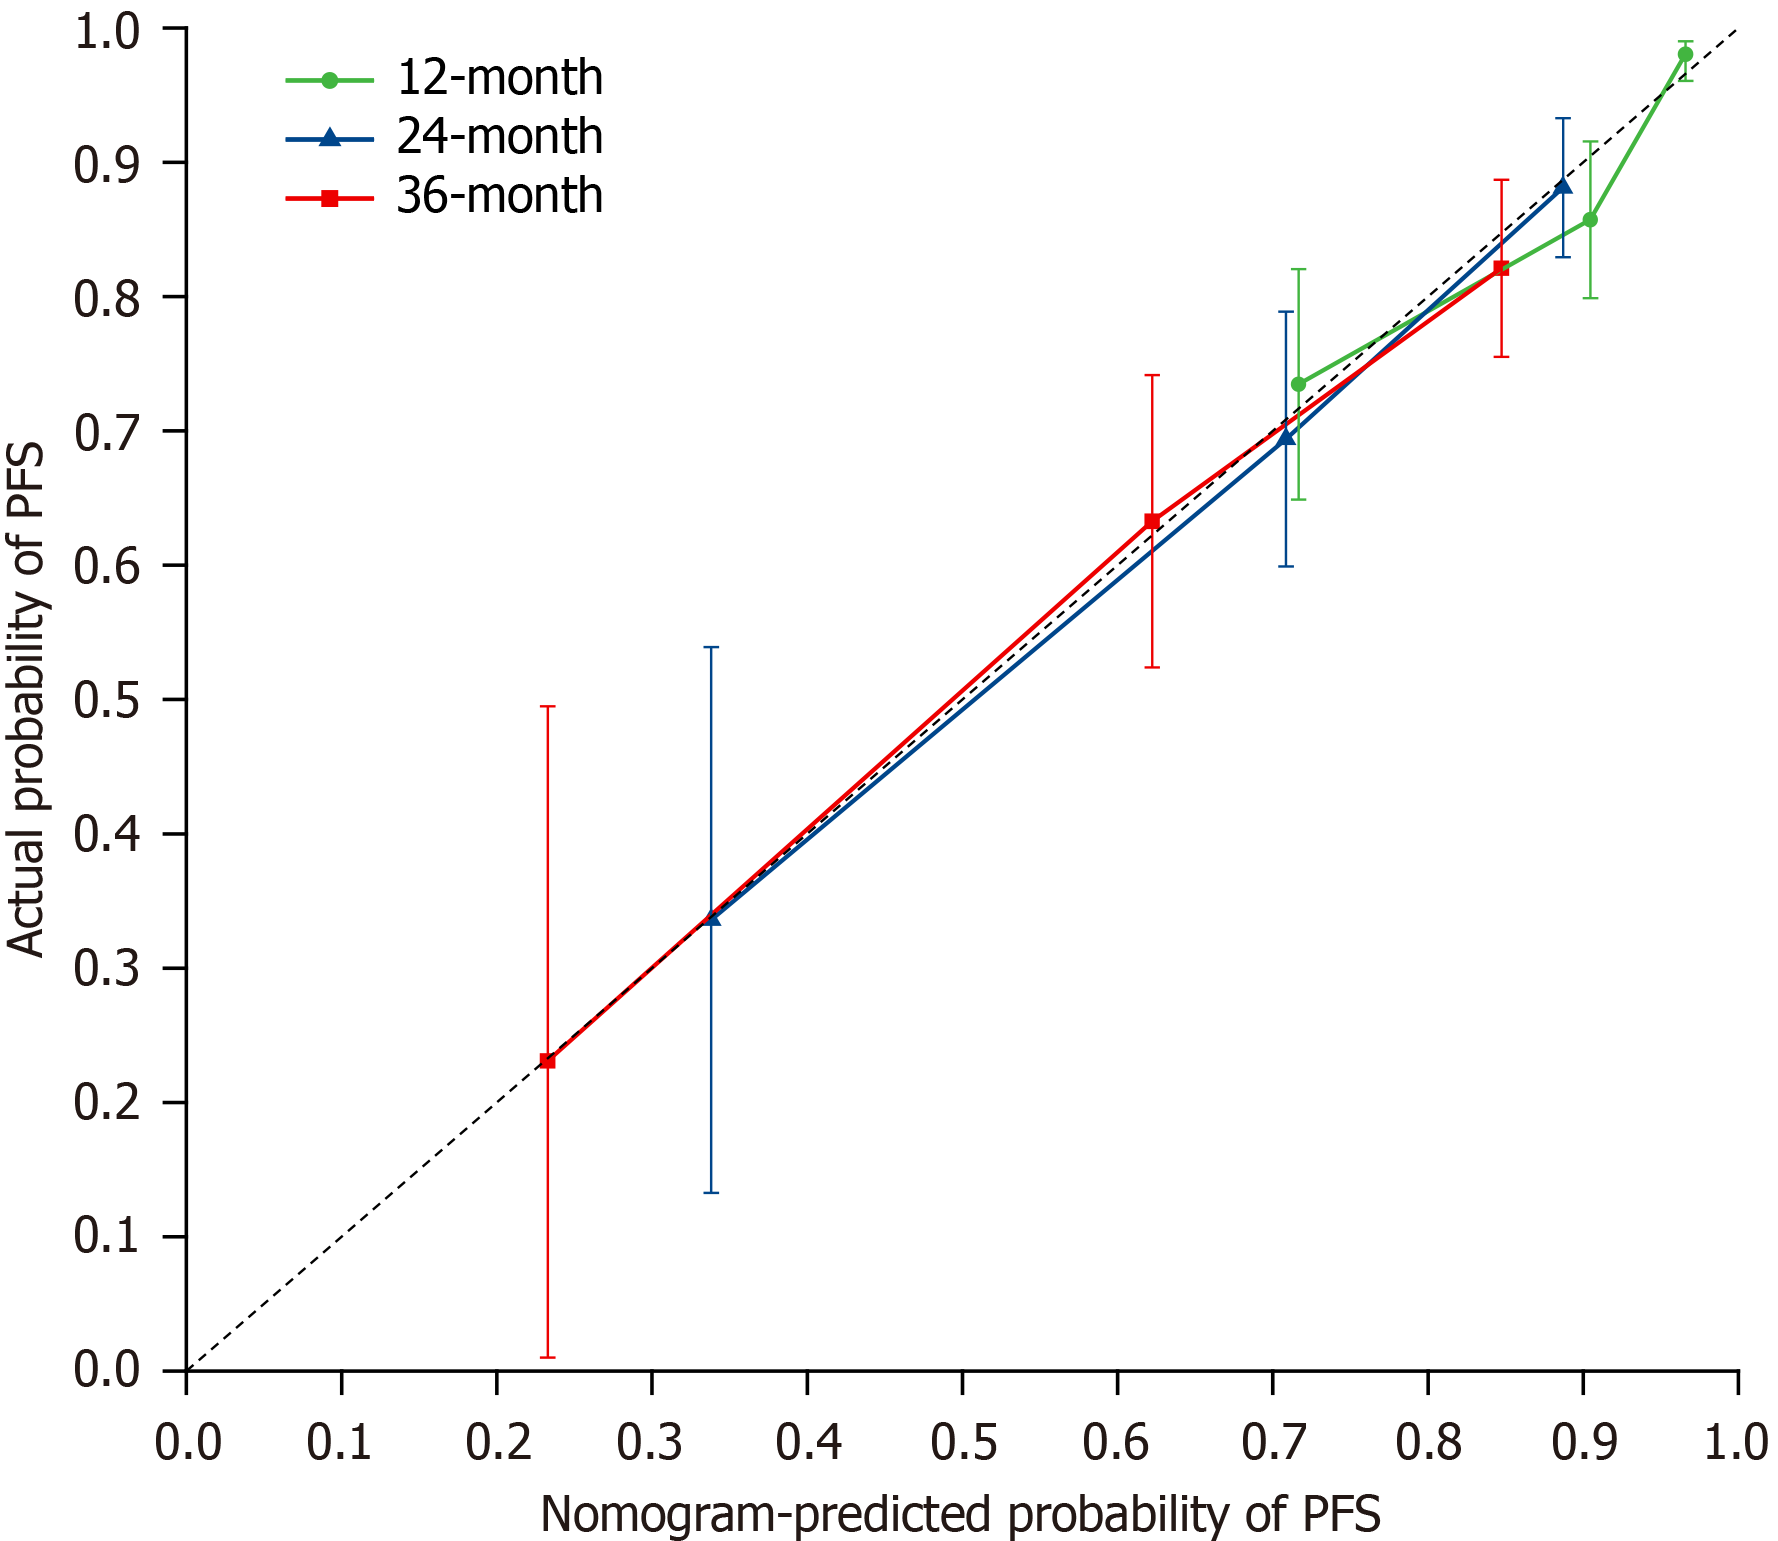
Figure 4 Calibration curve for progression-free survival.
PFS: Progression-free survival.
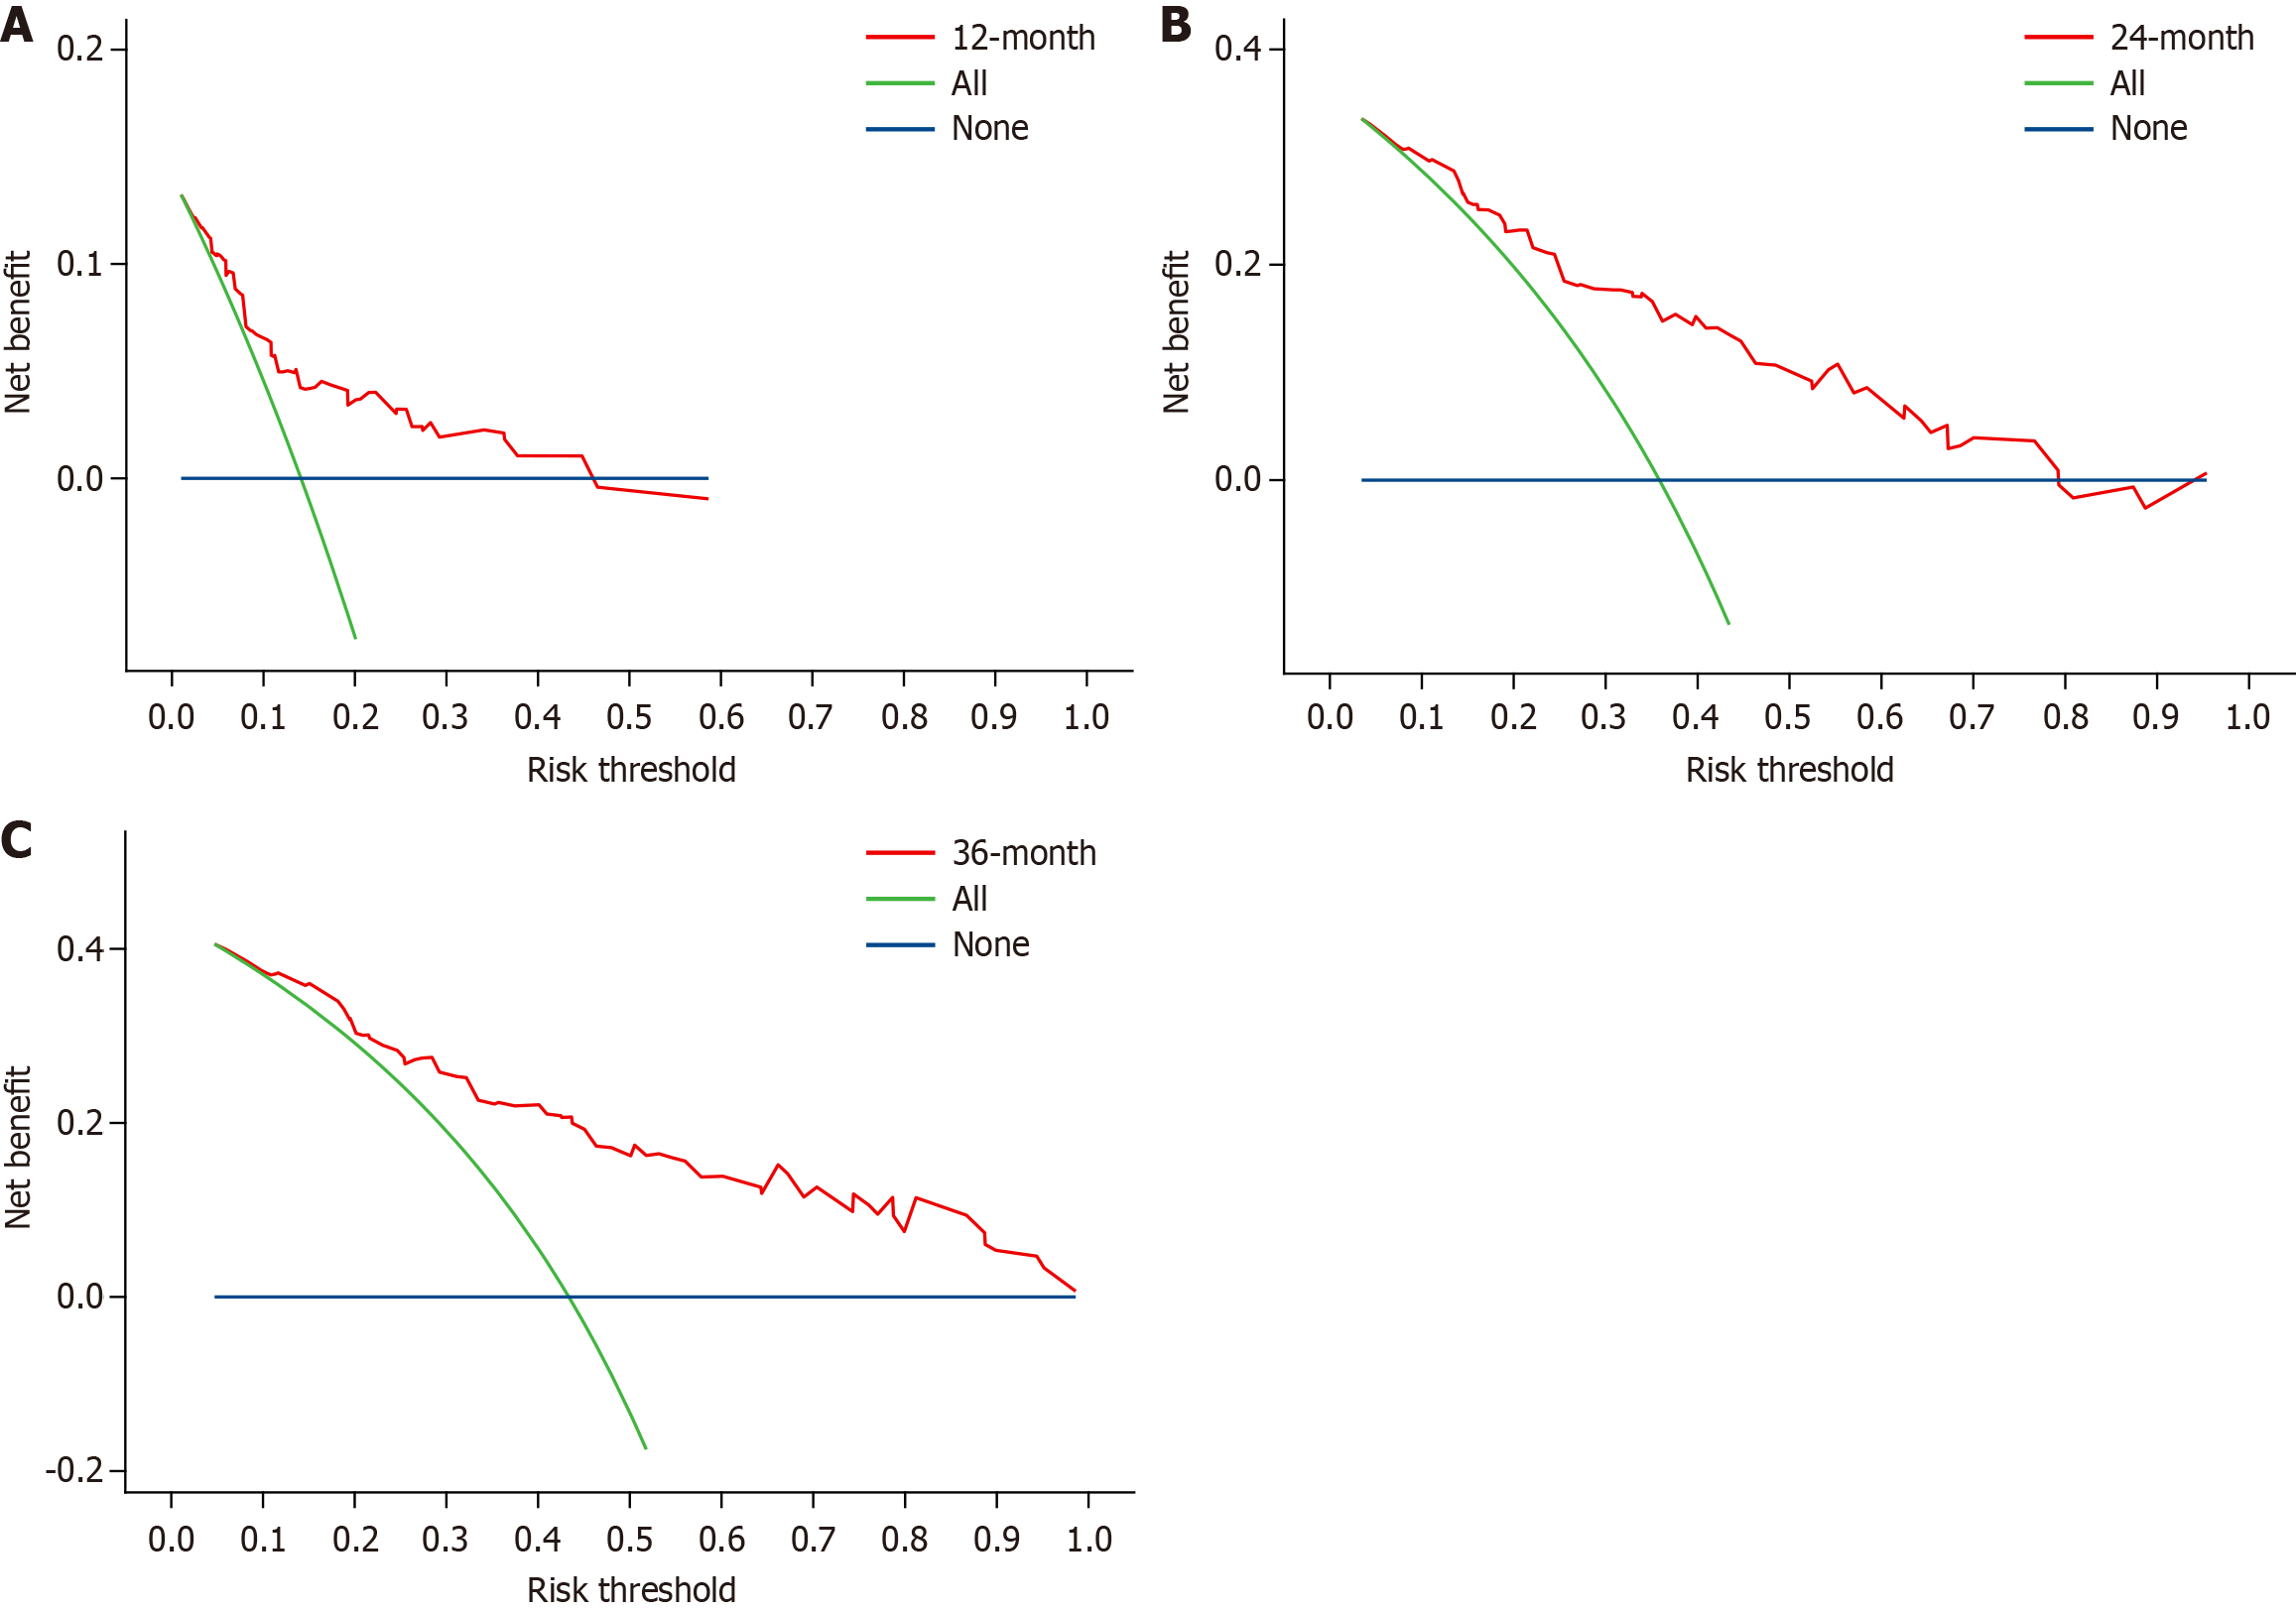
Figure 5 Decision curve analysis curves of progression-free survival.
A: 1 year; B: 2 years; C: 3 years.
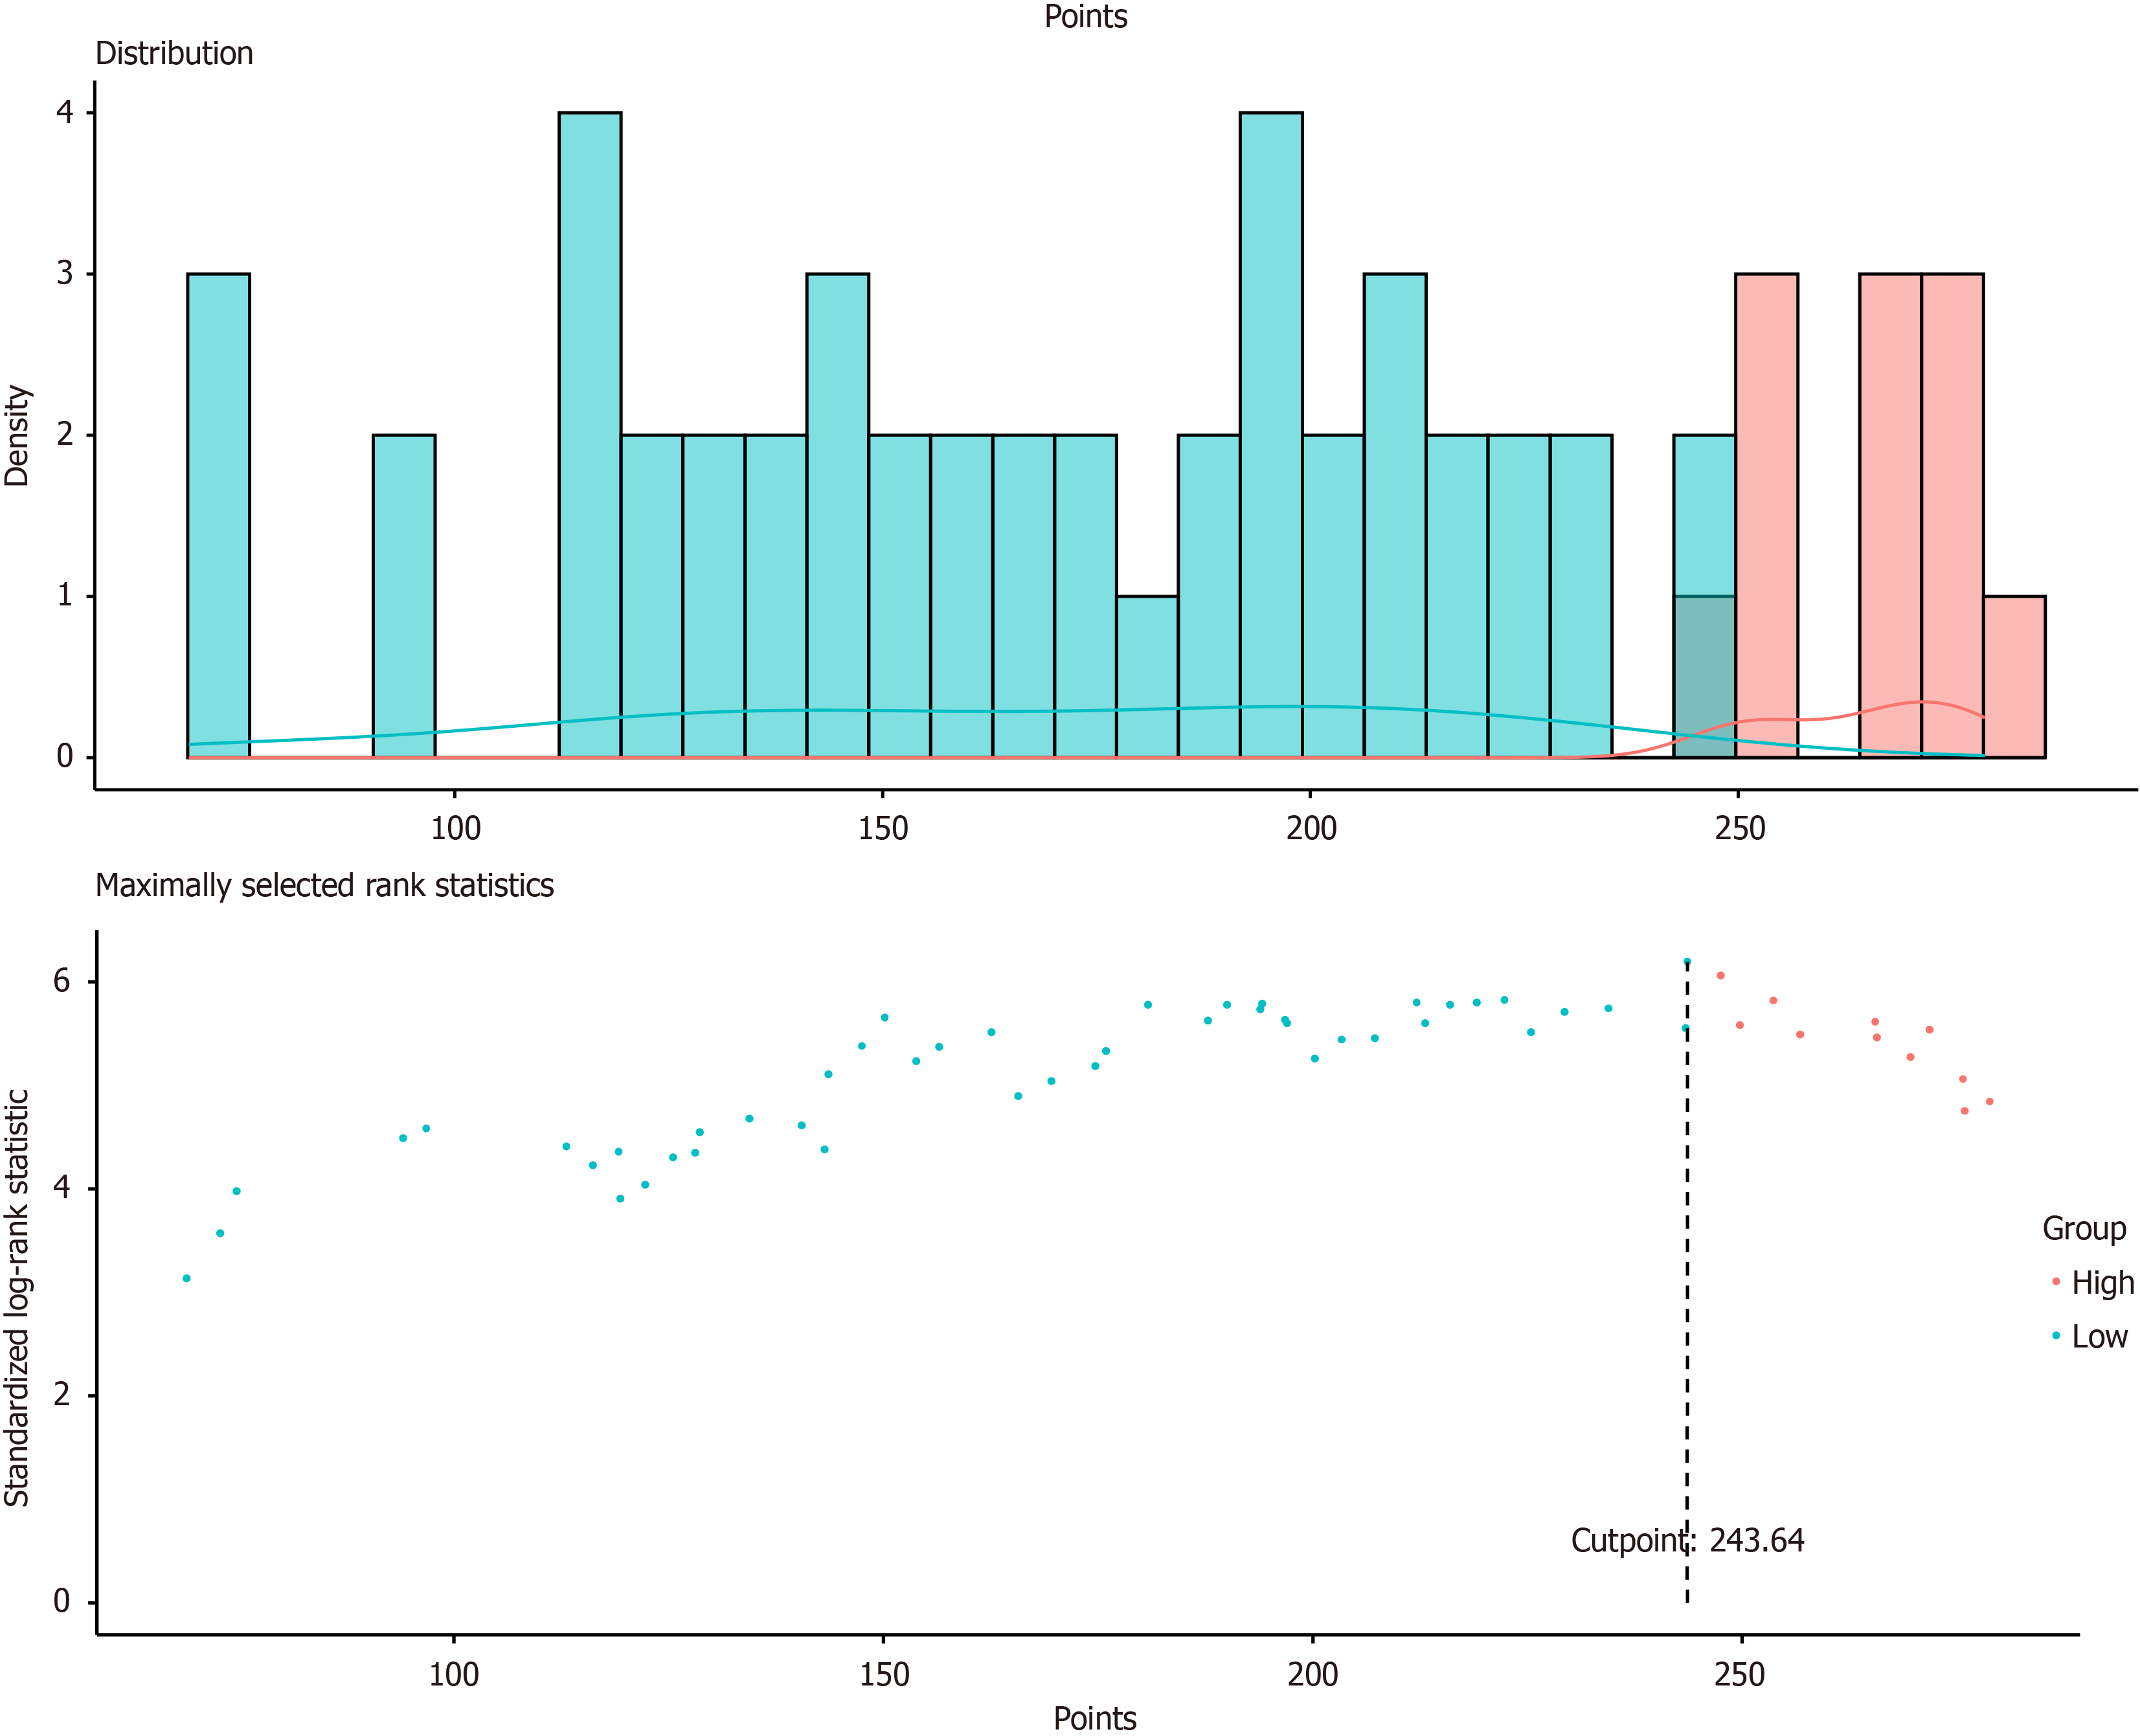
Figure 6
Kaplan-Meier survival curves for the verification of risk stratification.
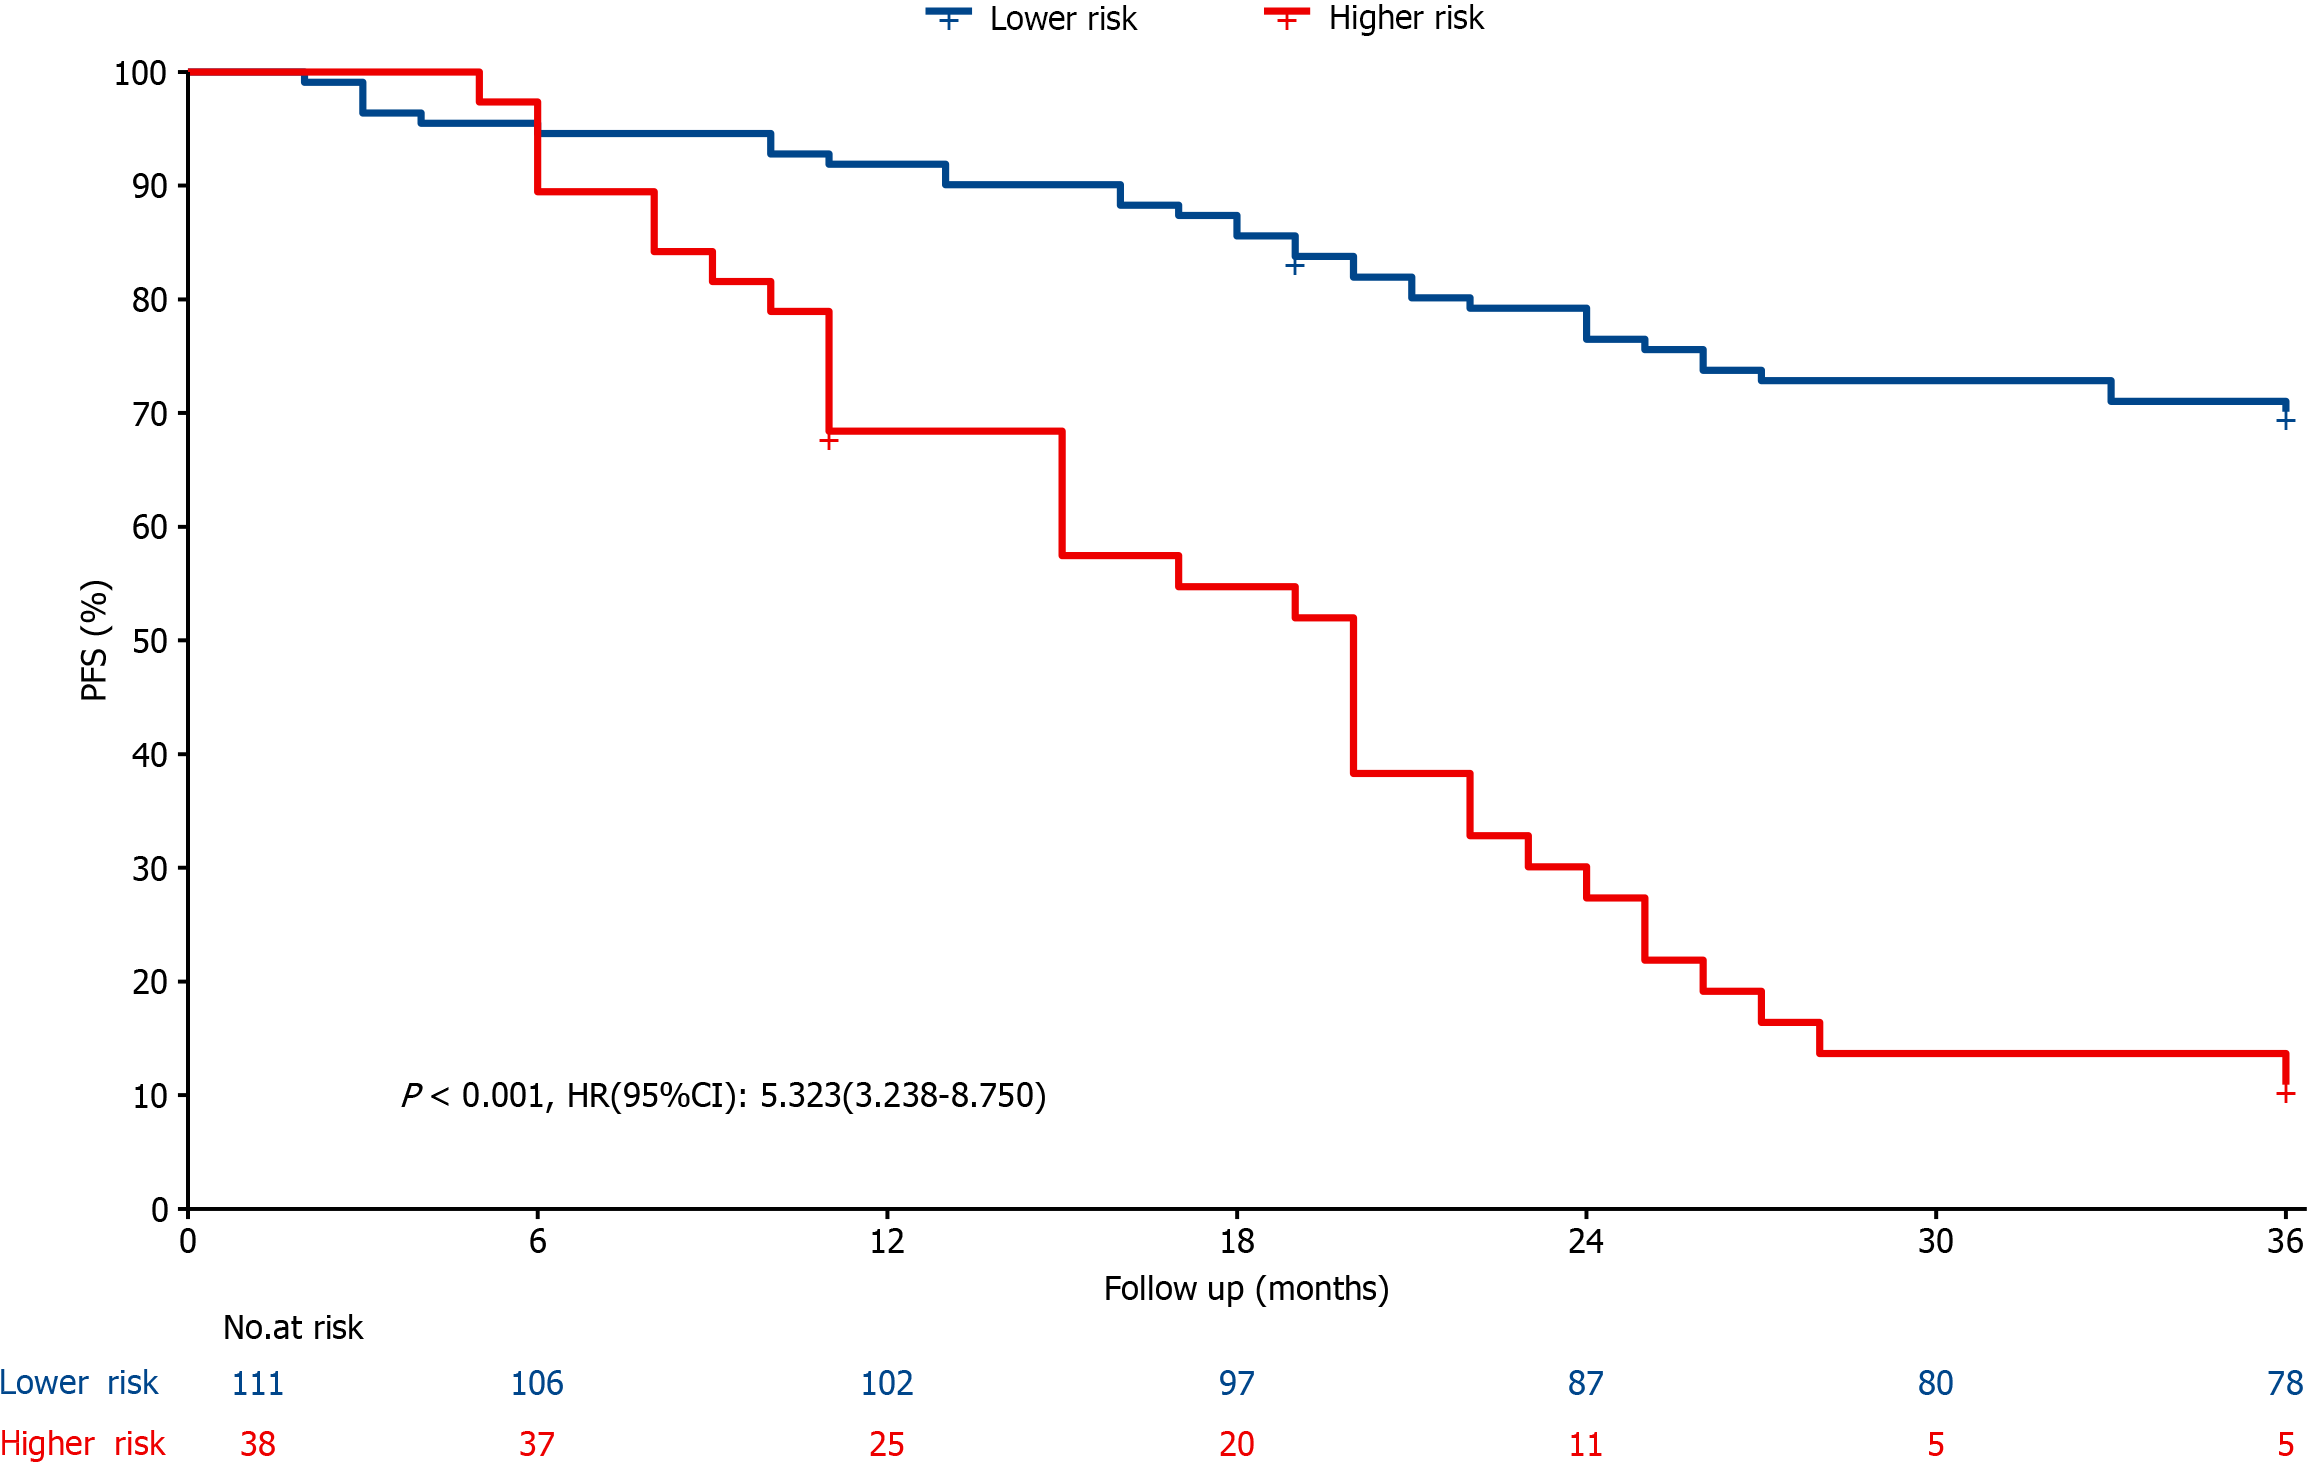
Figure 7 Kaplan-Meier survival curves for the verification of risk stratification.
PFS: Progression-free survival; HR: Hazard ratio.
- Citation: Wang YC, Feng L, Wang GP, Yu PJ, Guo C, Cai BJ, Song Y, Pan T, Lin BH, Li YD, Xiao JJ. Comparison of efficacy and safety of nab-paclitaxel and oxaliplatin + S-1 and standard S-1 and oxaliplatin chemotherapy regimens for treatment of gastric cancer. World J Gastrointest Surg 2024; 16(10): 3224-3238
- URL: https://www.wjgnet.com/1948-9366/full/v16/i10/3224.htm
- DOI: https://dx.doi.org/10.4240/wjgs.v16.i10.3224


