Copyright
©The Author(s) 2024.
World J Gastrointest Surg. Oct 27, 2024; 16(10): 3211-3223
Published online Oct 27, 2024. doi: 10.4240/wjgs.v16.i10.3211
Published online Oct 27, 2024. doi: 10.4240/wjgs.v16.i10.3211
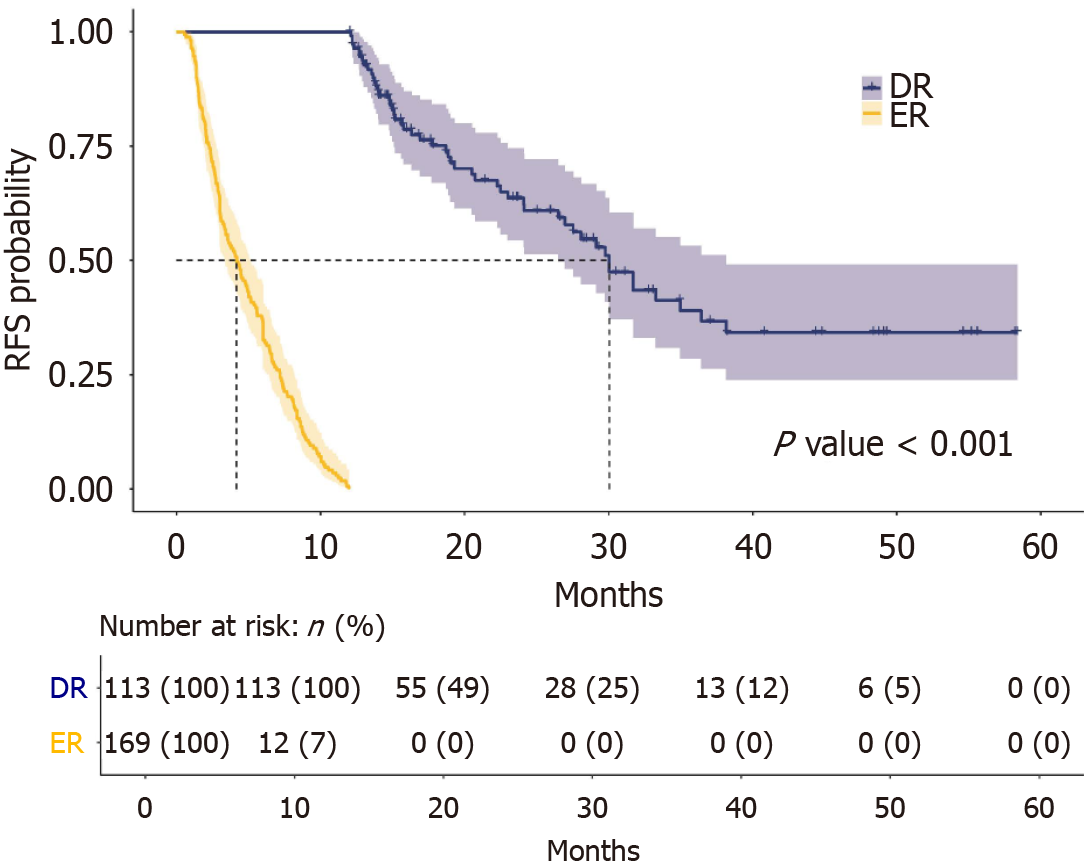
Figure 1 Kaplan-Meier survival plot analysis of recurrence free survivals in early recurrence and delayed recurrence group.
Patients with early recurrence had significantly poorer recurrence free survival than those with delayed recurrence. RFS: Recurrence free survival; ER: Early recurrence; DR: Delayed recurrence.
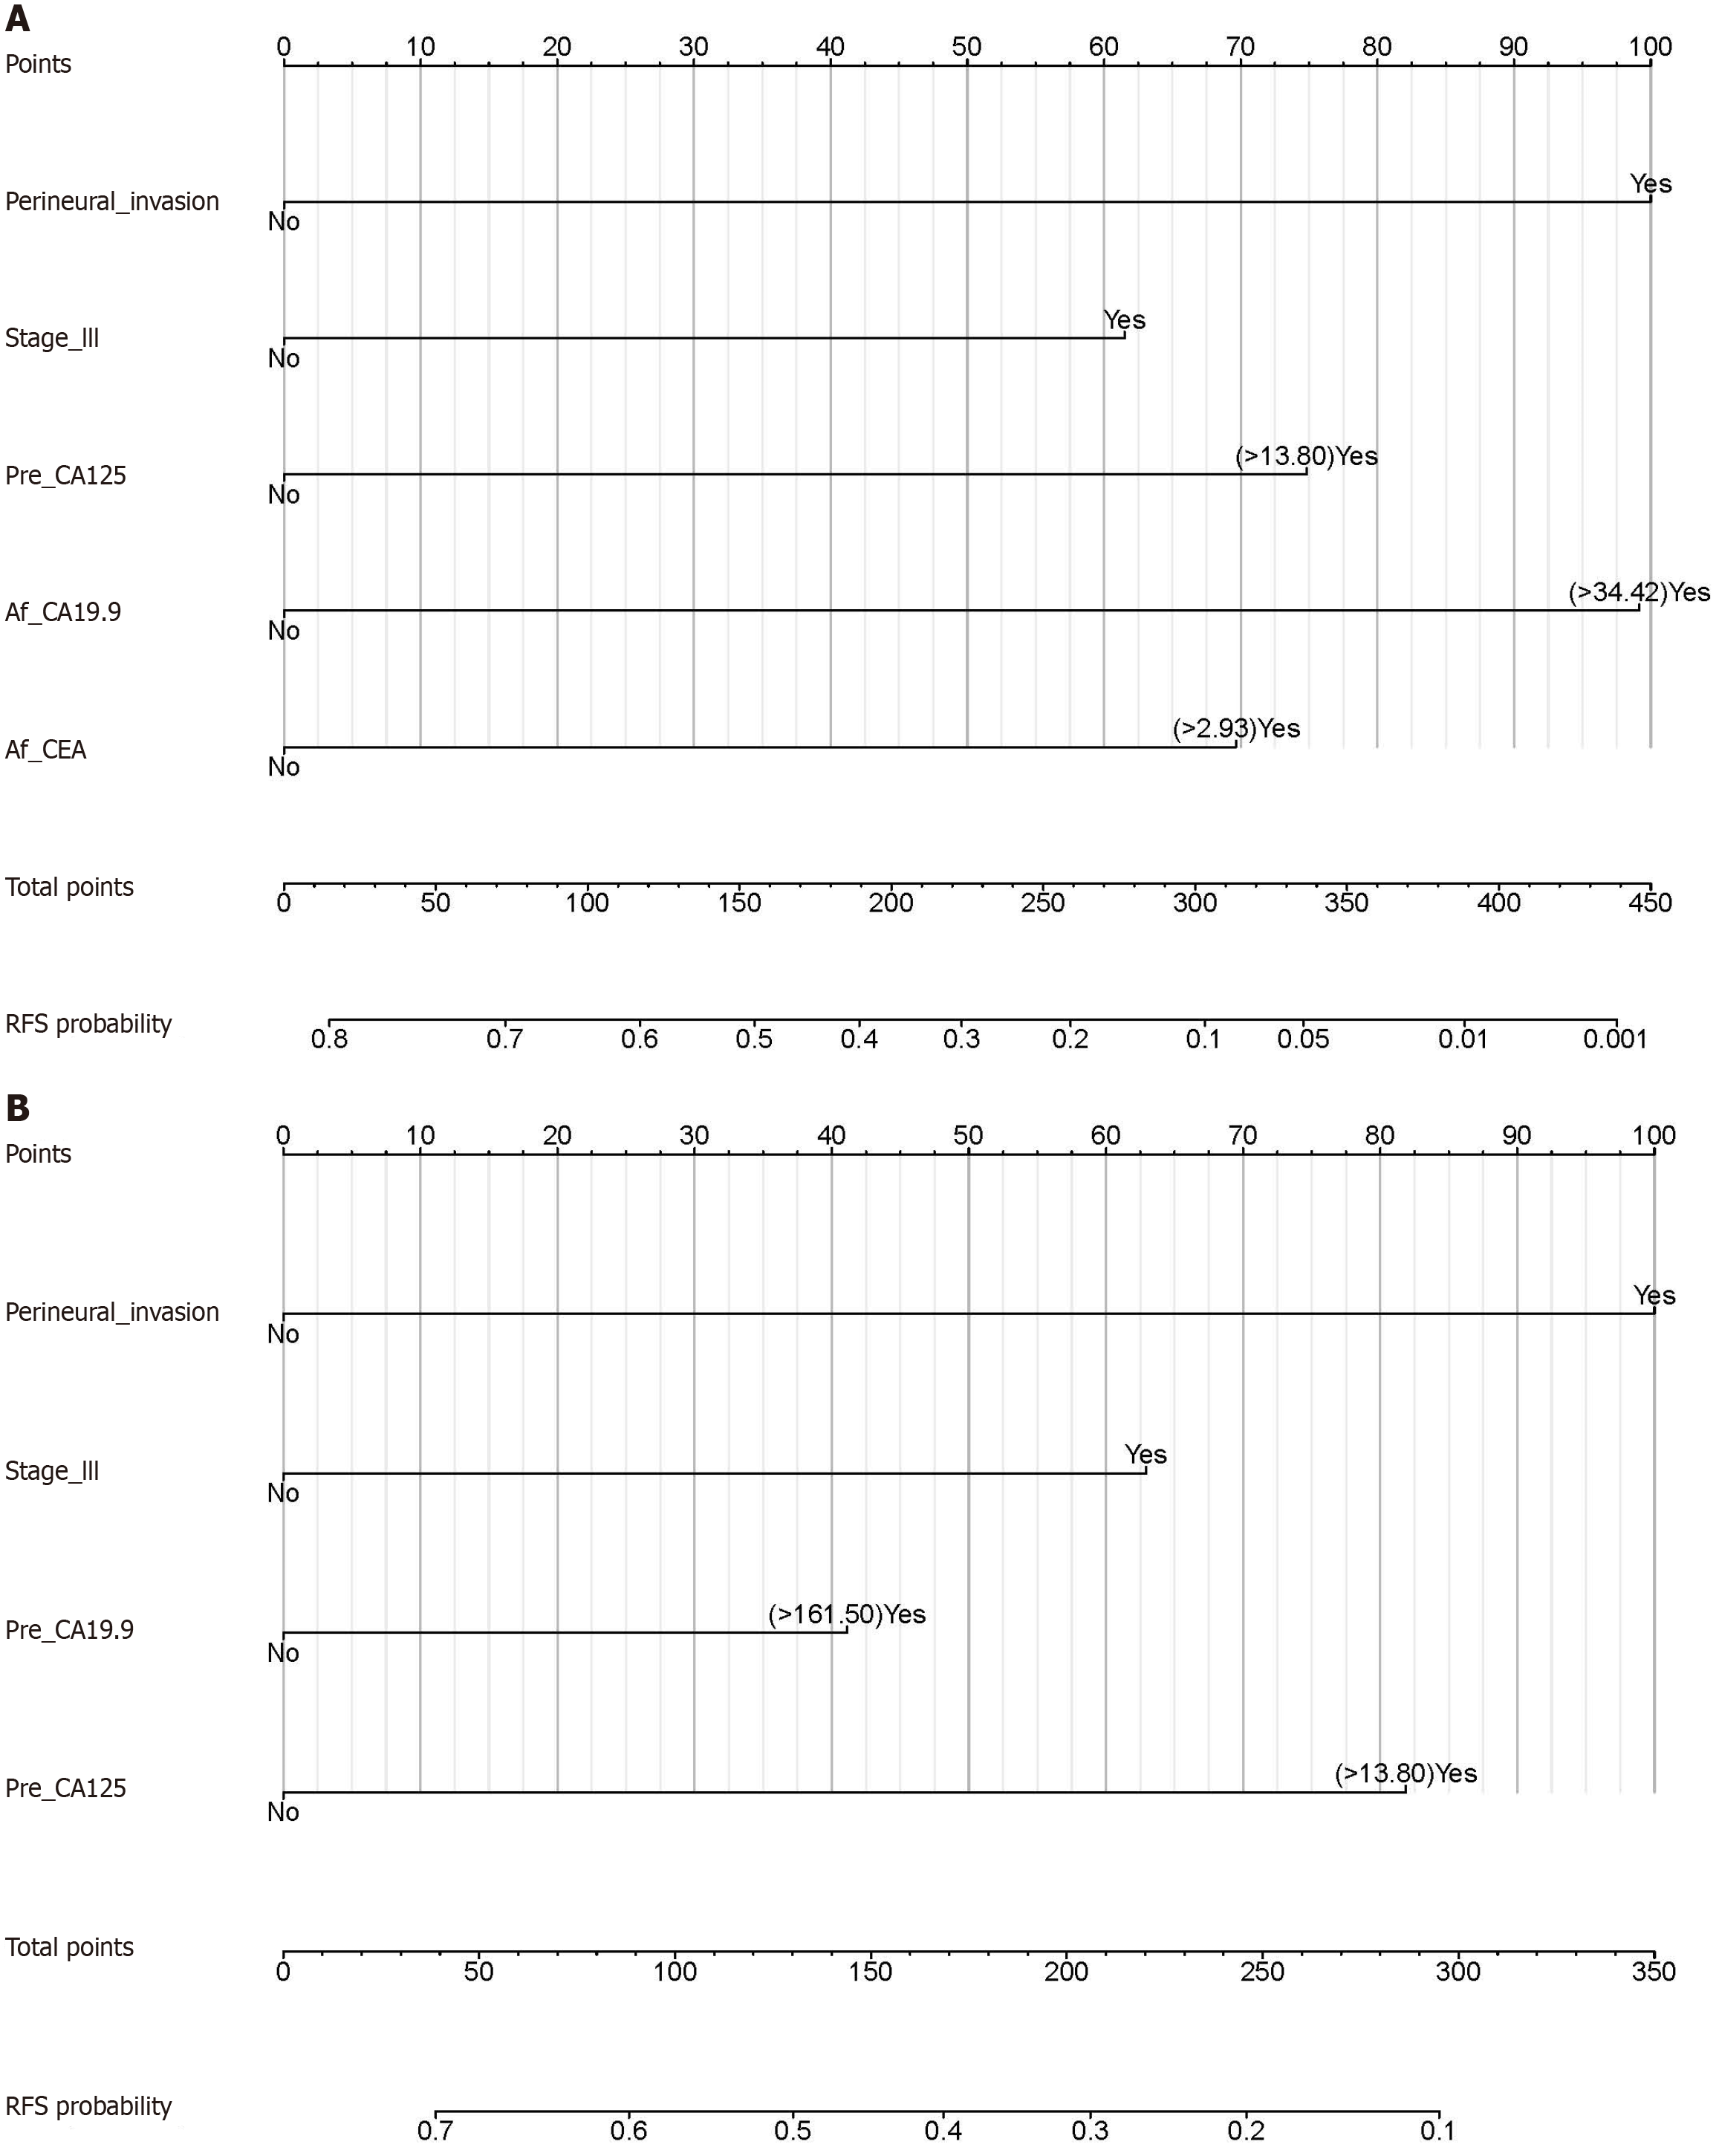
Figure 2 Nomograms based on independent risk factors for early recurrence.
A: Postoperative serum tumor markers (STMs)-based nomogram for predicting early recurrence (ER). This nomogram consisted of five independent risk factors, including perineural invasion, pTNM stage III, preoperative serum carbohydrate antigen 125 (CA125) (> 13.80 U/mL), postoperative serum carbohydrate antigen 19-9 (CA19-9) (> 34.42 U/mL), and postoperative serum carcinoembryonic antigen (> 2.93 ng/mL); B: Nomogram without postoperative STMs for predicting ER. This nomogram consisted of four independent risk factors, including perineural invasion, pTNM stage III, preoperative serum CA19-9 (> 161.50 U/mL), and preoperative serum CA125 (> 13.80 U/mL). CA125: Carbohydrate antigen 125; CA19-9: Carbohydrate antigen 19-9; CEA: Carcinoembryonic antigen; RFS: Recurrence free survival.
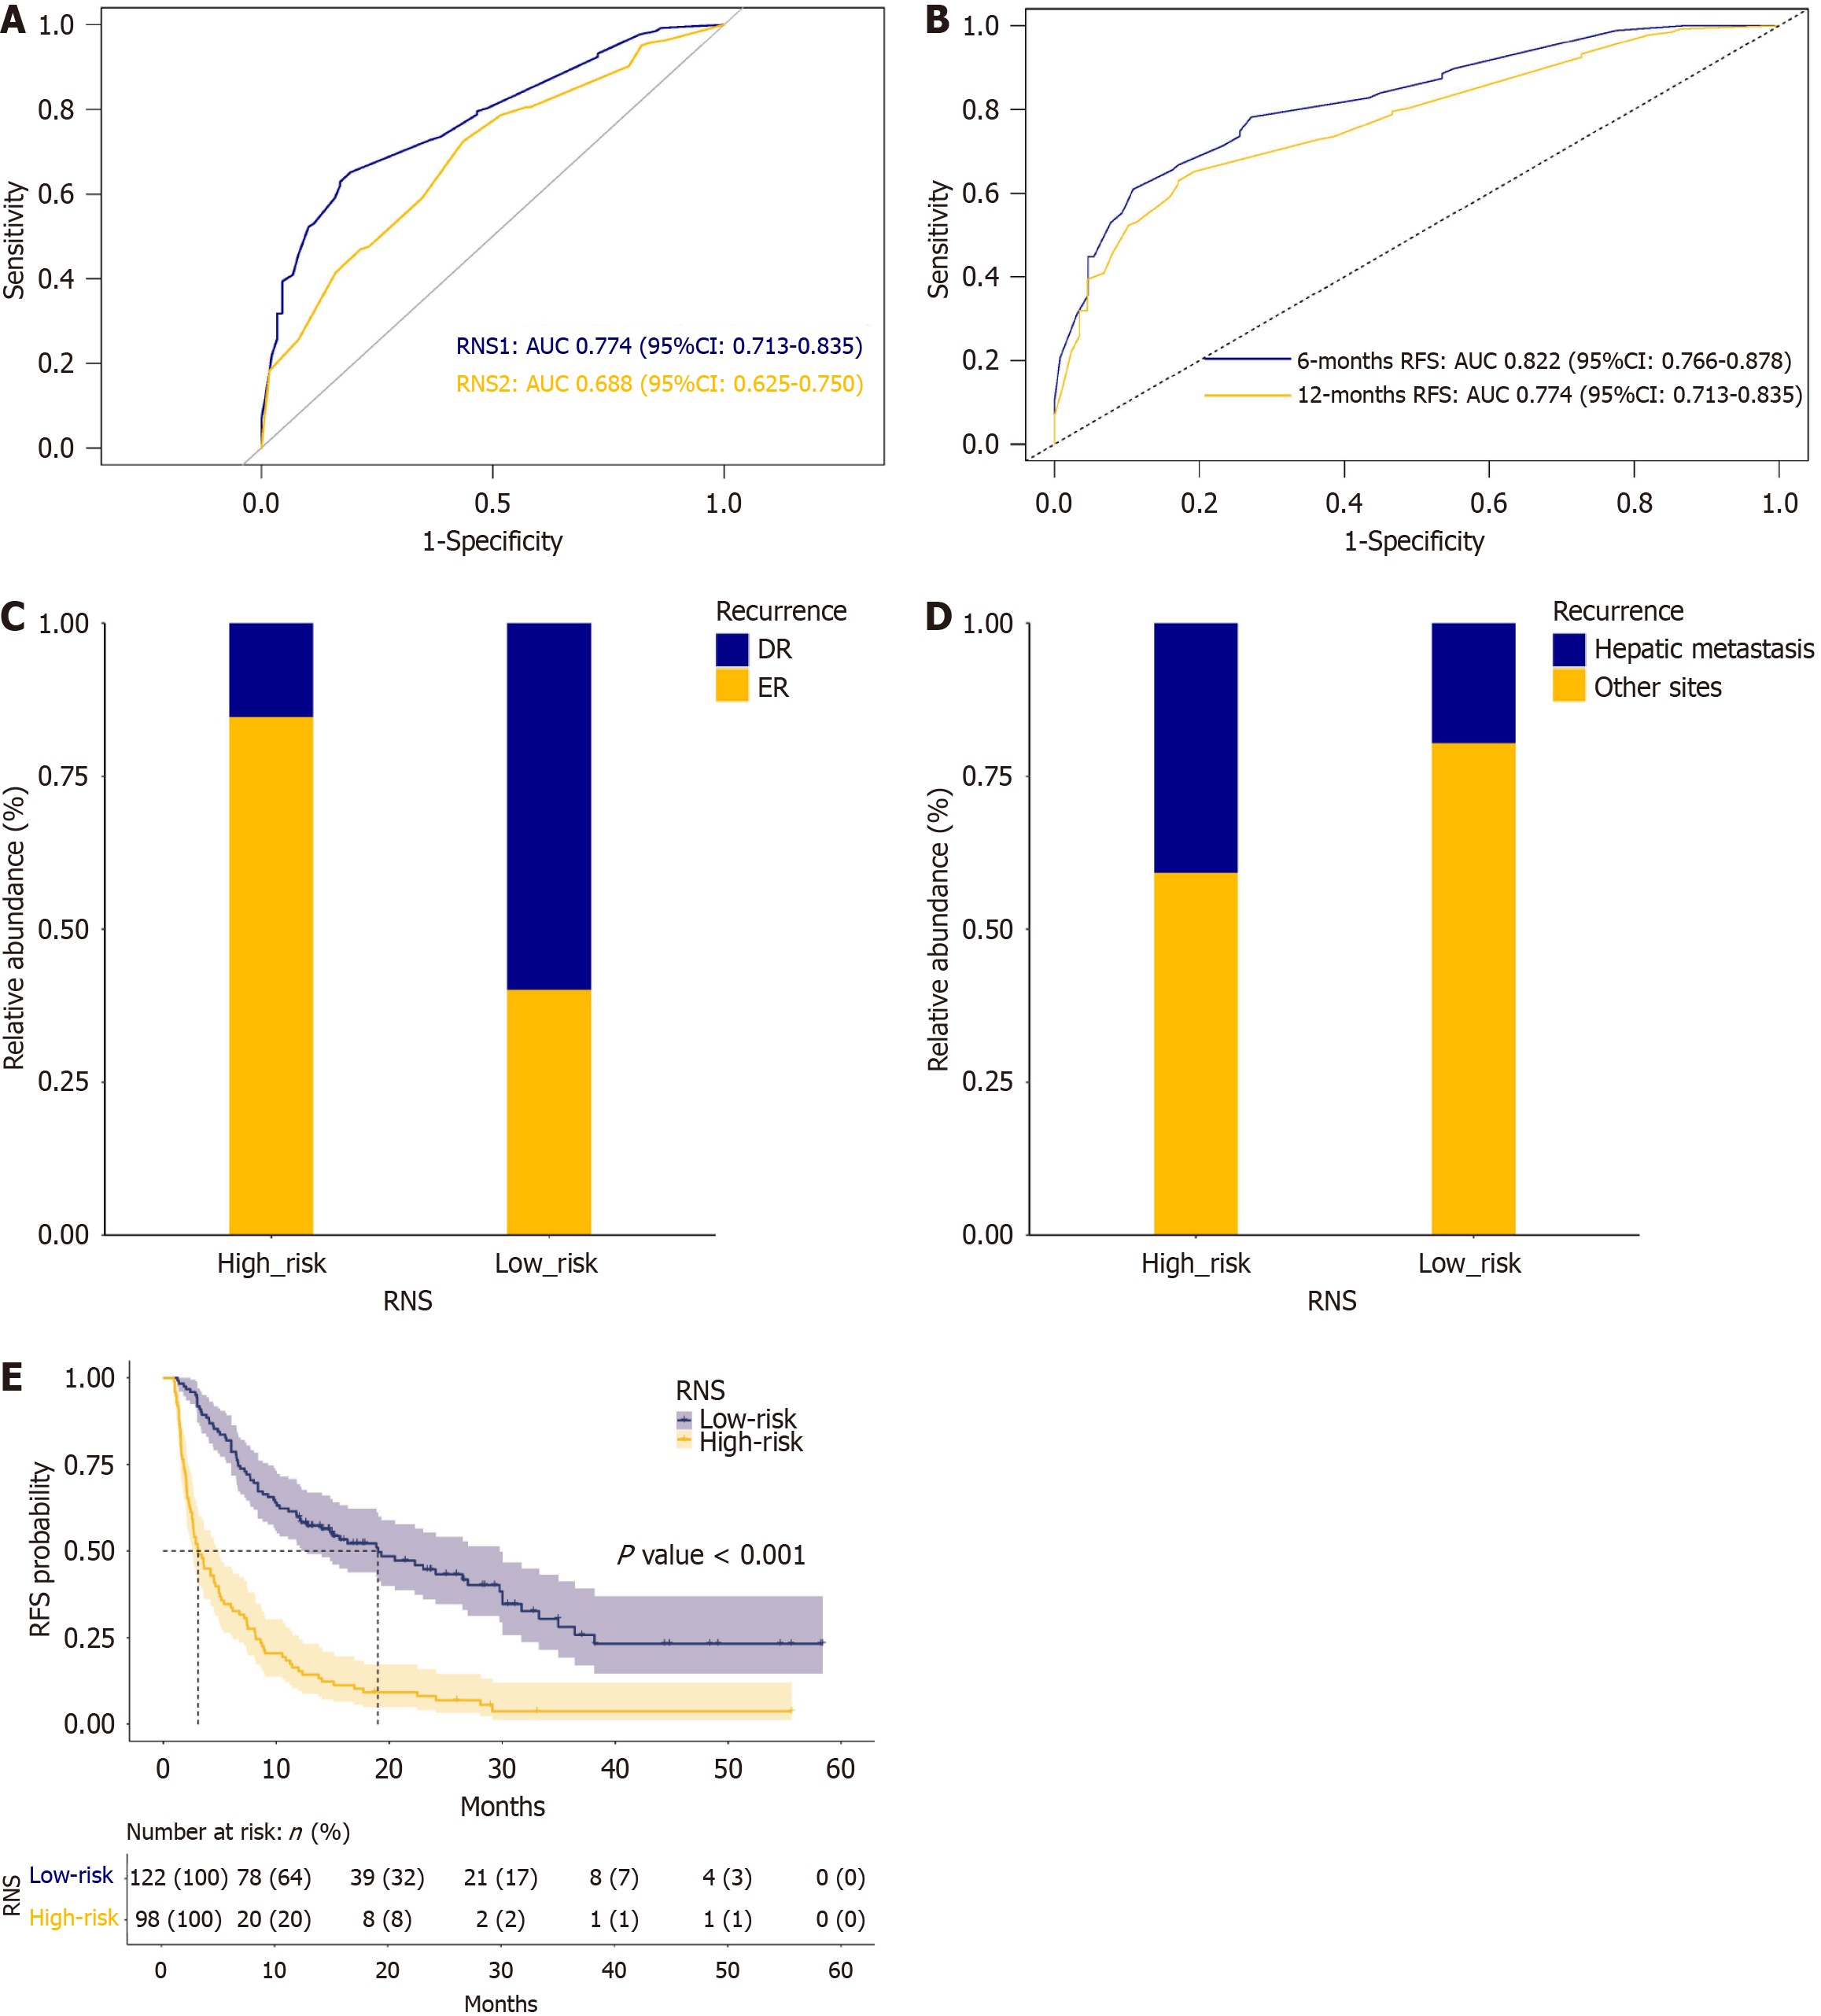
Figure 3 Receiver operating characteristic curve analysis of the nomogram, and stratified analysis of patients’ outcomes depending on recurrence nomogram score.
A: Receiver operating characteristic (ROC) curves of recurrence nomogram score (RNS) 1 [with postoperative serum tumor markers (STMs)] and RNS2 (without postoperative STMs) for predicting early recurrence (ER). The area under the curve (AUC) of RNS1 was greater than the AUC of RNS2 (P = 0.016); B: ROC curves of RNS (with postoperative STMs) for predicting ER in different time intervals. The AUC of RNS decreased with time; C: The stacked plot of both ER and delayed recurrence stratified by RNS. It showed that the ER ratio was significantly higher in high-risk group than in low-risk group (P < 0.001); D: The stacked plot of recurrence sites stratified by RNS. It showed that hepatic metastasis was more frequently observed in high-risk group compared with low-risk group (P = 0.001); E: Kaplan-Meier survival analysis of recurrence free survival (RFS) stratified by RNS. High-risk group had significantly poorer RFS compared with low-risk group. RNS: Recurrence nomogram score; AUC: Area under the curve.
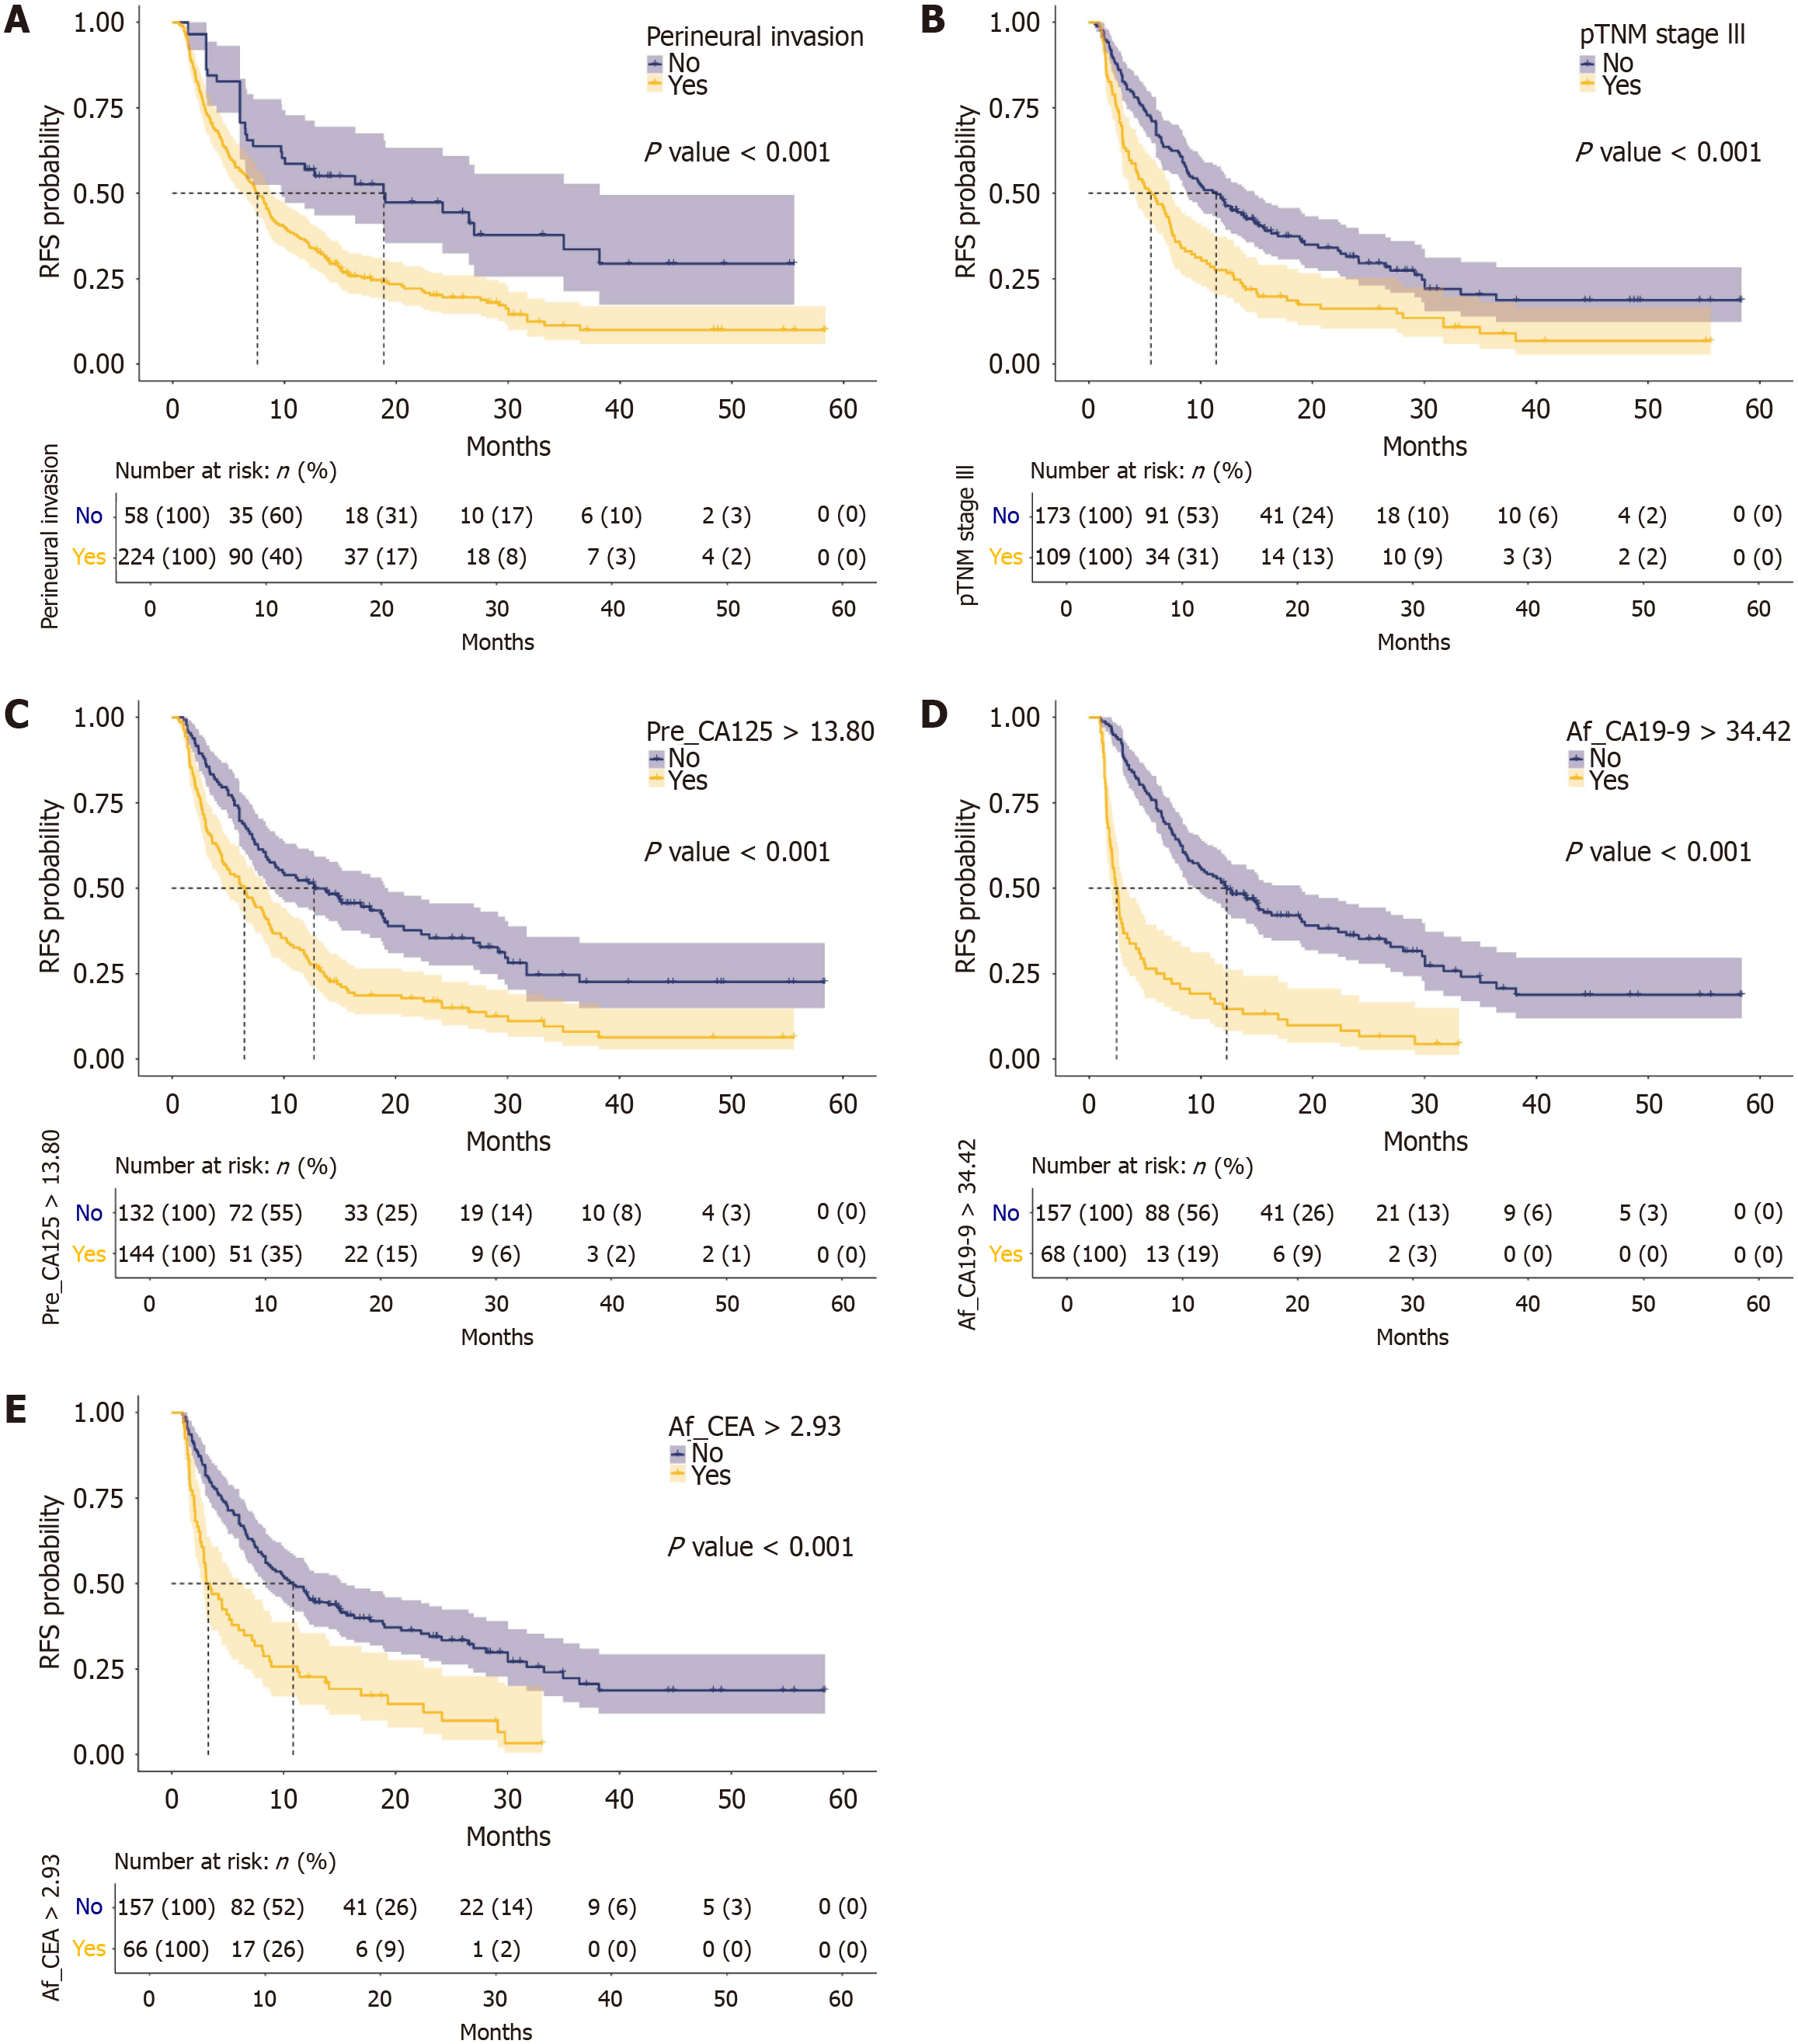
Figure 4 Stratified analysis of recurrence free survival by independent risk factors of early recurrence.
A: Kaplan-Meier survival analysis of recurrence free survival (RFS) stratified by perineural invasion. Patients with perineural invasion of their tumors had poorer RFS than those without; B: Kaplan-Meier survival analysis of RFS stratified by pathological stage. Patients with stage III tumor had poorer RFS than those without; C: Kaplan-Meier survival analysis of RFS stratified by preoperative serum carbohydrate antigen 125 (CA125). Patients with Pre_CA125 > 13.80 U/mL had poorer RFS than those with Pre_CA125 ≤ 13.80 U/mL; D: Kaplan-Meier survival analysis of RFS stratified by postoperative serum carbohydrate antigen 19-9 (CA19-9). Patients with Af_CA19-9 > 34.42 U/mL had poorer RFS than those with Af_CA19-9 ≤ 34.42 U/mL; E: Kaplan-Meier survival analysis of RFS stratified by postoperative serum carcinoembryonic antigen (CEA). Patients with Af_CEA > 2.93 ng/mL had poorer RFS than those with Af_CEA ≤ 2.93 ng/mL. CA125: Carbohydrate antigen 125; CA19-9: Carbohydrate antigen 19-9; CEA: Carcinoembryonic antigen; RFS: Recurrence free survival.
- Citation: He H, Zou CF, Yang F, Di Y, Jin C, Fu DL. Postoperative serum tumor markers-based nomogram predicting early recurrence for patients undergoing radical resections of pancreatic ductal adenocarcinoma. World J Gastrointest Surg 2024; 16(10): 3211-3223
- URL: https://www.wjgnet.com/1948-9366/full/v16/i10/3211.htm
- DOI: https://dx.doi.org/10.4240/wjgs.v16.i10.3211


