Copyright
©The Author(s) 2024.
World J Gastrointest Surg. Oct 27, 2024; 16(10): 3202-3210
Published online Oct 27, 2024. doi: 10.4240/wjgs.v16.i10.3202
Published online Oct 27, 2024. doi: 10.4240/wjgs.v16.i10.3202
Figure 1 Serum tumor marker levels in the two colorectal cancer treatment groups.
The control group was treated with the XELOX chemotherapy regimen and the research group with XELOX + the dendritic cell-cytokine-induced killer immunotherapy regimen. A: Pre- and posttreatment carcinoembryonic antigen levels in the two groups. B: Pre- and posttreatment carbohydrate antigens (CA)19-9 levels in the two groups; C: Pre- and posttreatment CA242 levels in the two groups. aP < 0.05 compared to pre-treatment levels; bP < 0.01 compared to pre-treatment levels. CEA: Carcinoembryonic antigens; CA: Carbohydrate antigens.
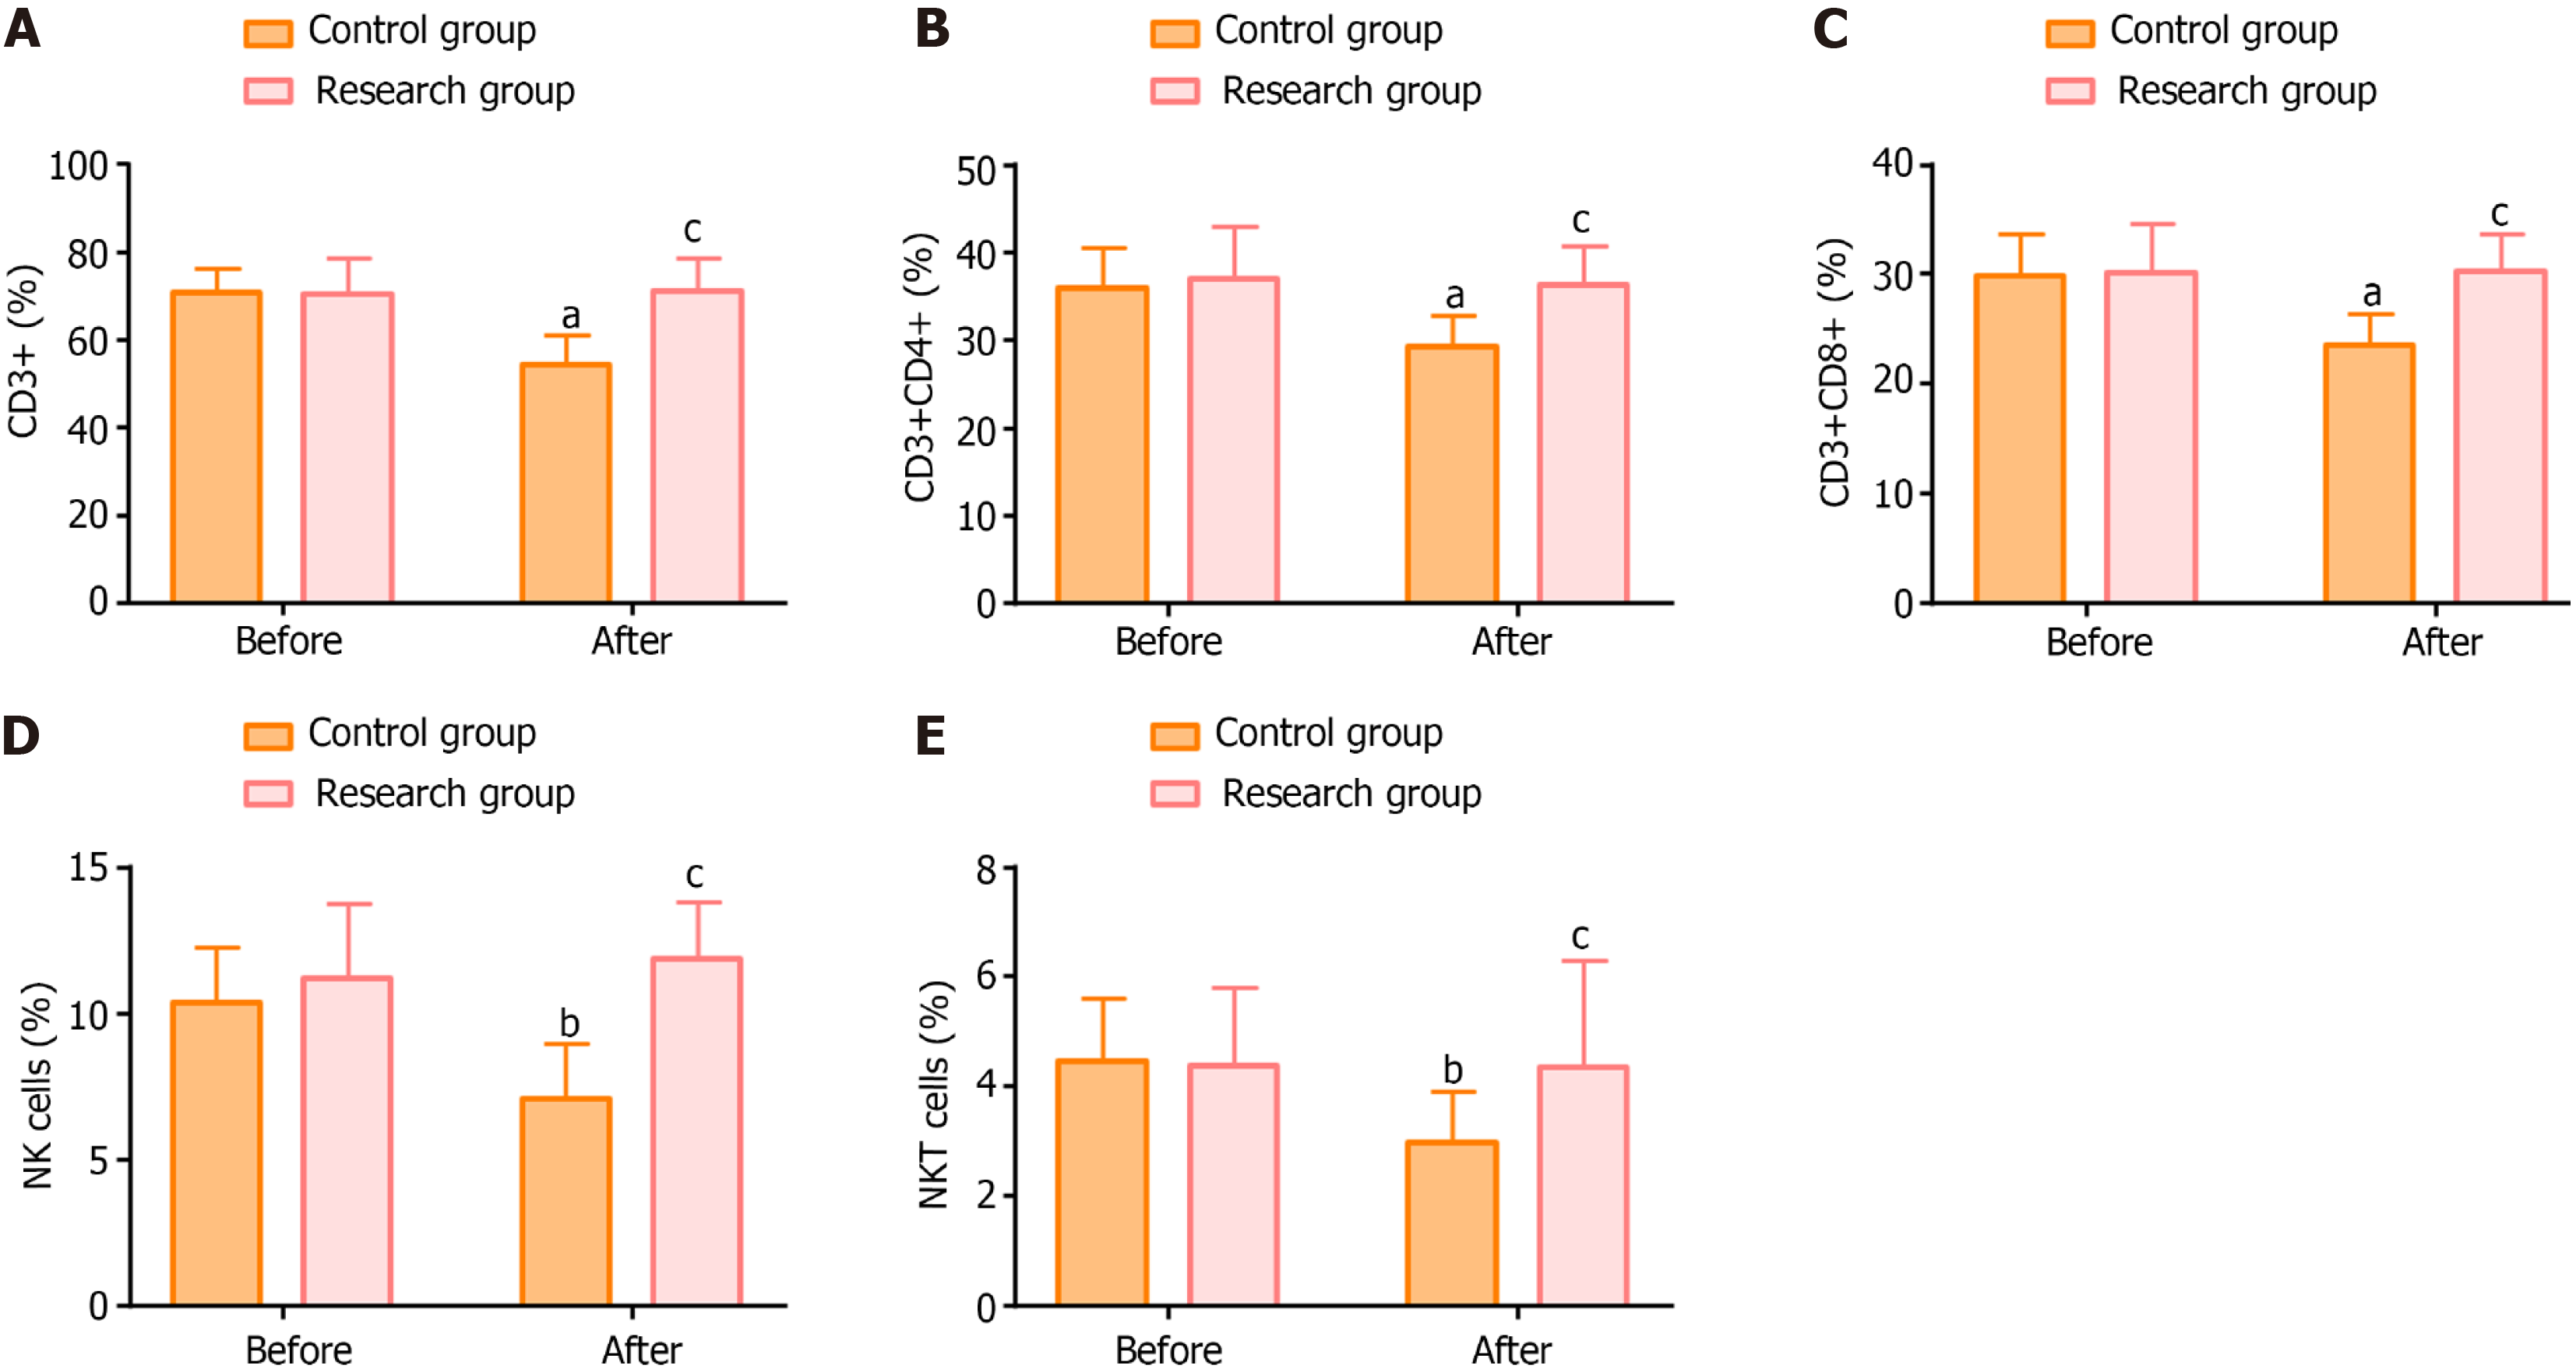
Figure 2 Pre- and posttreatment levels of T-cell subsets in the two colorectal cancer treatment groups.
The control group was treated with the XELOX chemotherapy regimen and the research group with XELOX + the dendritic cell-cytokine-induced killer immunotherapy regimen. A: Pre- and posttreatment CD3+ levels in the two groups; B: Pre- and posttreatment CD3+ CD4+ levels in the two groups; C: Pre- and posttreatment CD3+ CD8+ levels in the two groups; D: Pre- and posttreatment natural killer (NK) cell levels in the two groups; E: Pre- and posttreatment NK T-cell levels in the two groups. aP < 0.05 compared to pre-treatment levels; bP < 0.01 compared to pre-treatment levels; cP < 0.05 compared to control group levels. CD: Cluster of differentiation; NK: Natural killer.
- Citation: Ding ZY, Piao Y, Jiang T, Chen J, Wang YN, Yu HY, Zheng ZD. Effects of postoperative treatment with chemotherapy and cellular immunotherapy on patients with colorectal cancer. World J Gastrointest Surg 2024; 16(10): 3202-3210
- URL: https://www.wjgnet.com/1948-9366/full/v16/i10/3202.htm
- DOI: https://dx.doi.org/10.4240/wjgs.v16.i10.3202


