Copyright
©The Author(s) 2024.
World J Gastrointest Surg. Jan 27, 2024; 16(1): 215-227
Published online Jan 27, 2024. doi: 10.4240/wjgs.v16.i1.215
Published online Jan 27, 2024. doi: 10.4240/wjgs.v16.i1.215
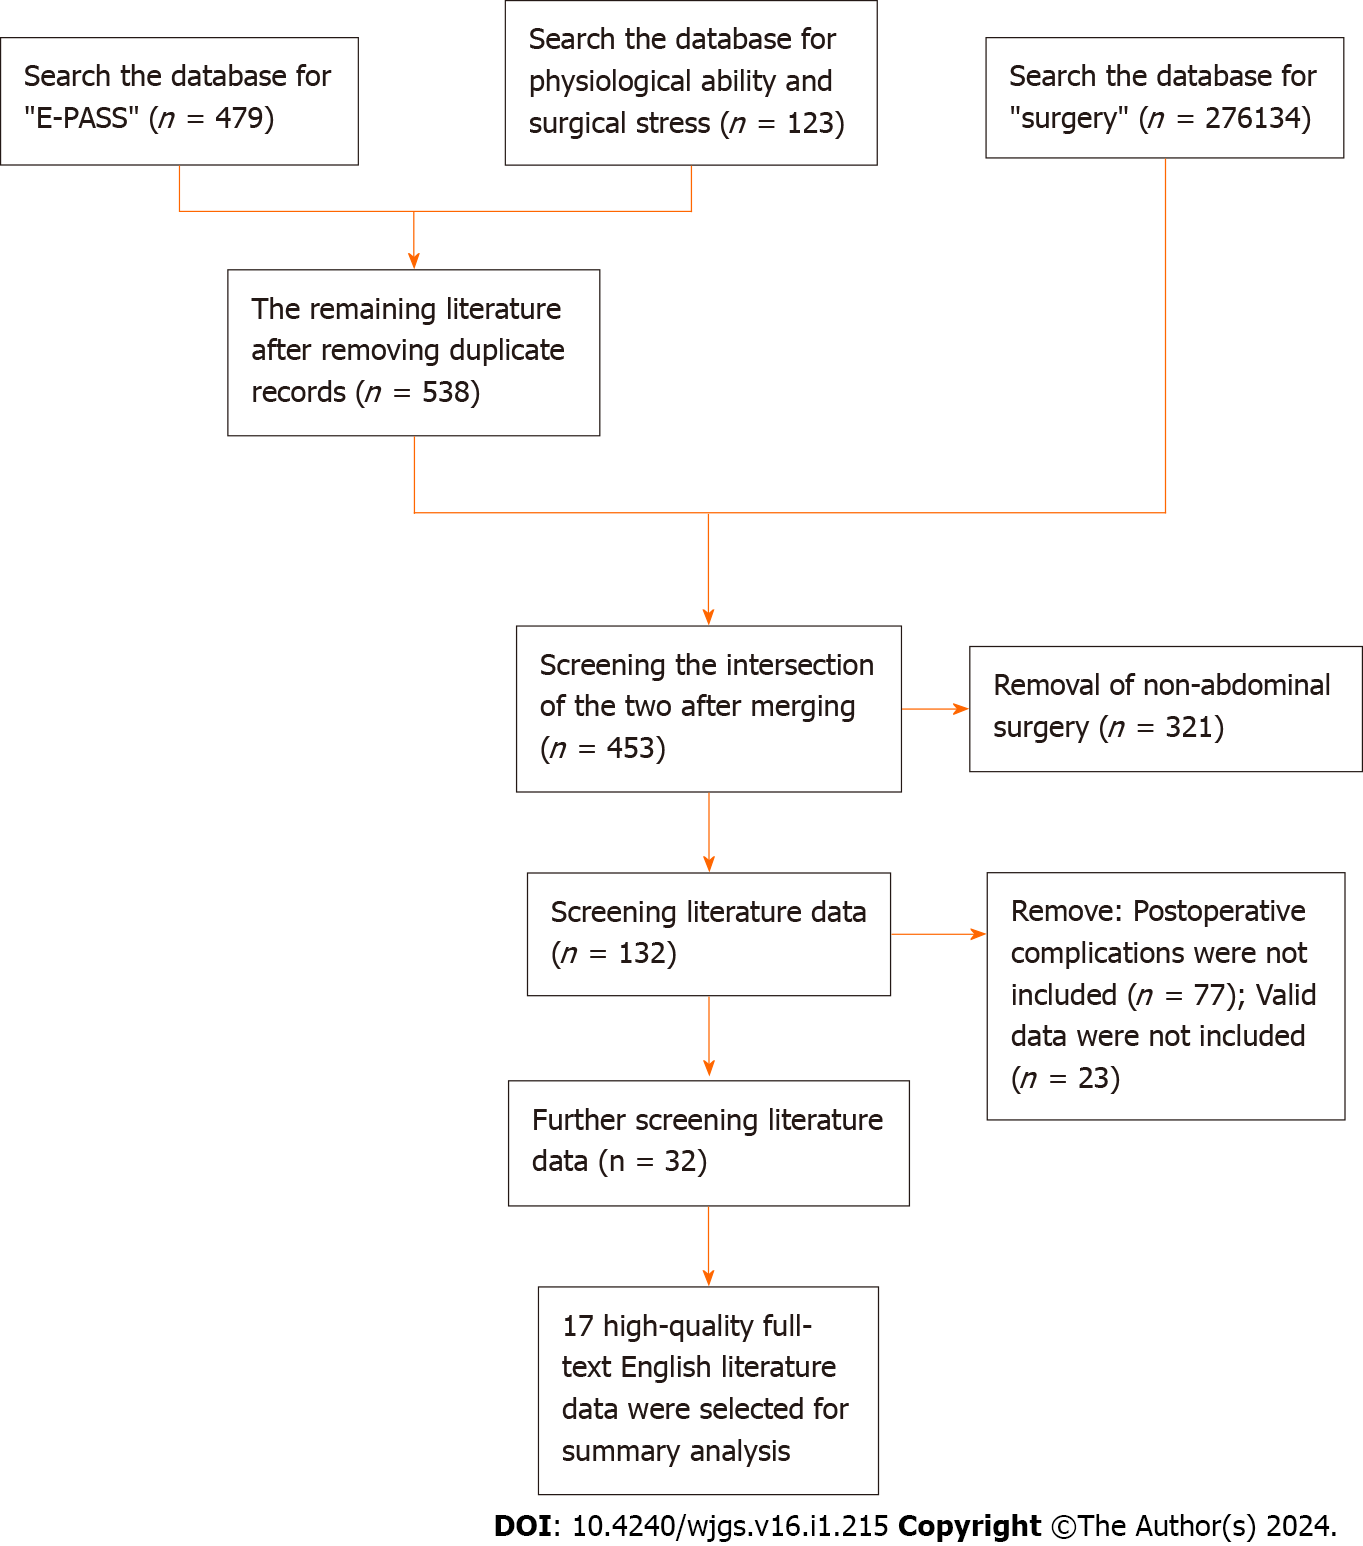
Figure 1 Flow chart of literature retrieval.
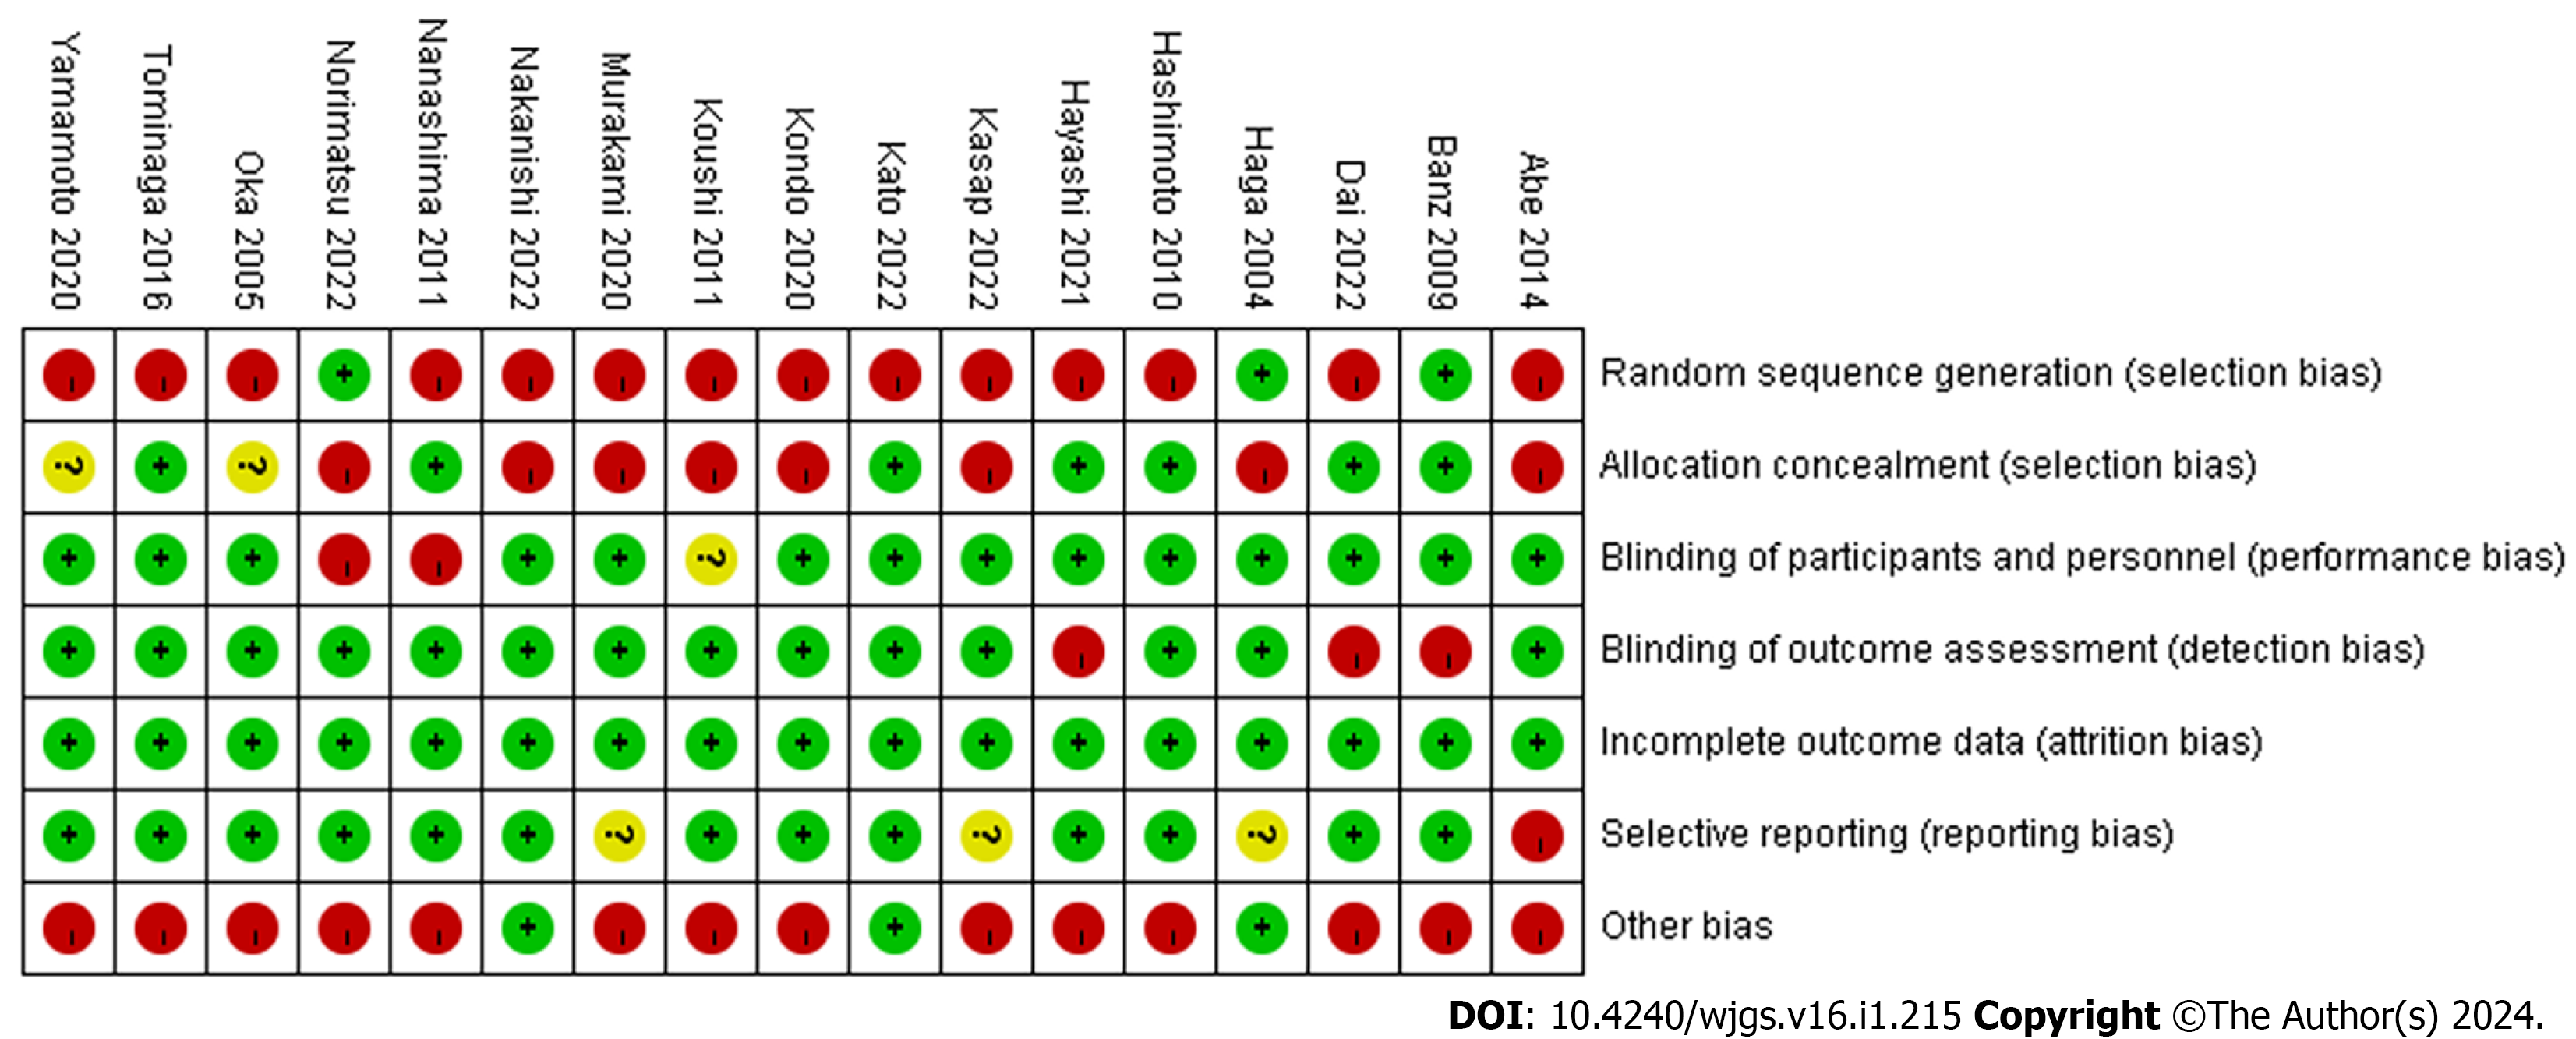
Figure 2 Assessment of risk bias in meta-analyses.
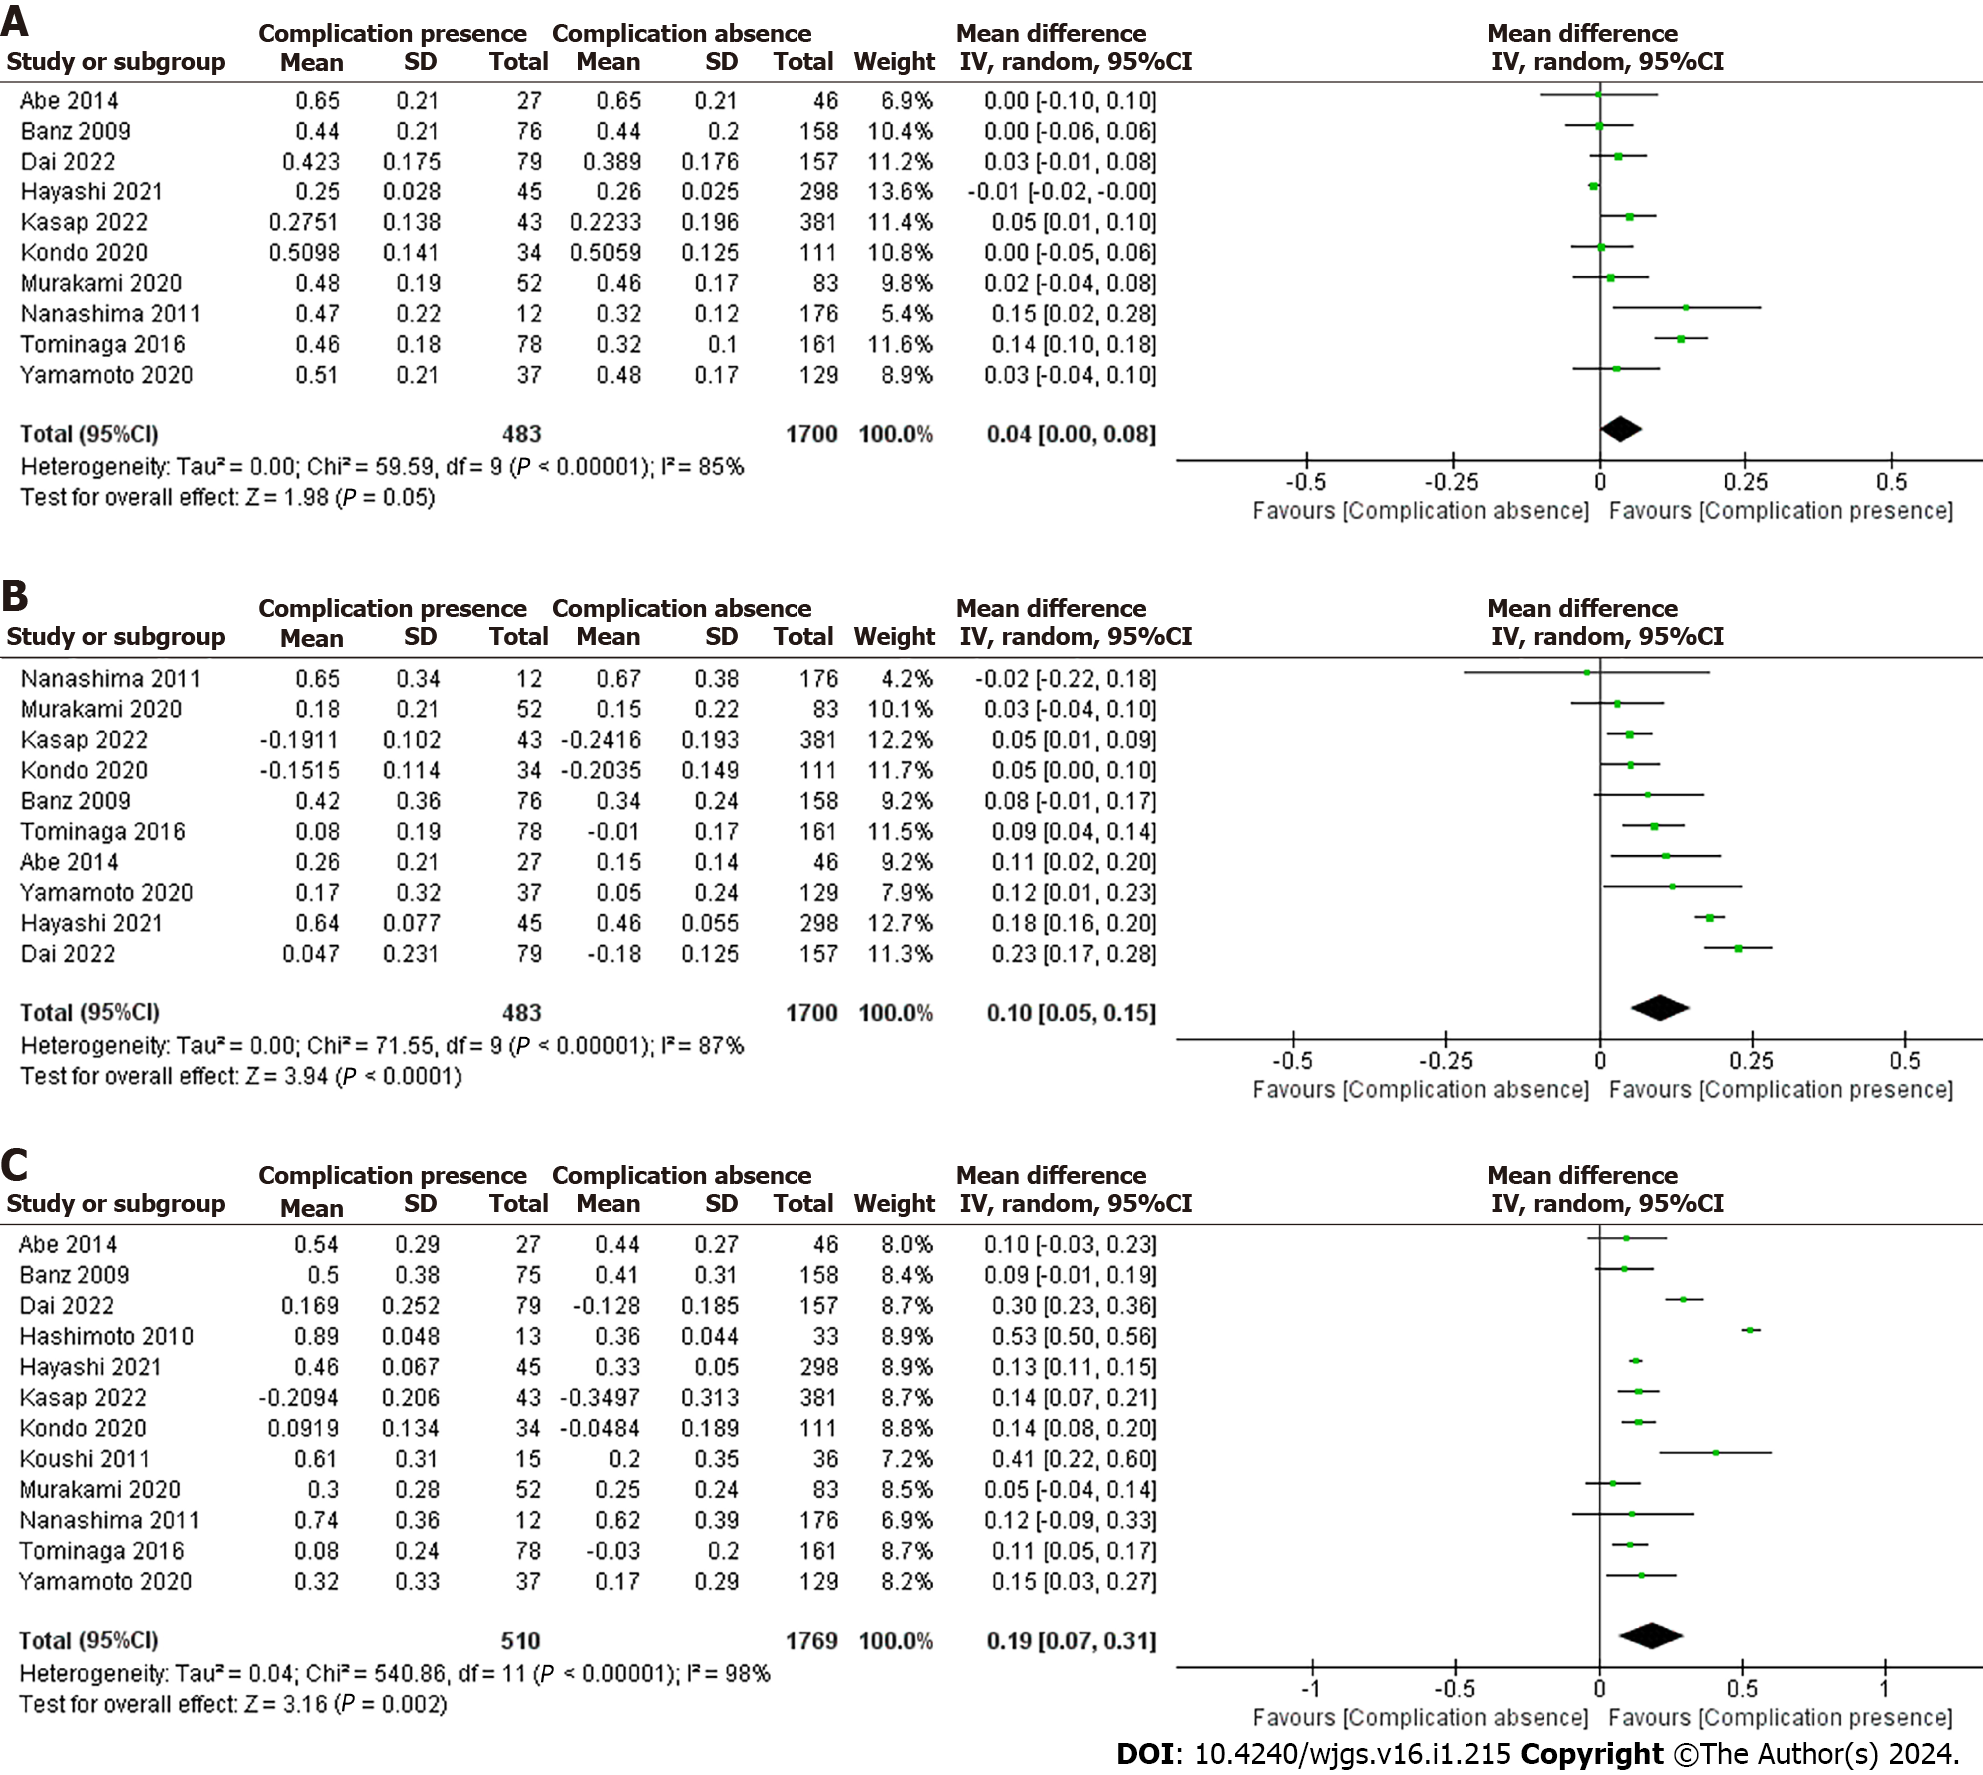
Figure 3 Forest plot of the Estimation of Physiologic Ability and Surgical Stress scoring system compared with postoperative complications.
A: Preoperative risk score; B: Surgical stress score; C: Comprehensive risk score. CI: Confidence interval.
Figure 4 Funnel plot of random effects model analysis in the Estimation of Physiologic Ability and Surgical Stress scoring system compared with postoperative complications of abdominal surgery.
A: Preoperative risk score; B: Surgical stress score; C: Comprehensive risk score.
Figure 5 Funnel plot of fixed effects model analysis in the Estimation of Physiologic Ability and Surgical Stress scoring system compared with postoperative complications of abdominal surgery.
A: Preoperative risk score; B: Surgical stress score; C: Comprehensive risk score.
Figure 6 Forest plot of postoperative complications and mortality in the high comprehensive risk score group and the low compre
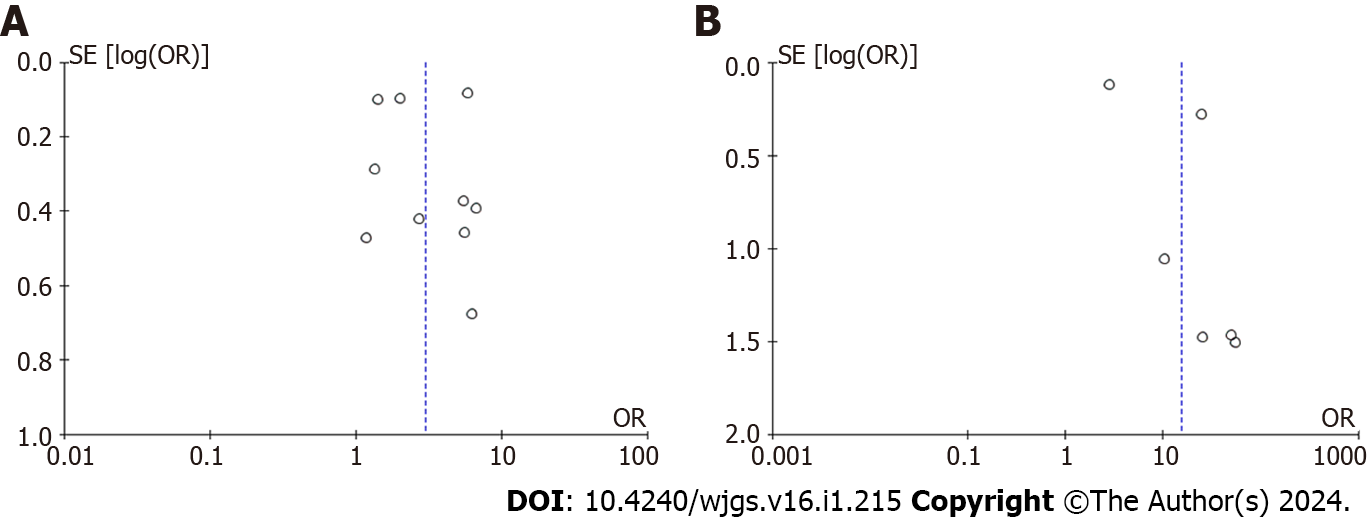
Figure 7 Funnel plot analysis of postoperative complication rate and mortality in the high comprehensive risk score group and the low comprehensive risk score group.
A: Postoperative complication rate; B: Postoperative mortality.
- Citation: Pang TS, Cao LP. Estimation of Physiologic Ability and Surgical Stress scoring system for predicting complications following abdominal surgery: A meta-analysis spanning 2004 to 2022. World J Gastrointest Surg 2024; 16(1): 215-227
- URL: https://www.wjgnet.com/1948-9366/full/v16/i1/215.htm
- DOI: https://dx.doi.org/10.4240/wjgs.v16.i1.215


