Copyright
©The Author(s) 2023.
World J Gastrointest Surg. Sep 27, 2023; 15(9): 2052-2062
Published online Sep 27, 2023. doi: 10.4240/wjgs.v15.i9.2052
Published online Sep 27, 2023. doi: 10.4240/wjgs.v15.i9.2052
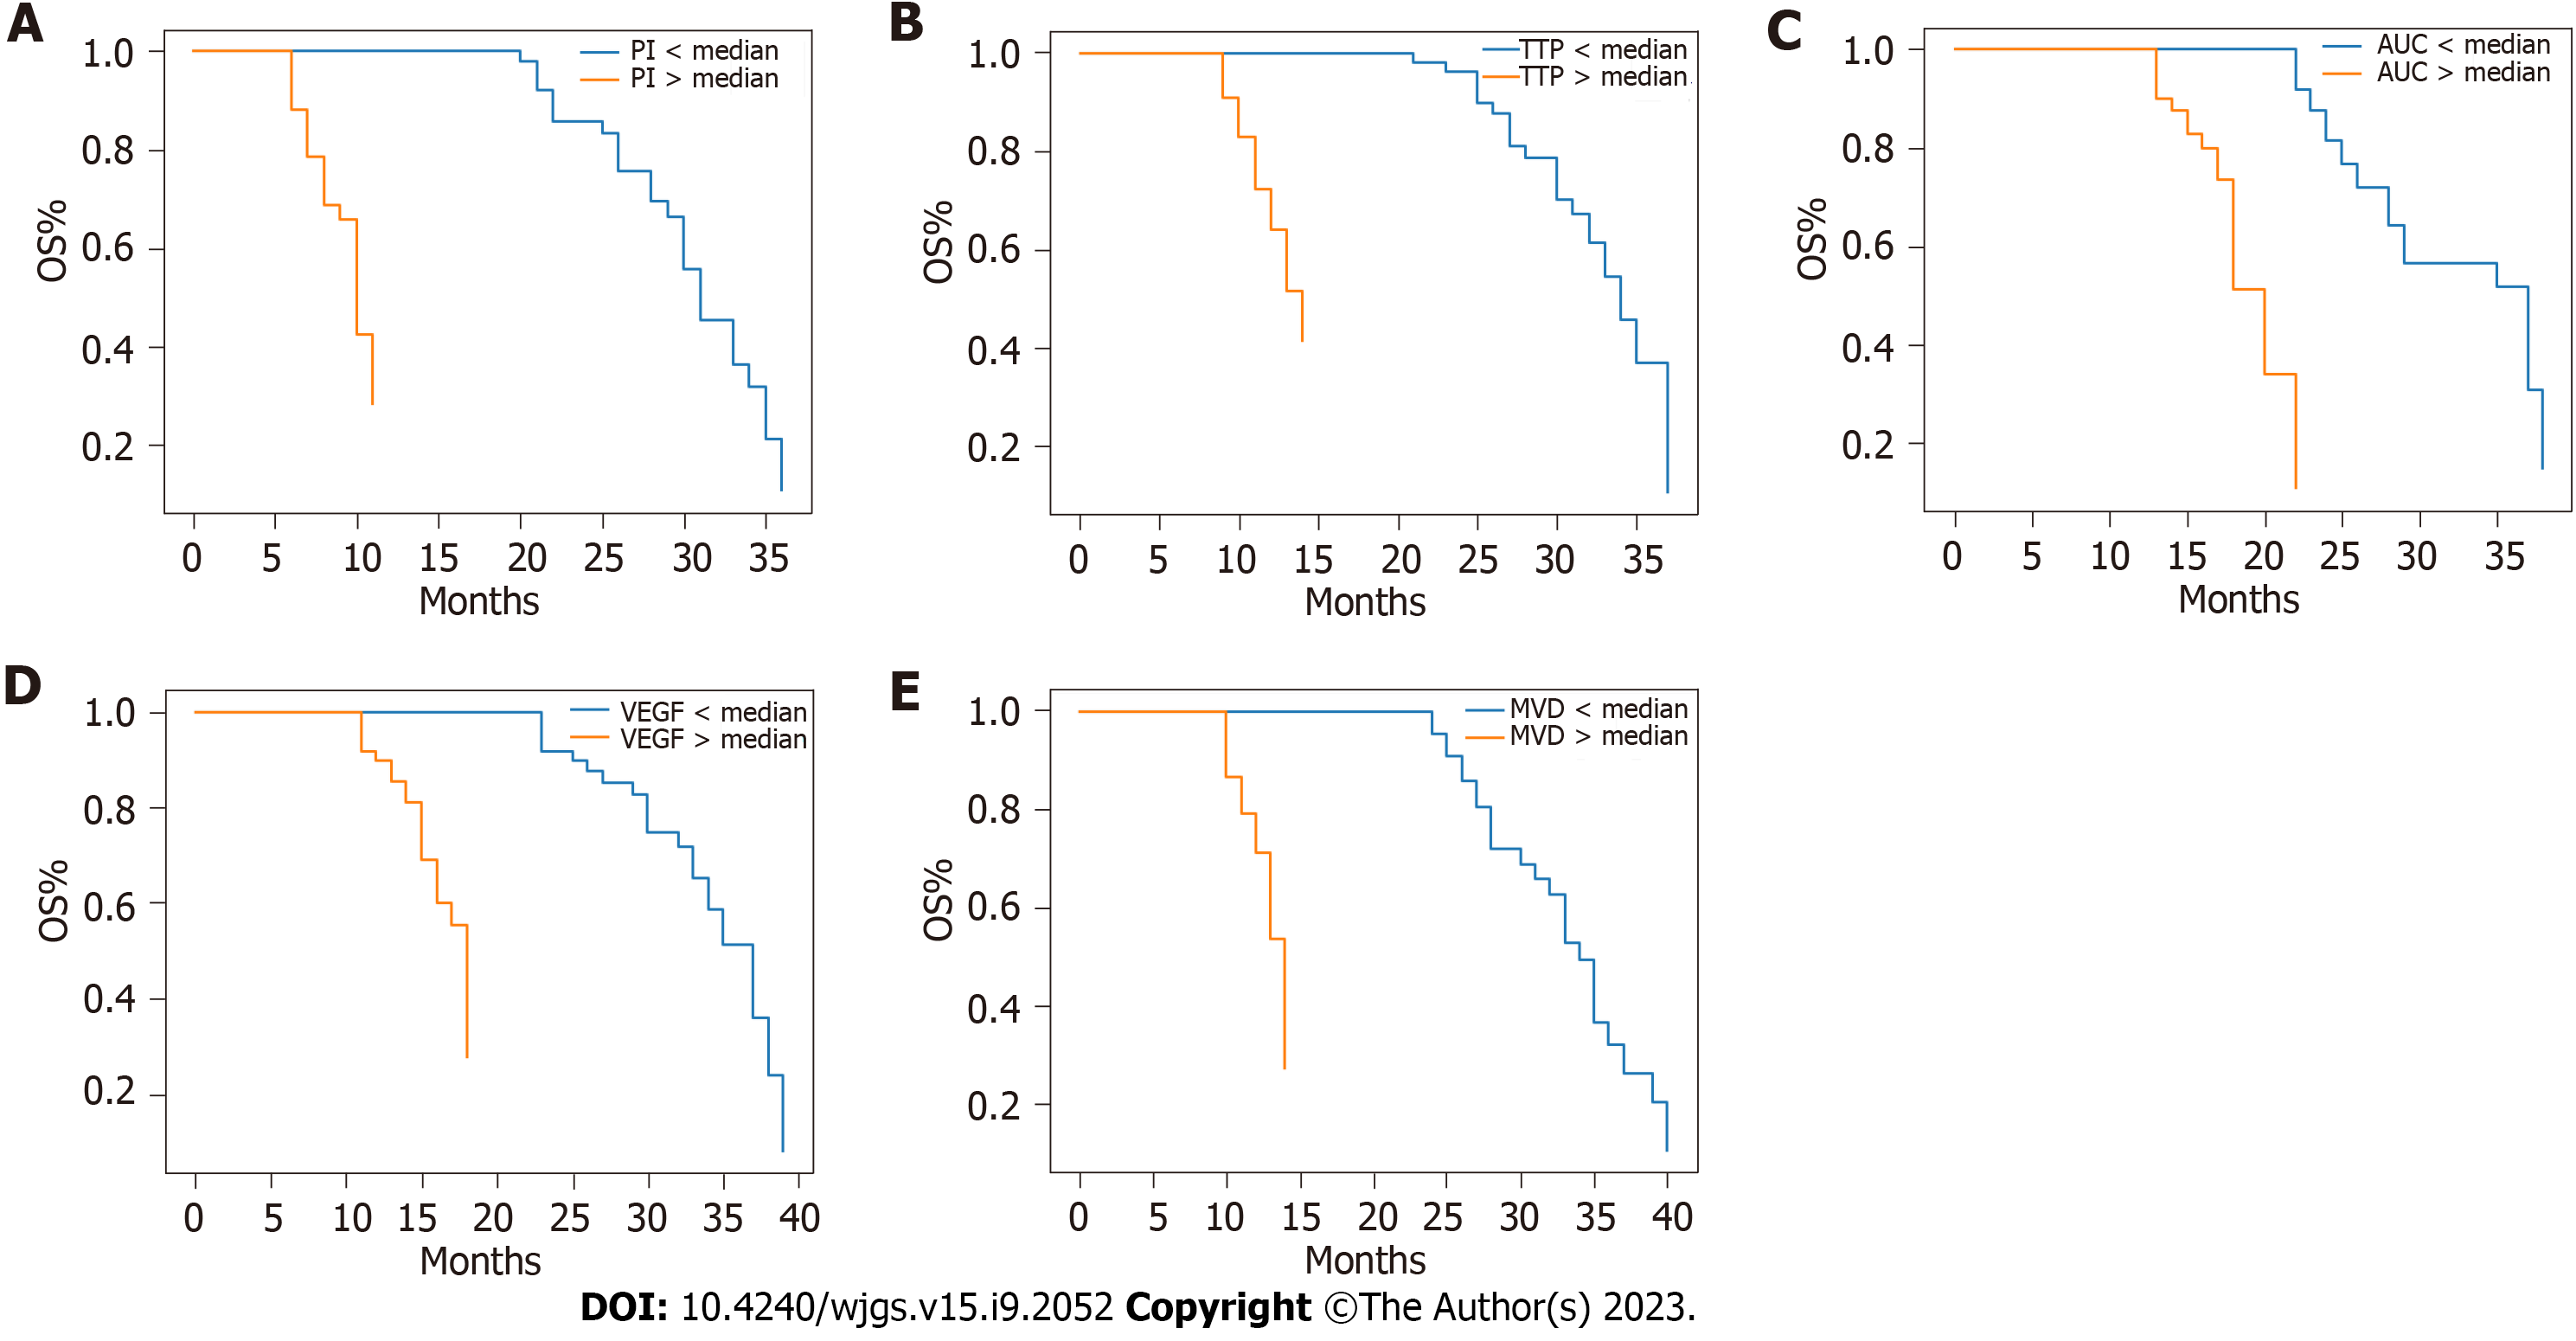
Figure 1 Kaplan-Meier survival curves for overall survival according to contrast-enhanced ultrasound parameters, vascular endothelial growth factor expression, and microvessel density.
A: Kaplan-Meier curve for peak intensity; B: Kaplan-Meier curve for time to peak; C: Kaplan-Meier curve for area under the curve; D: Kaplan-Meier curve for vascular endothelial growth factor; E: Kaplan-Meier curve for microvessel density. OS: Overall survival; VEGF: Vascular endothelial growth factor; PI: Peak intensity; TTP: Time to peak; MVD: Microvessel density; AUC: Area under the curve.
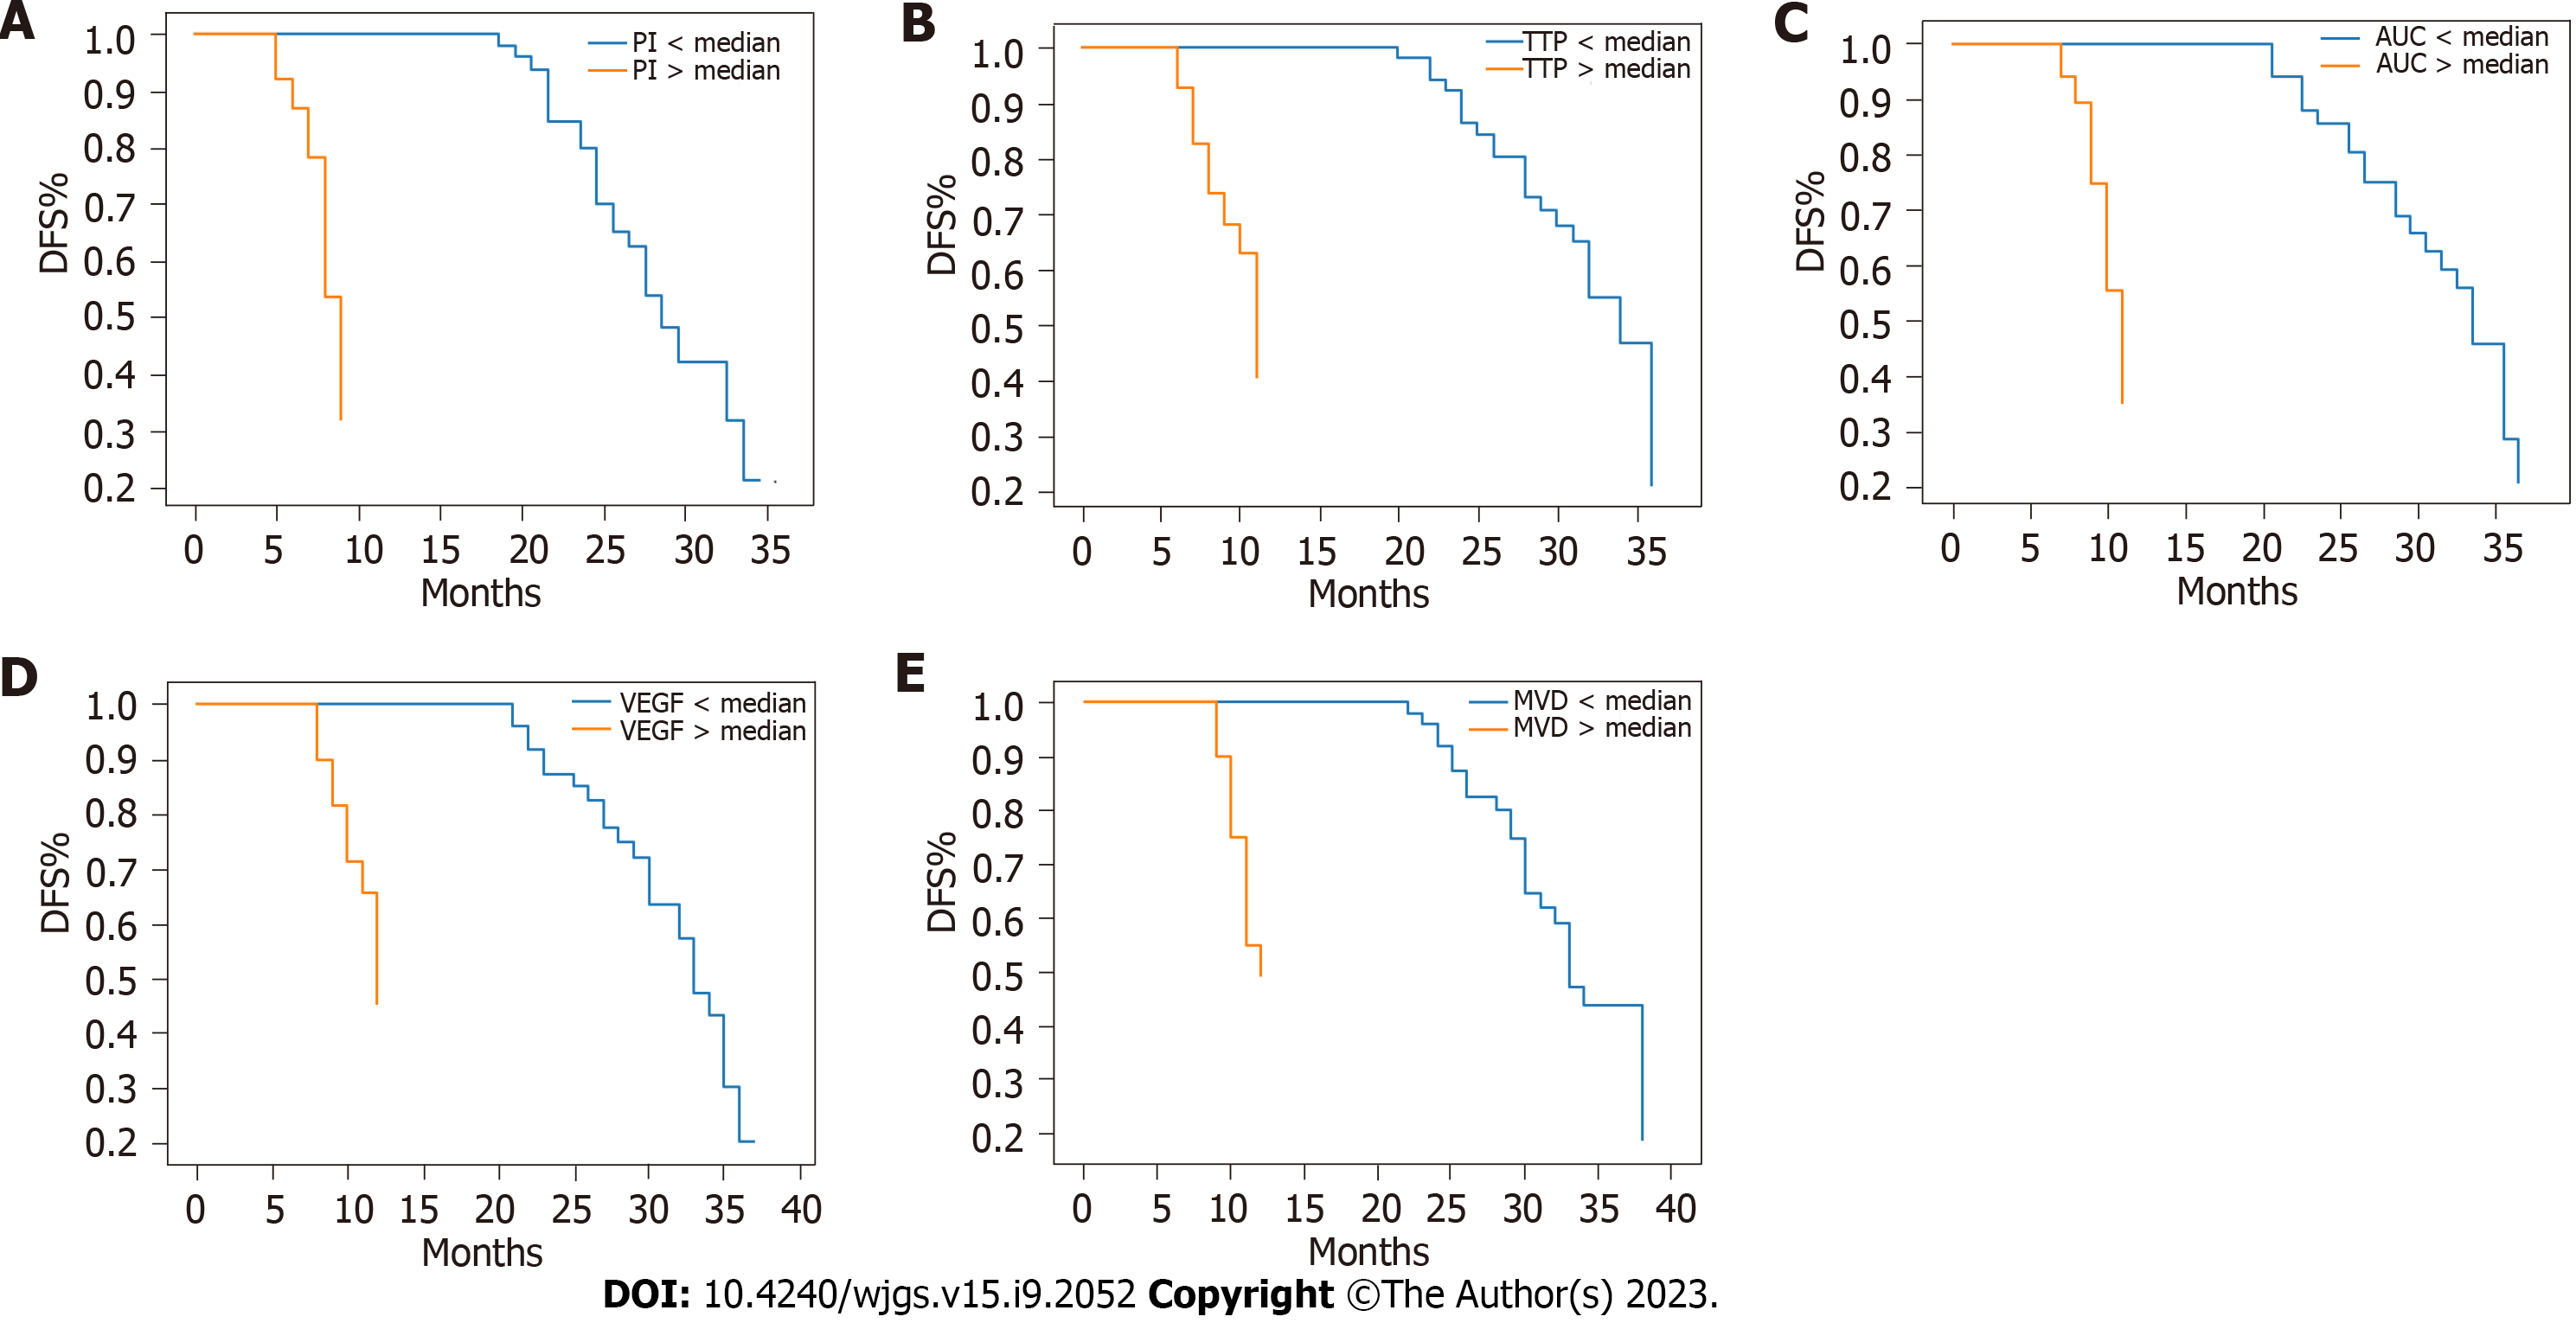
Figure 2 Kaplan-Meier survival curves for disease-free survival according to contrast-enhanced ultrasound parameters, vascular endothelial growth factor expression, and microvessel density.
A: Kaplan-Meier curve for peak intensity; B: Kaplan-Meier curve for time to peak; C: Kaplan-Meier curve for area under the curve; D: Kaplan-Meier curve for vascular endothelial growth factor; E: Kaplan-Meier curve for microvessel density. DFS: Disease-free survival; VEGF: Vascular endothelial growth factor; MVD: Microvessel density; TTP: Time to peak; AUC: Area under the curve; PI: Peak intensity.
- Citation: Li MH, Li WW, He L, Li JF, Zhang SY. Quantitative evaluation of colorectal tumour vasculature using contrast-enhanced ultrasound: Correlation with angiogenesis and prognostic significance. World J Gastrointest Surg 2023; 15(9): 2052-2062
- URL: https://www.wjgnet.com/1948-9366/full/v15/i9/2052.htm
- DOI: https://dx.doi.org/10.4240/wjgs.v15.i9.2052


