Copyright
©The Author(s) 2023.
World J Gastrointest Surg. Sep 27, 2023; 15(9): 2003-2011
Published online Sep 27, 2023. doi: 10.4240/wjgs.v15.i9.2003
Published online Sep 27, 2023. doi: 10.4240/wjgs.v15.i9.2003
Figure 1 The specific bar chart ratio.
A: Bar chart depicting the patient’s operation time and the time of esophageal anastomosis; B-E: Histogram depicting the numbers of lymph node dissection (B), intraoperative blood loss (C), the incision length (D) and the treatment cost (E); F: Bar chartdepicting time of first anal exhaust, time of first food intake and length of hospitalization.
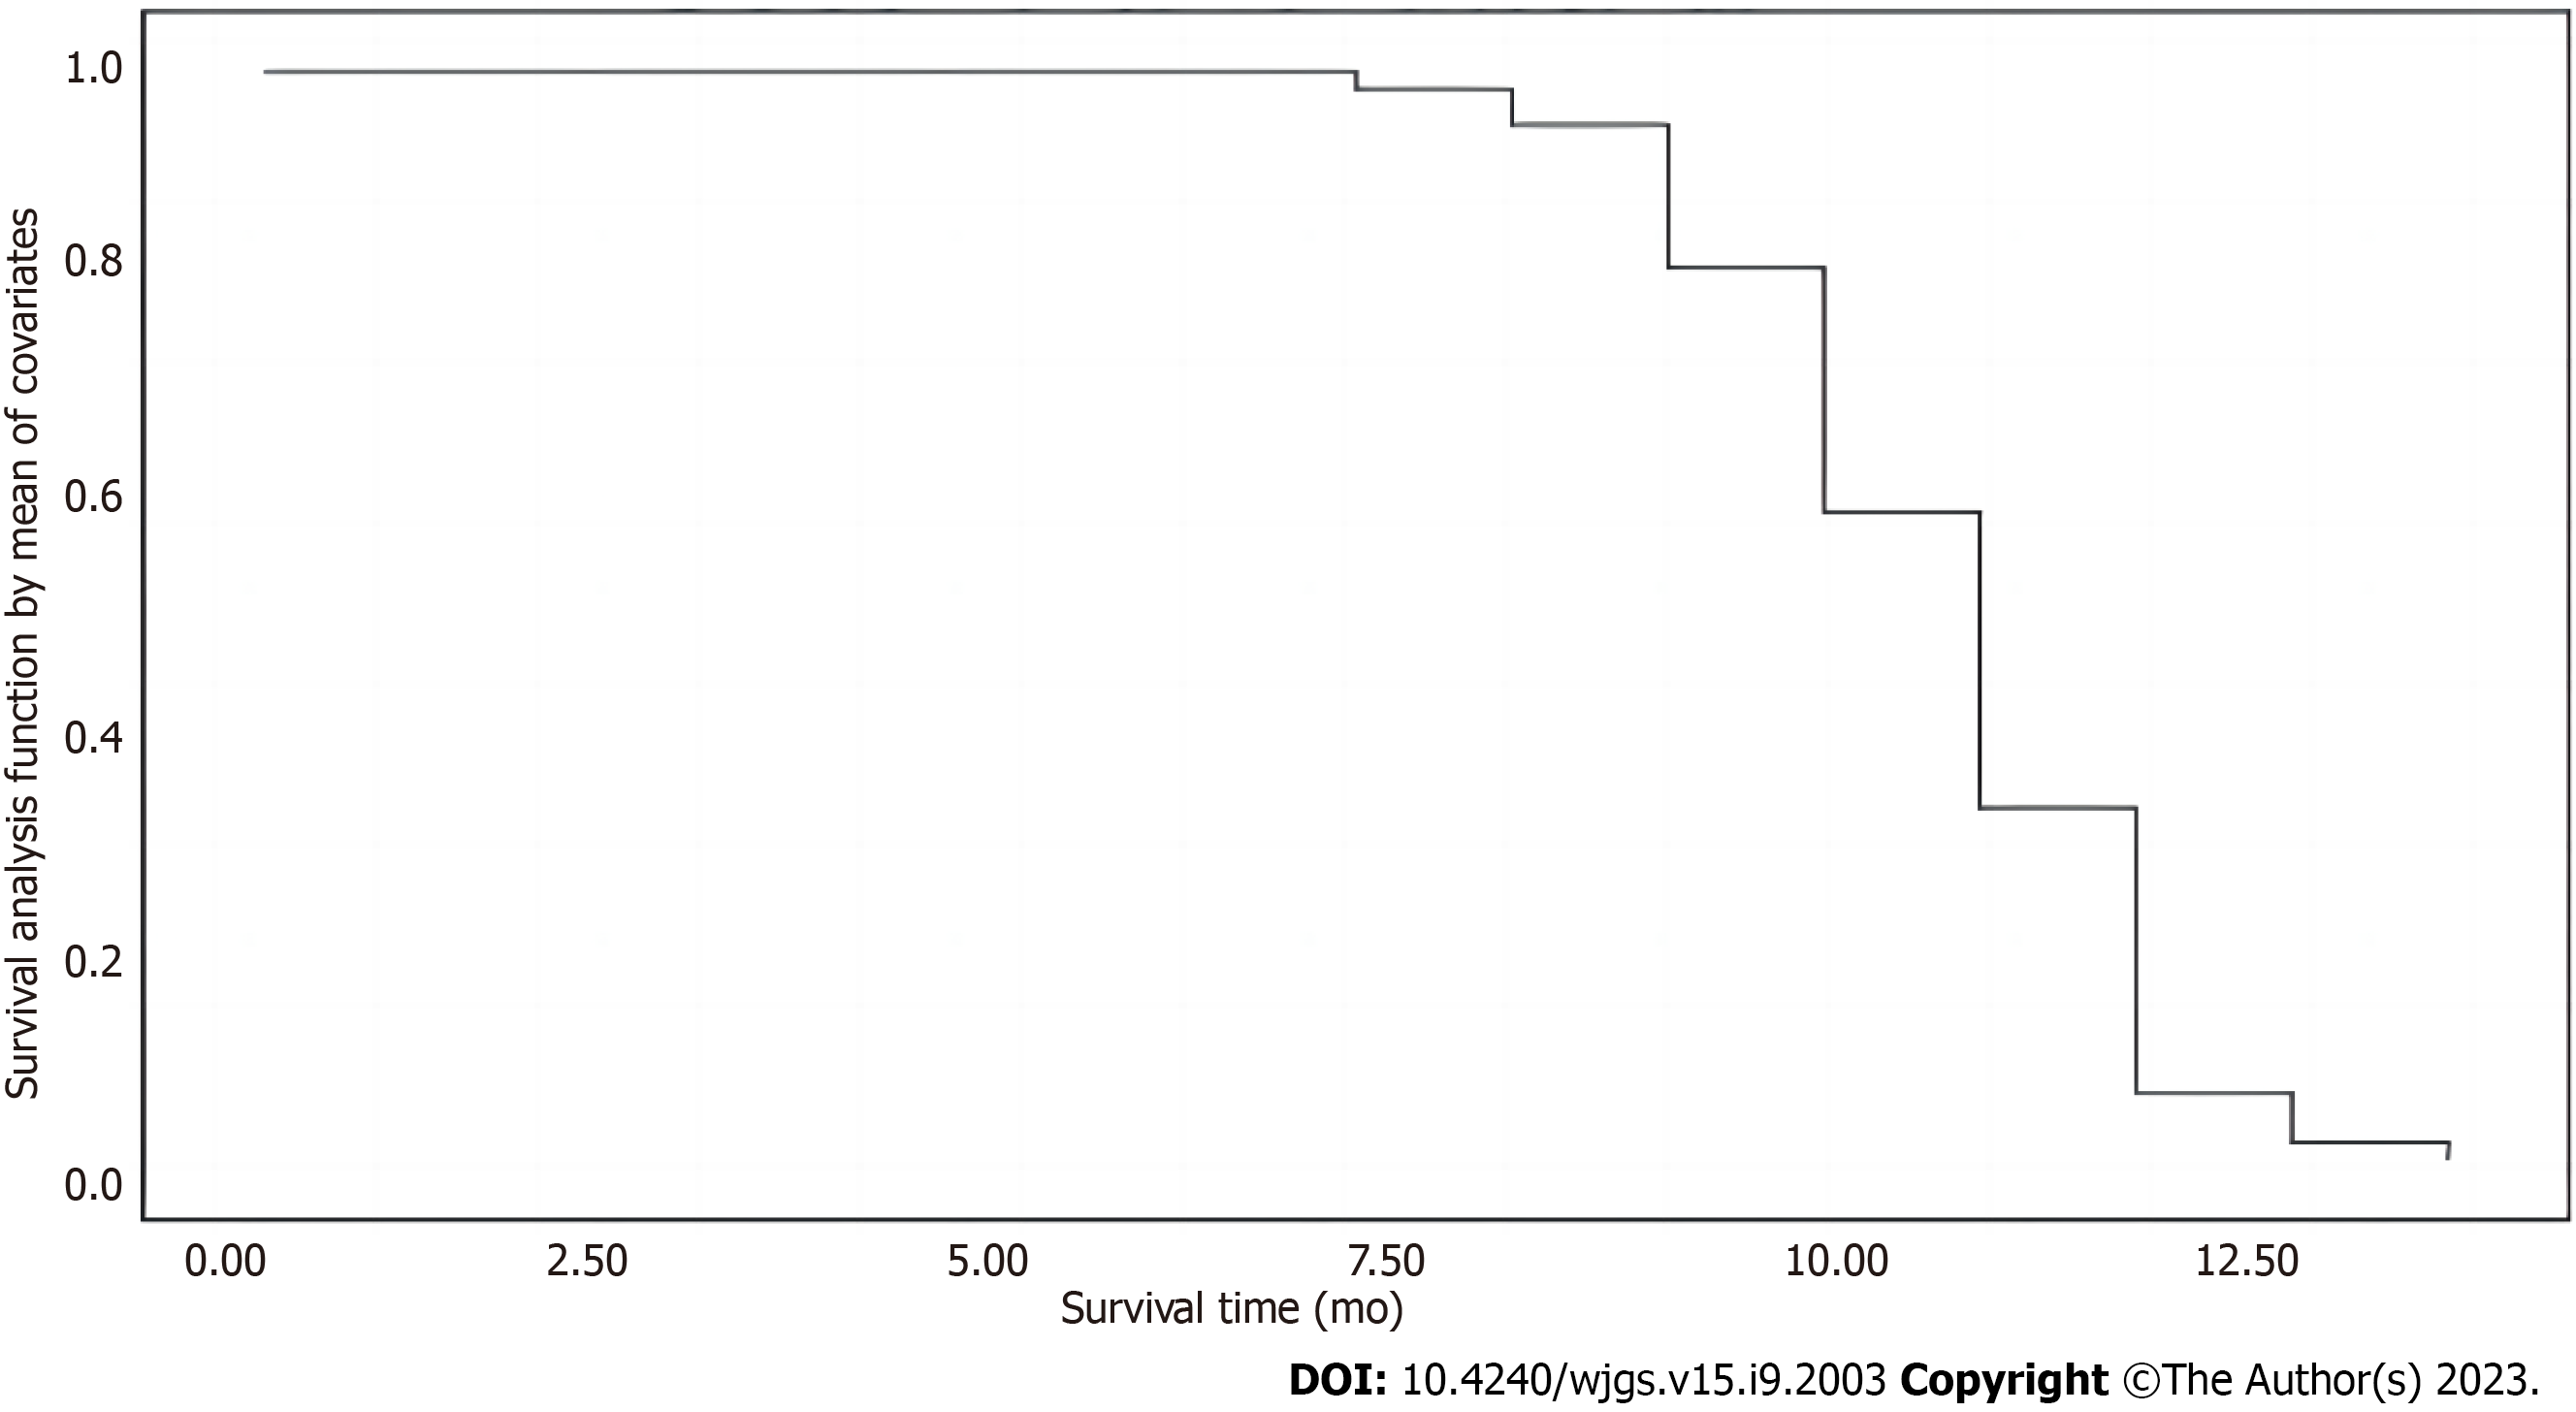
Figure 2 The patient survival function plots.
Figure 3 Bar graph depicting the survival time of patients who survived and died.
- Citation: Shi JK, Wang B, Zhang XS, Lv P, Chen YL, Ren SY. Multifactor analysis of the technique in total laparoscopic gastric cancer. World J Gastrointest Surg 2023; 15(9): 2003-2011
- URL: https://www.wjgnet.com/1948-9366/full/v15/i9/2003.htm
- DOI: https://dx.doi.org/10.4240/wjgs.v15.i9.2003


