Copyright
©The Author(s) 2023.
World J Gastrointest Surg. Aug 27, 2023; 15(8): 1652-1662
Published online Aug 27, 2023. doi: 10.4240/wjgs.v15.i8.1652
Published online Aug 27, 2023. doi: 10.4240/wjgs.v15.i8.1652
Figure 1 Sketch map of the negative pressure irrigation suction drainage and passive gravity drainage systems.
A: Negative pressure irrigation suction drainage. A cranial margin closed the outer silicone cannula with a diameter between 24 French and 30 French, and multiple side apertures with diameters of 3-5 mm were arranged along the cannula (part a). A 12 French urinary catheter and the cranial margin are connected to part a with silk thread for continuous irrigation with sterile normal saline at a rate of 100 to 125 mL/h after surgery (part b). An inner silicone cannula without side aperture was placed into part a, with approximately half the diameter of part a, for connection to a low negative pressure (-10 kPa to -20 kPa) system[28] (part c); B: Passive gravity (PG) drainage. PG drainage is defined as a latex catheter drain that maintains a pathway for fluid to follow from the surgical site by gravity, connected to a liquid storage bag maintained at atmospheric pressure.
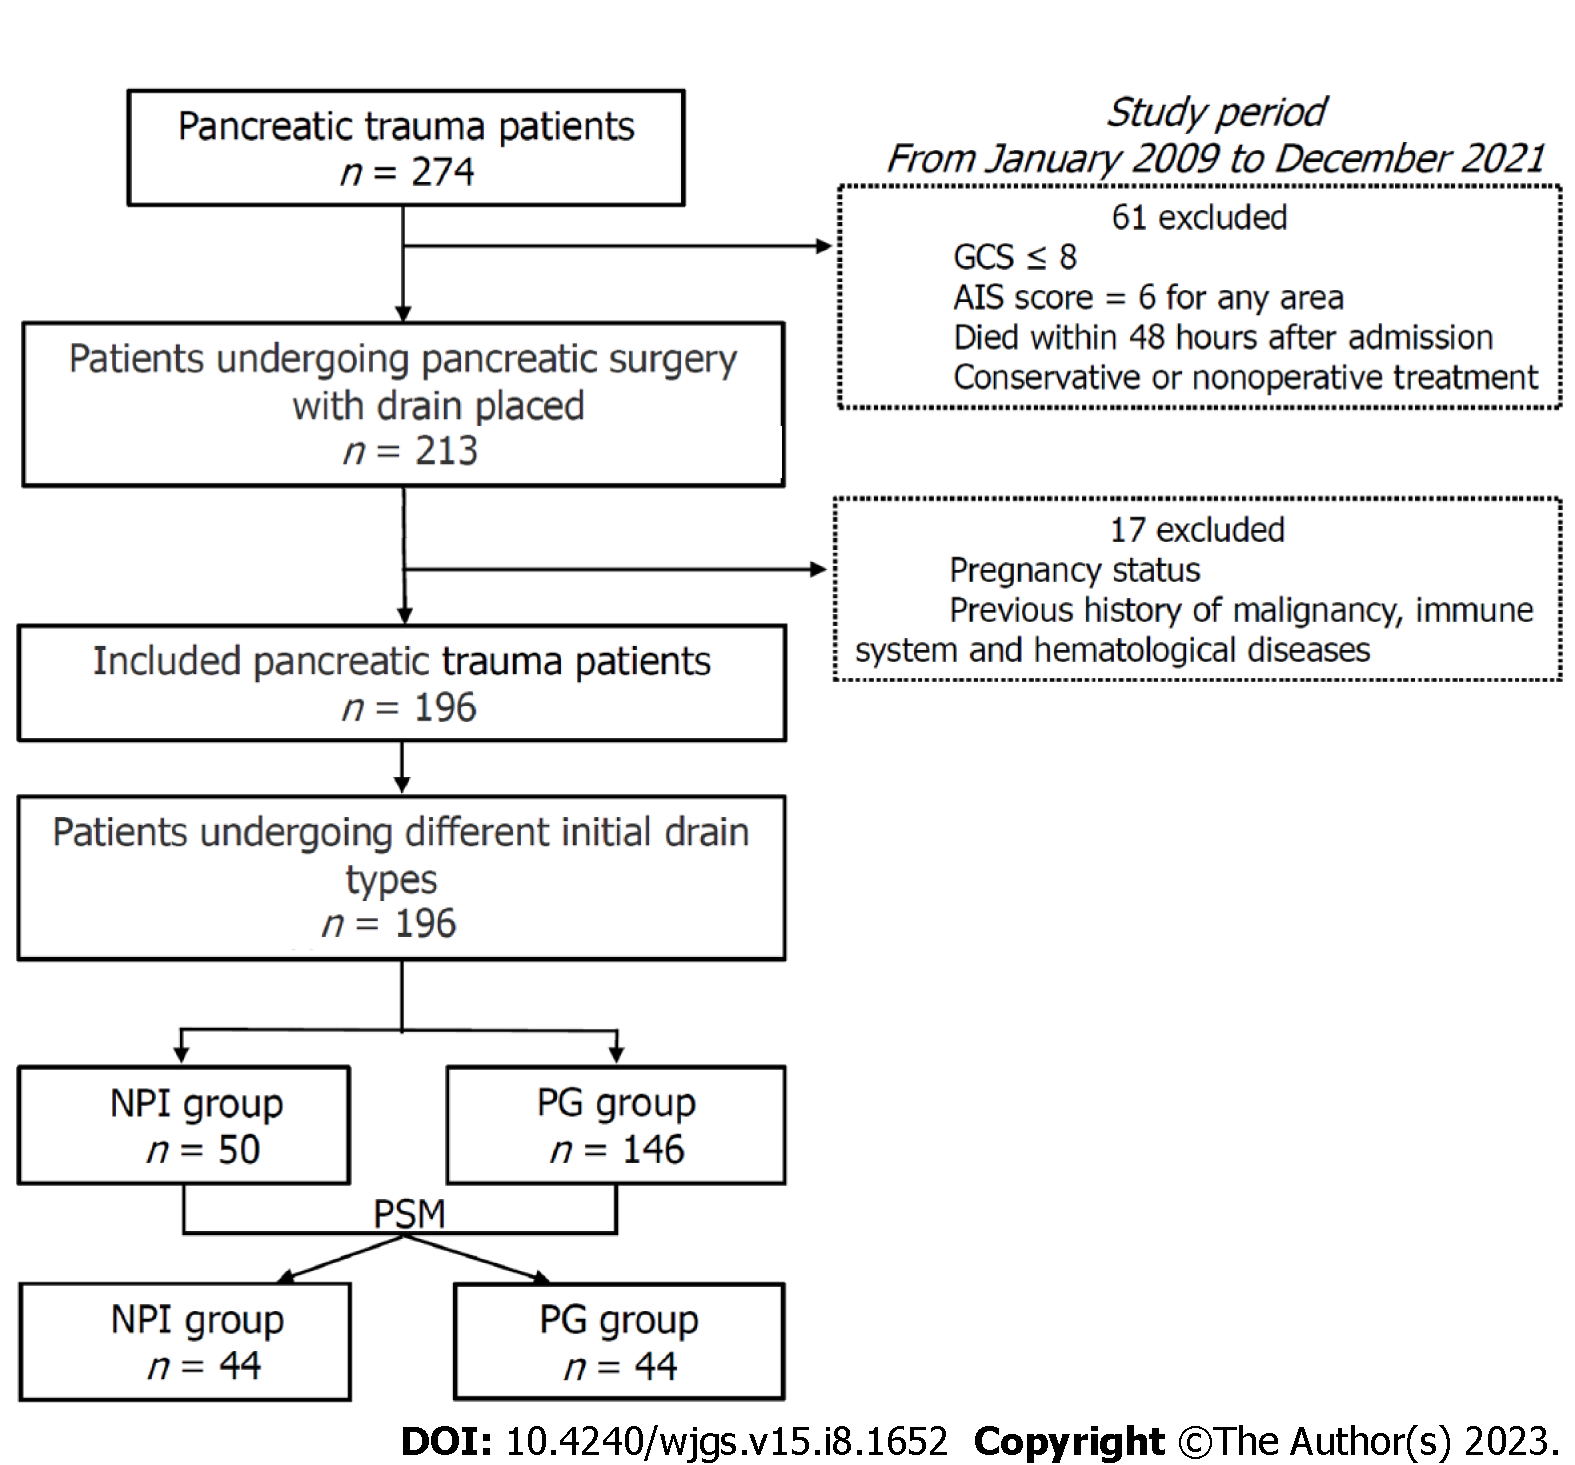
Figure 2 Flow chart of the patient selection process.
GCS: Glasgow coma scale; AIS: Abbreviated injury scale; PG: Passive gravity; NPI: Negative pressure irrigation; PSM: Propensity score matching.
Figure 3 Events of severe complications for passive gravity vs negative pressure irrigation and sensitivity analysis results.
Events of severe complications associated with different drain types are measured as those with a Clavien-Dindo grade ≥ IIIb. PG: Passive gravity; NPI: Negative pressure irrigation; Unadjusted: Univariate logistic regression model; Adjusted: Multivariate logistic regression model; PSM: Propensity score matching; CI: Confidence interval.
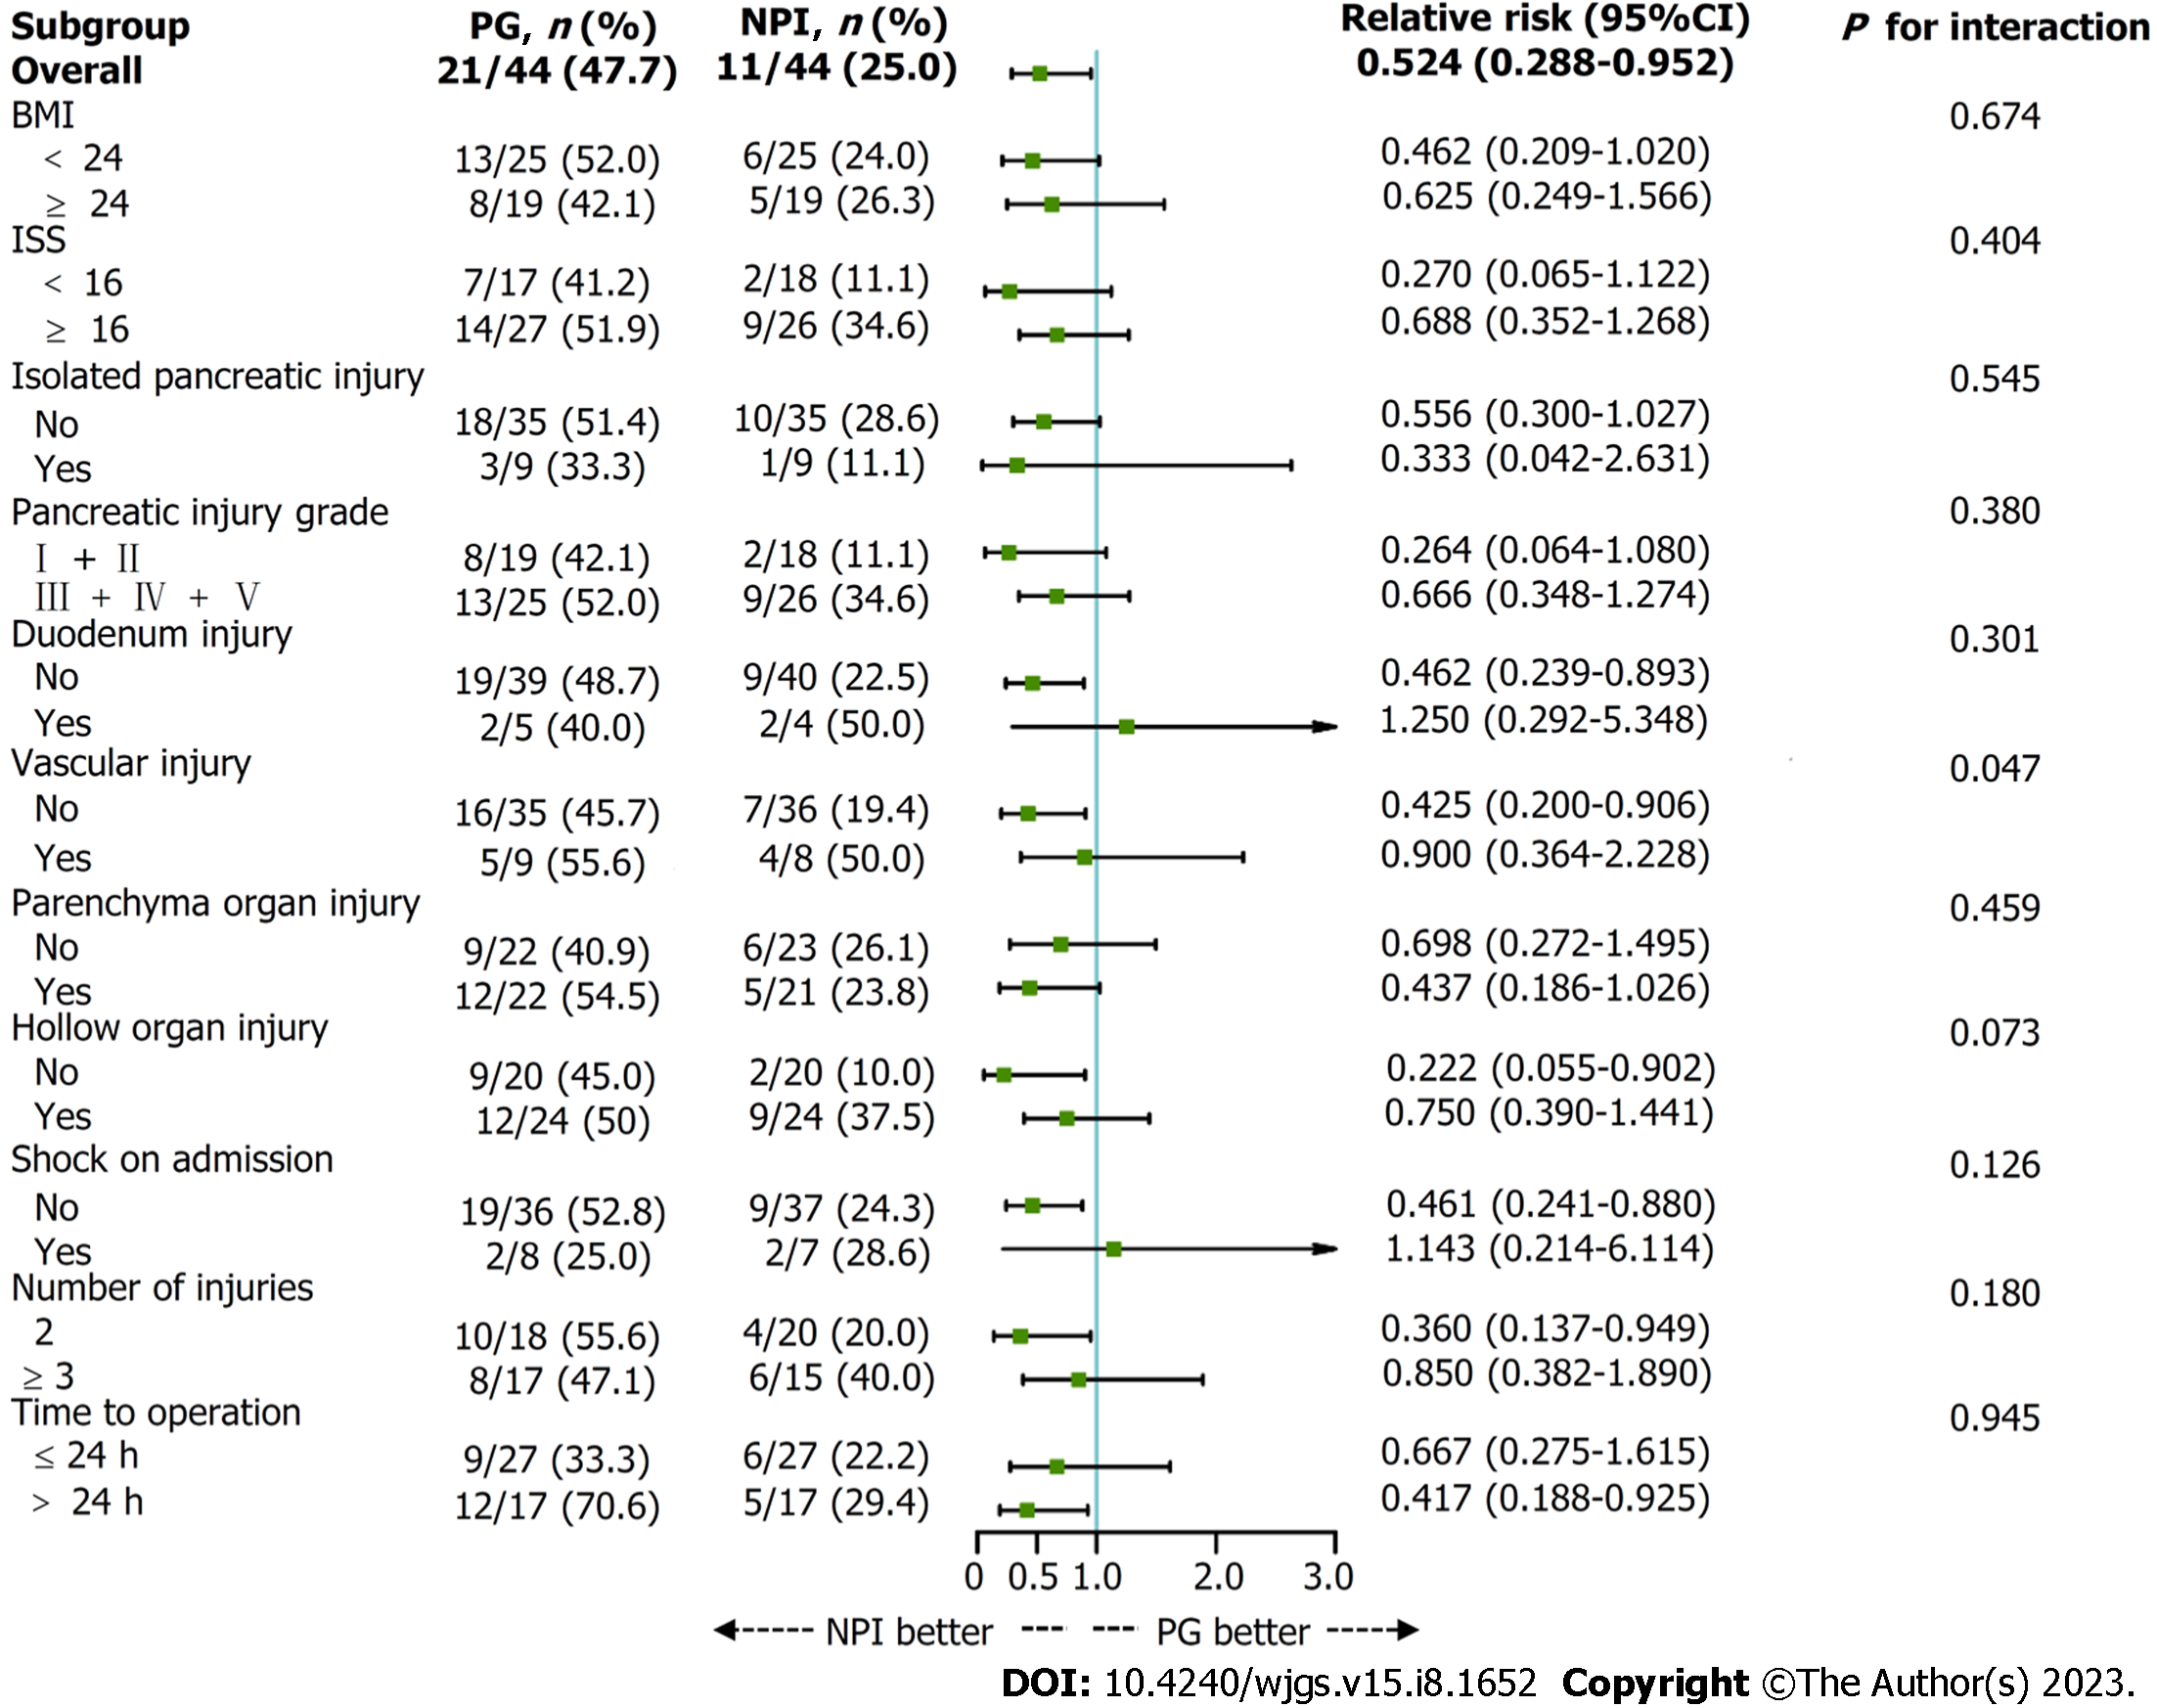
Figure 4 Relative risk for the primary outcomes in prespecified subgroups.
The forest plot presents, for each subgroup, the relative risk of severe complications between different drain types by a square and its 95% confidence interval (CI) by a horizontal line. On the left side of the figure, the subgroup sample size by drain type is presented with the corresponding severe complication rate. The right side of the figure lists the relative risk and its 95%CI; the x-axis of the plot is the risk estimate of severe complications. The last column shows the P values for relative risk interactions between subgroups. Subgroup-specific relative risk was derived from modified Poisson regression. PG: Passive gravity; NPI: Negative pressure irrigation; BMI: Body mass index; ISS: Injury severity score; CI: Confidence interval.
- Citation: Li KW, Wang K, Hu YP, Yang C, Deng YX, Wang XY, Liu YX, Li WQ, Ding WW. Initial suction drainage decreases severe postoperative complications after pancreatic trauma: A cohort study. World J Gastrointest Surg 2023; 15(8): 1652-1662
- URL: https://www.wjgnet.com/1948-9366/full/v15/i8/1652.htm
- DOI: https://dx.doi.org/10.4240/wjgs.v15.i8.1652


