Copyright
©The Author(s) 2023.
World J Gastrointest Surg. Jul 27, 2023; 15(7): 1442-1453
Published online Jul 27, 2023. doi: 10.4240/wjgs.v15.i7.1442
Published online Jul 27, 2023. doi: 10.4240/wjgs.v15.i7.1442
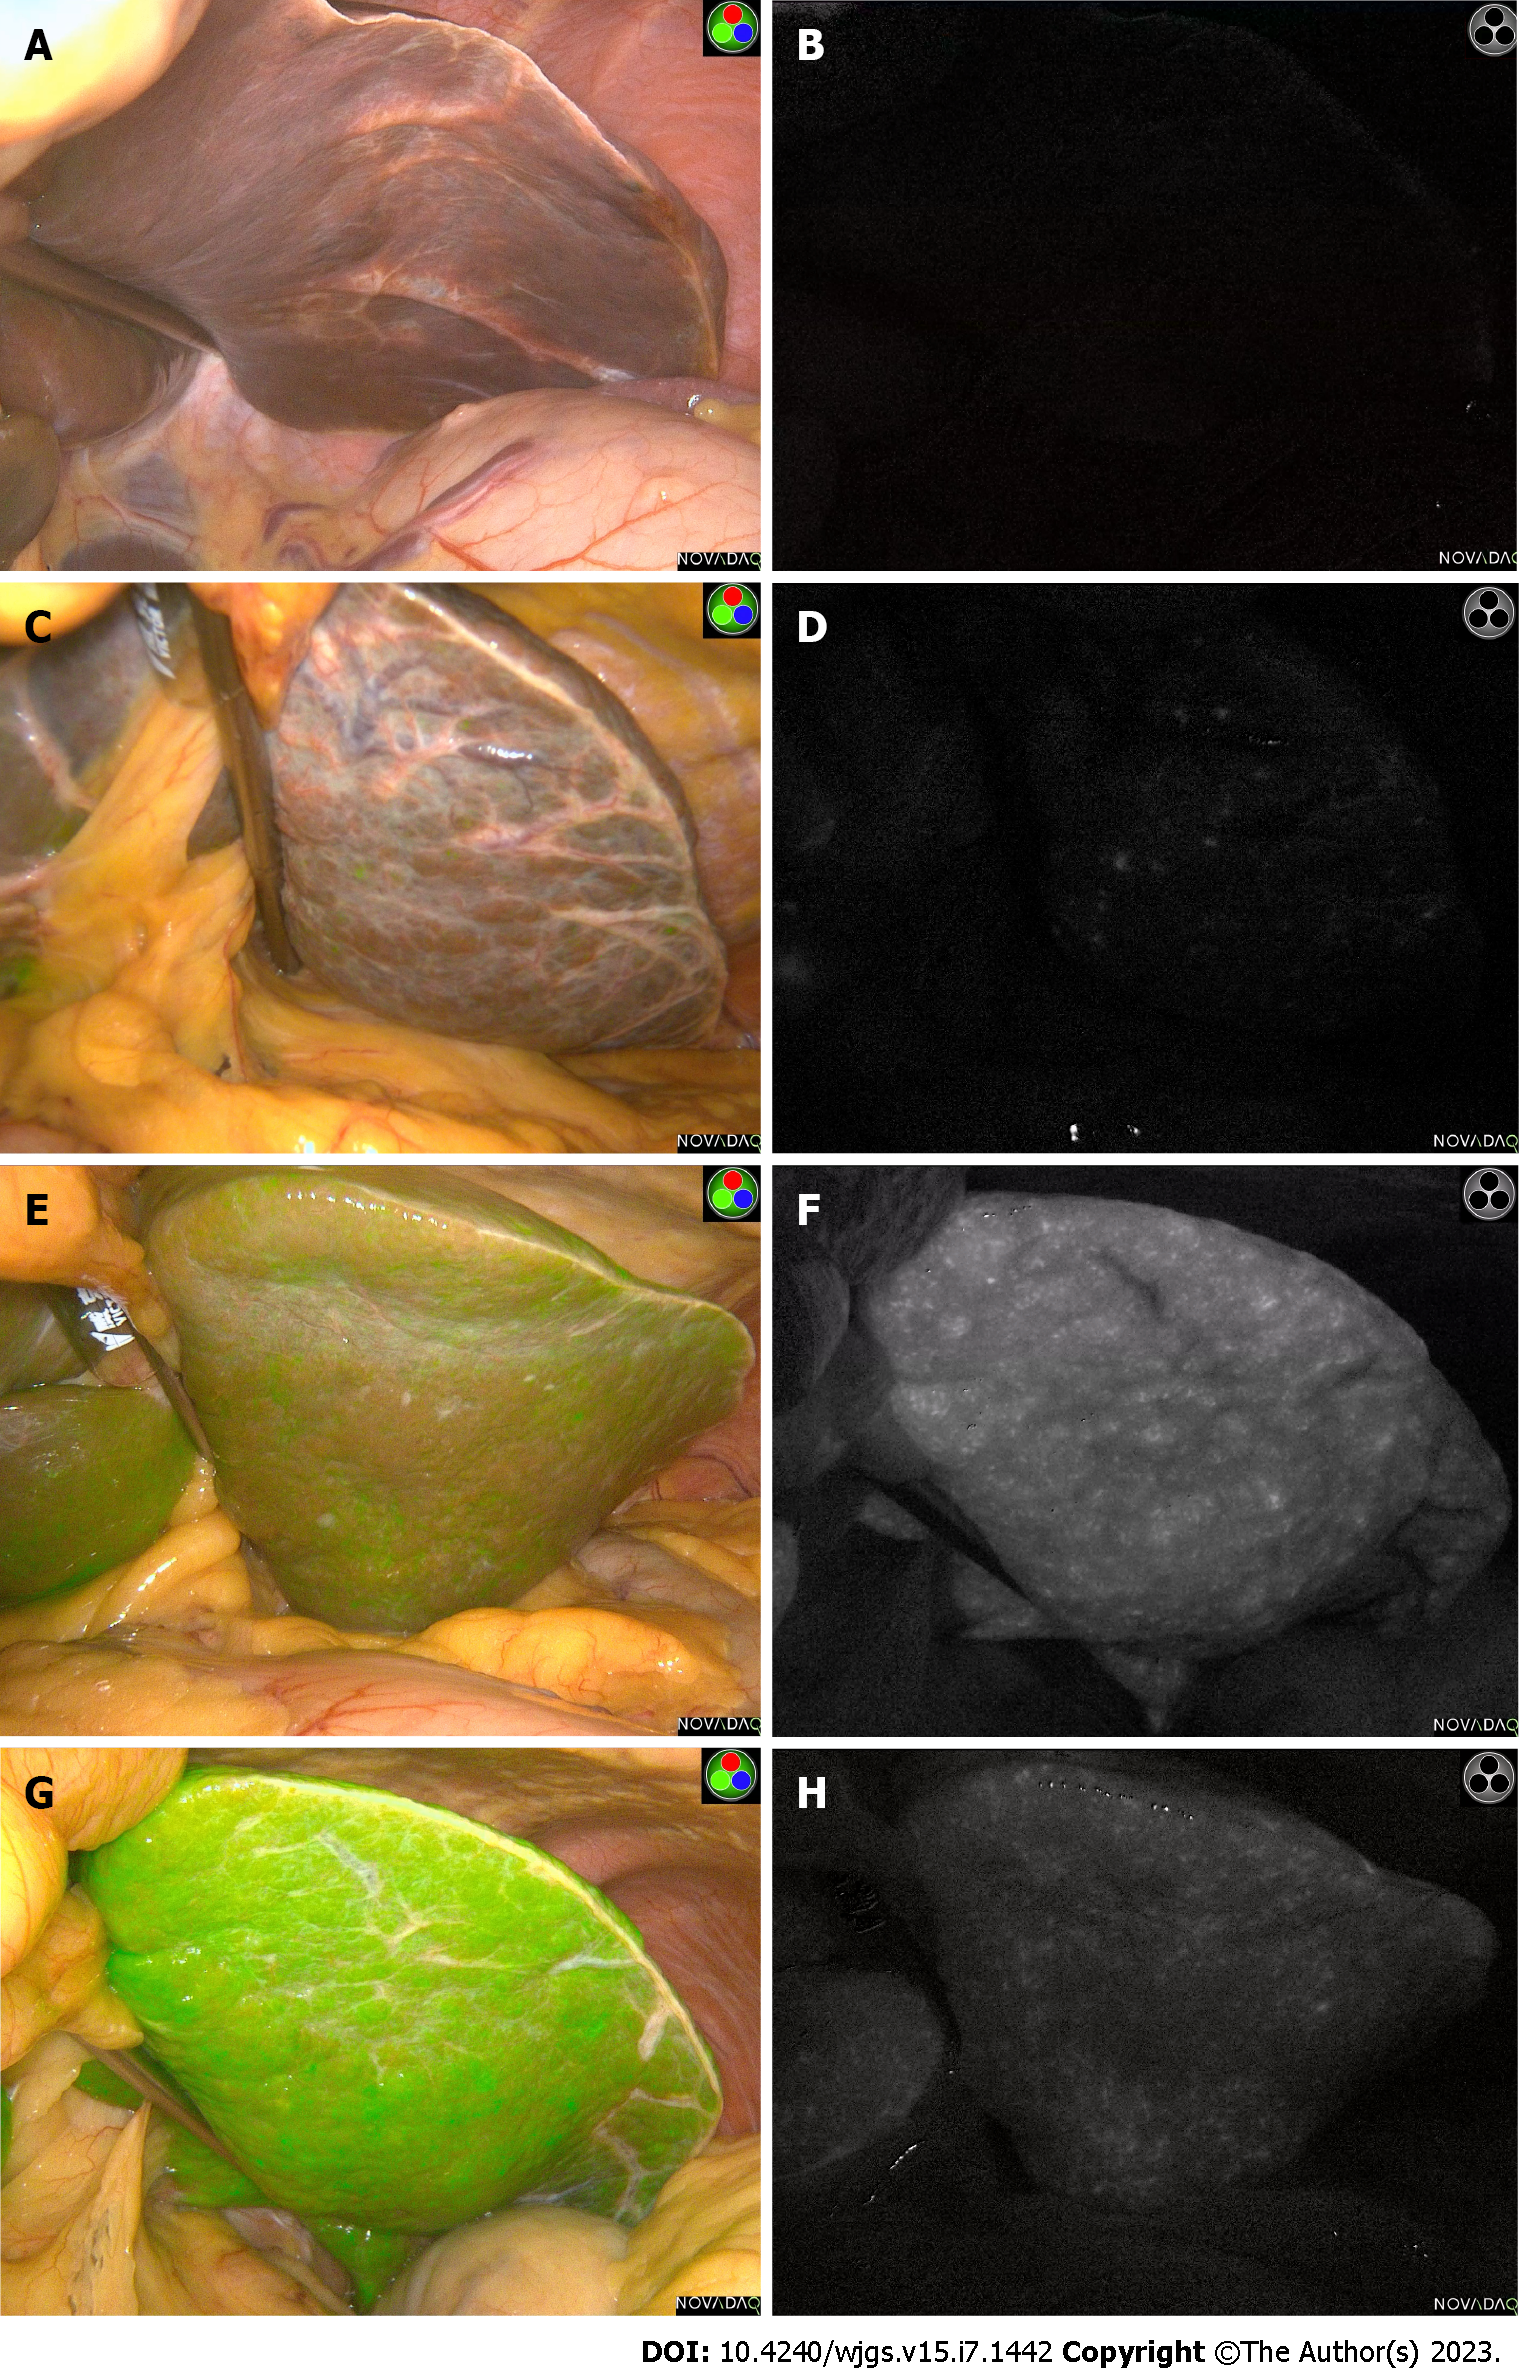
Figure 1 Different liver background fluorescence intensity levels.
A and B: Low fluorescence intensity liver background images of patient 1 in green fluorescence and spy display modes, respectively; C and D: Liver background images of patient 2 with relative low (common) fluorescence intensity in green fluorescence and spy display modes, respectively; E and F: High fluorescence intensity liver background images of patient 3 in green fluorescence and spy display modes, respectively; G and H: Liver background images with extremely high fluorescence intensity of patient 4 in green fluorescence and spy display modes, respectively.
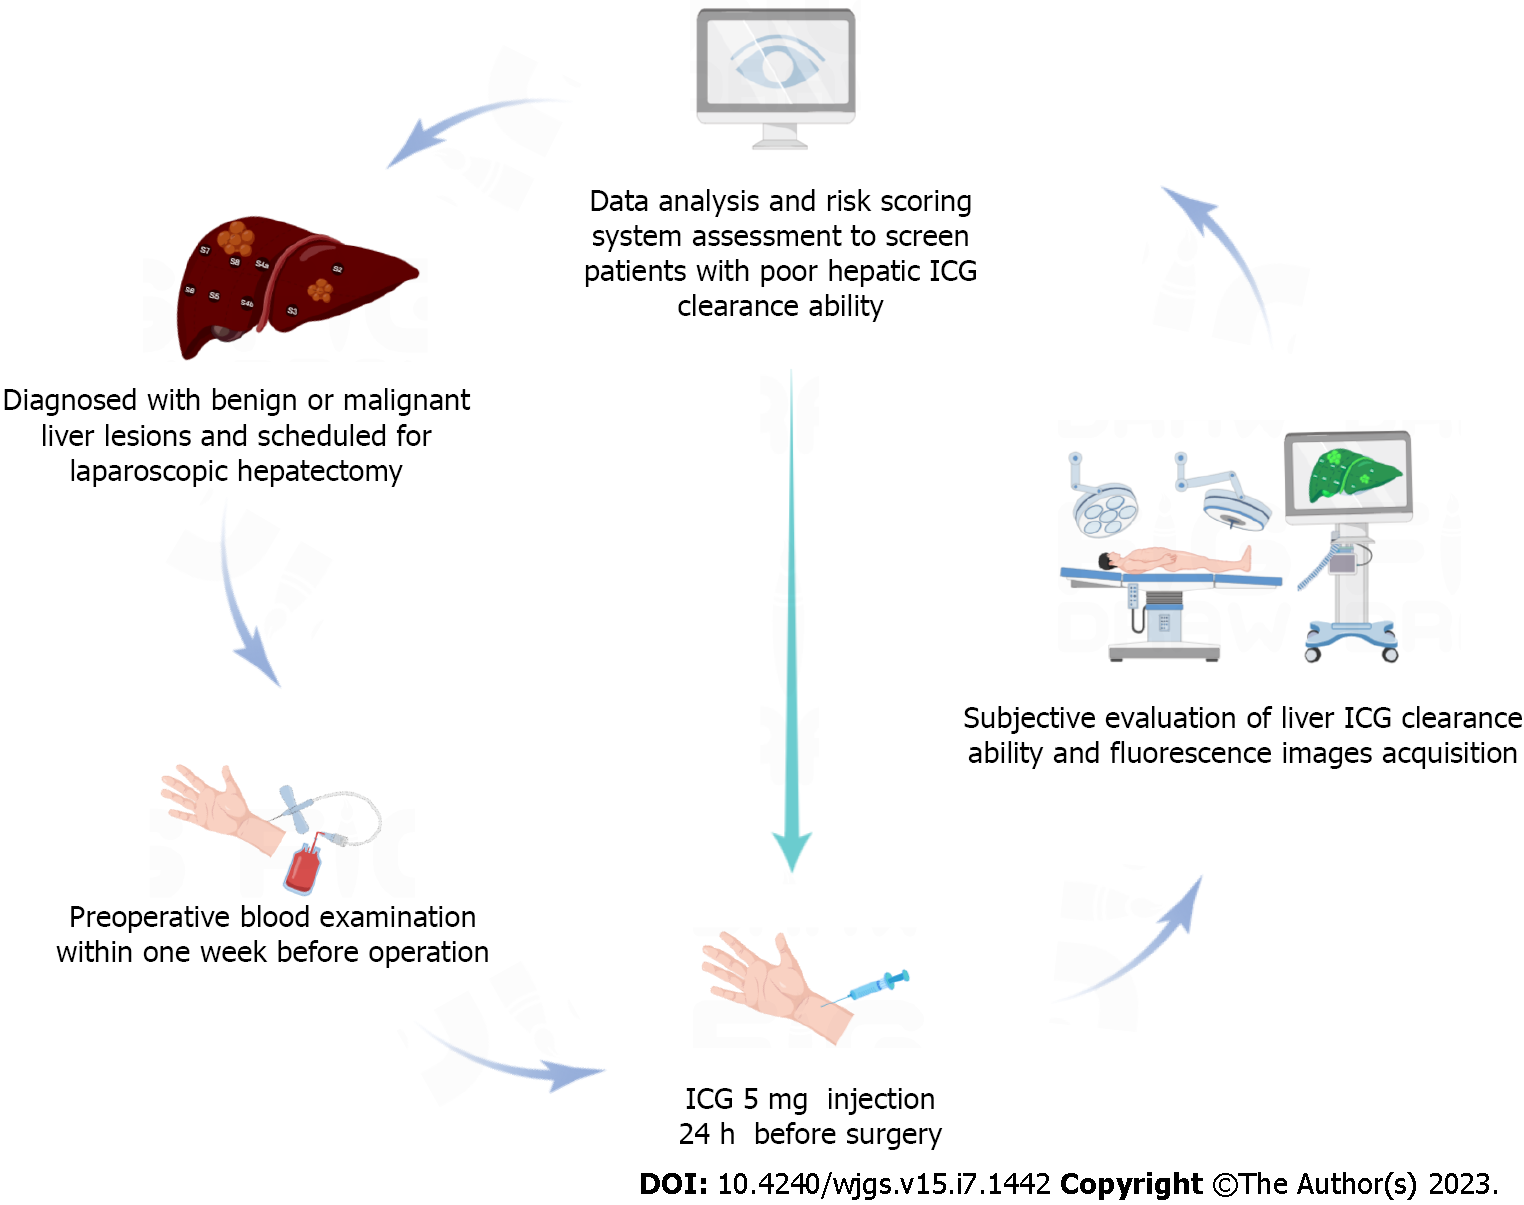
Figure 2 Flow chart of this study.
ICG: Indocyanine green.
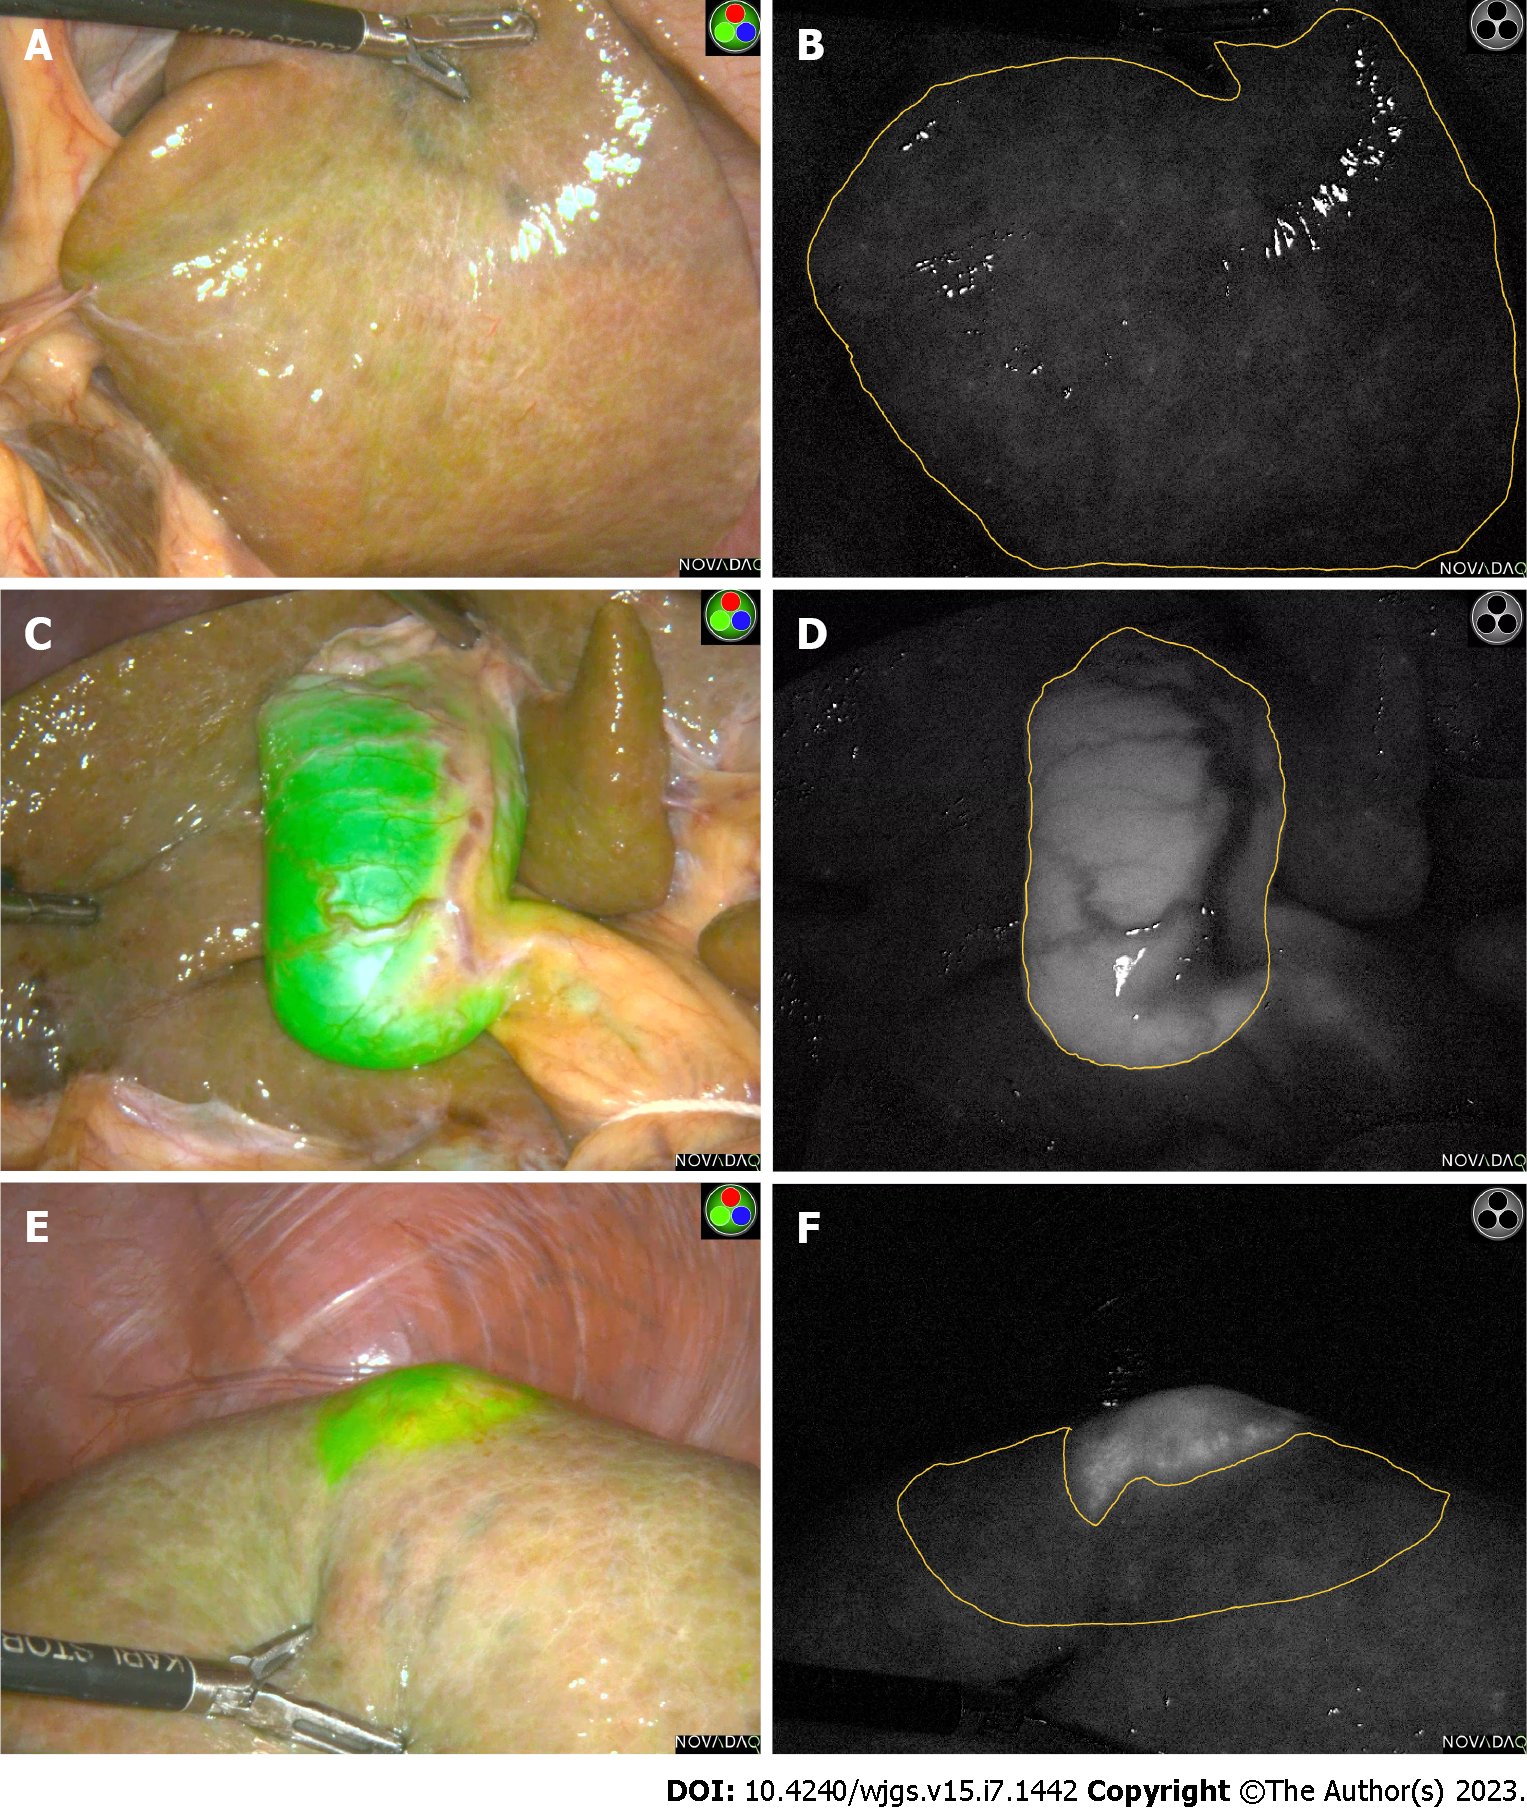
Figure 3 Liver background, gallbladder, Liver tumor in different mode.
A: Liver background in green fluorescence mode; B: Corresponding fluorescence area of liver background in spy mode were manually outlined by two individual investigators; C: Gallbladder in green fluorescence mode; D: Corresponding fluorescence area of gallbladder in spy mode were manually outlined by two individual investigators; E: Liver tumor in green fluorescence mode; F: Corresponding fluorescence area of liver tumor in spy mode were manually outlined by two individual investigators.
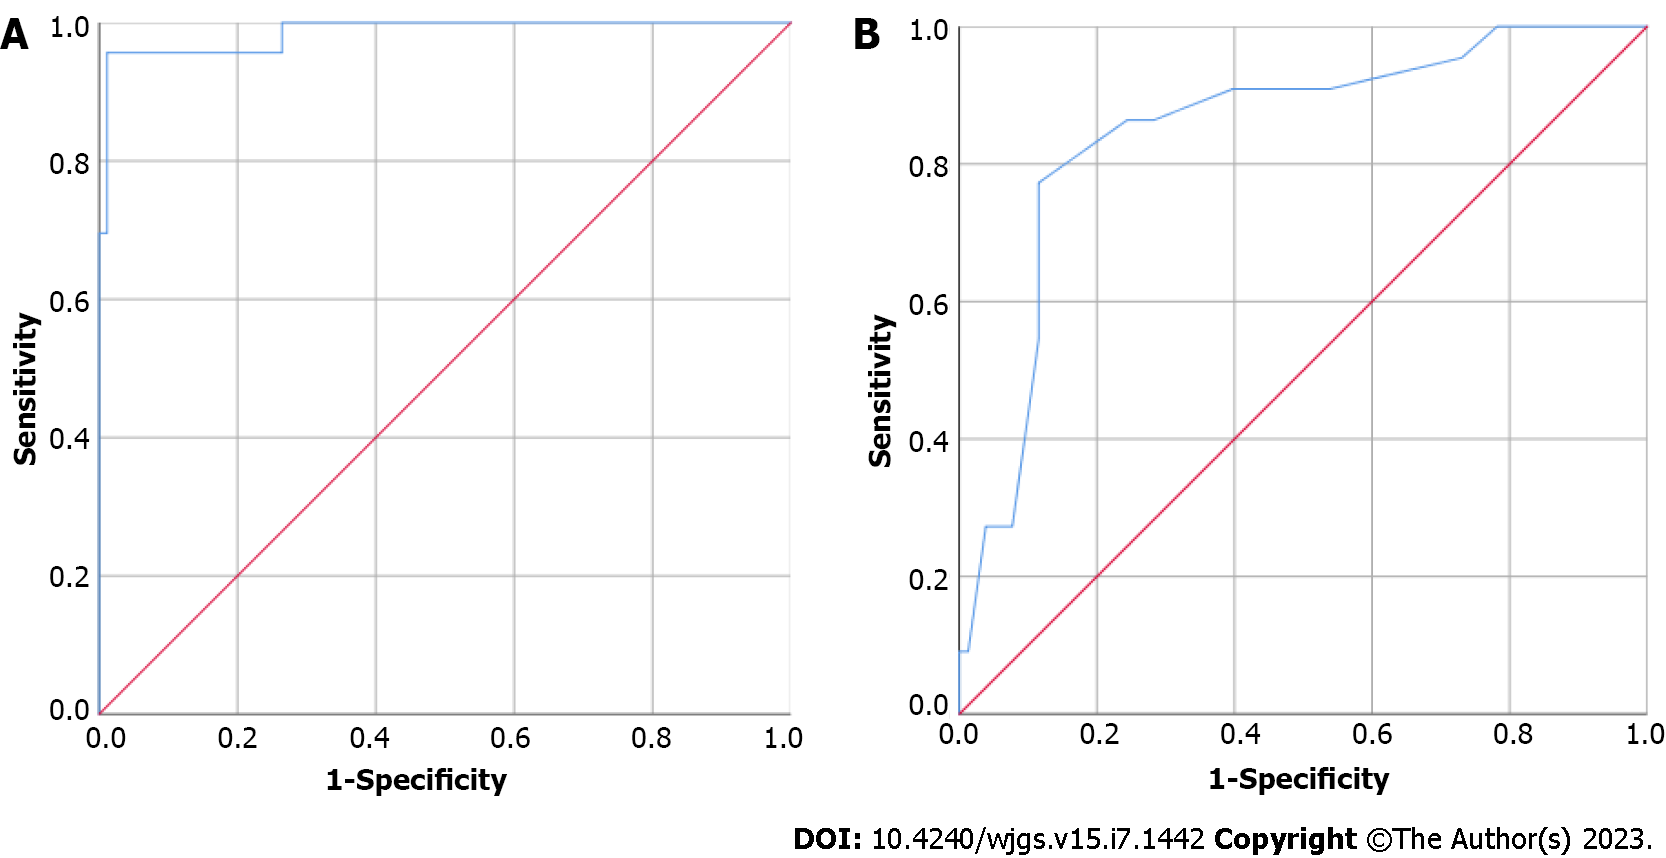
Figure 4 Receiver operating characteristic curves.
A: Receiver operating characteristic (ROC) curve of fluorescence intensity of liver background (FI-LB) and liver indocyanine green clearance ability (subjective evaluation); B: ROC curve of H value and FI-LB group.
- Citation: Chen ZR, Zeng QT, Shi N, Han HW, Chen ZH, Zou YP, Zhang YP, Wu F, Xu LQ, Jin HS. Laboratory scoring system to predict hepatic indocyanine green clearance ability during fluorescence imaging-guided laparoscopic hepatectomy. World J Gastrointest Surg 2023; 15(7): 1442-1453
- URL: https://www.wjgnet.com/1948-9366/full/v15/i7/1442.htm
- DOI: https://dx.doi.org/10.4240/wjgs.v15.i7.1442


