Copyright
©The Author(s) 2023.
World J Gastrointest Surg. Jun 27, 2023; 15(6): 1178-1190
Published online Jun 27, 2023. doi: 10.4240/wjgs.v15.i6.1178
Published online Jun 27, 2023. doi: 10.4240/wjgs.v15.i6.1178
Figure 1 Logistic regression analysis of aggressive factors.
A: Risk analysis of metastasis; B: Risk analysis of higher staging. PHG: Pancreatic head group; PBTG: Pancreatic body/tail group; OR: Odds ratio.
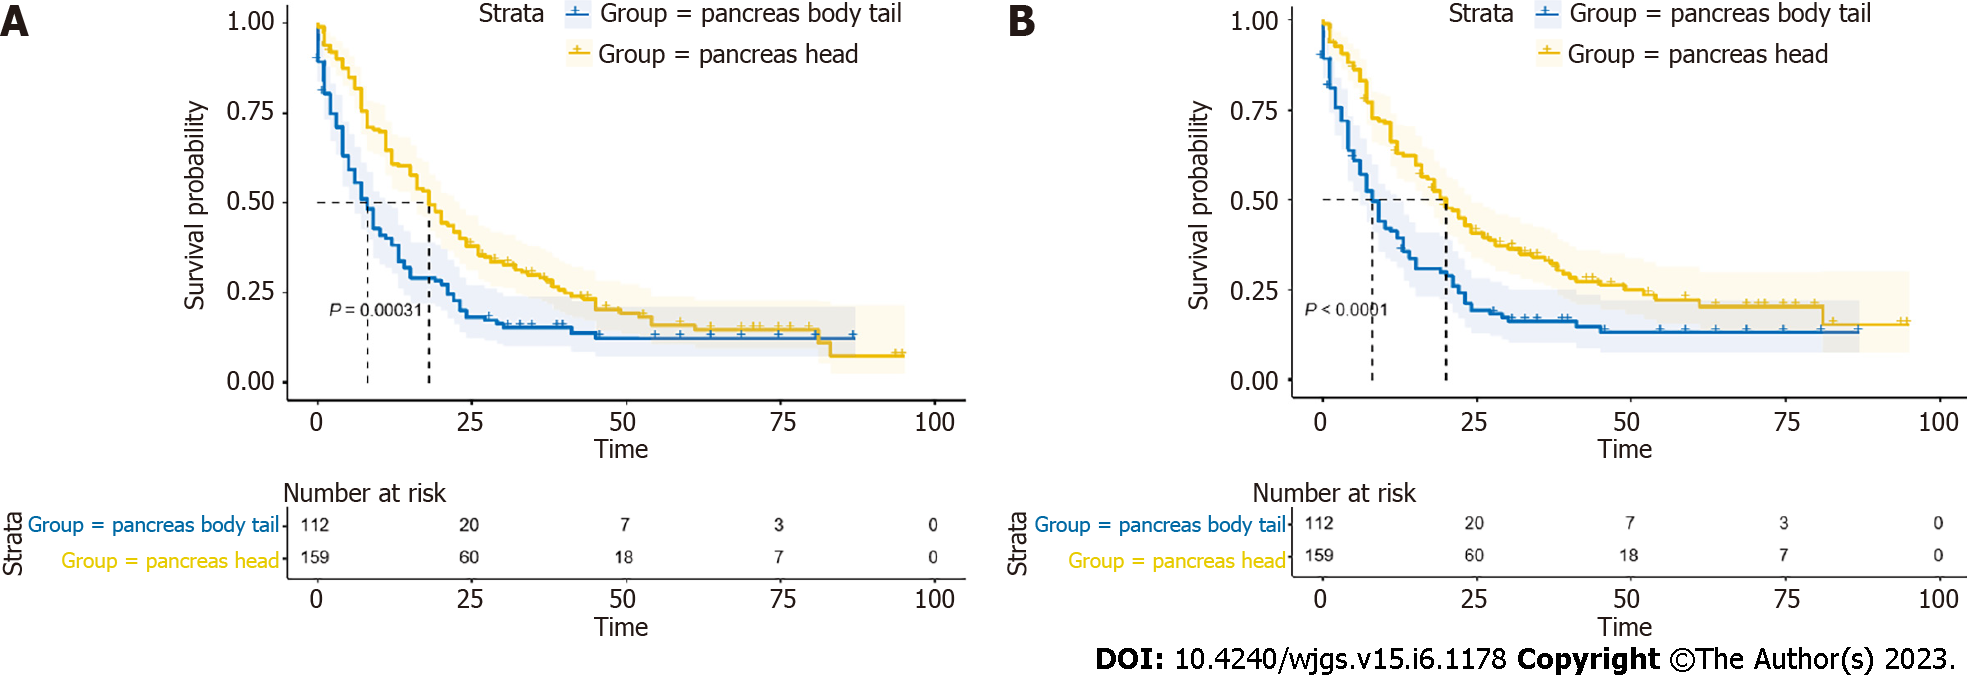
Figure 2 Kaplan-Meier survival analysis of the two groups.
A: Analysis for overall survival; B: Analysis for cancer-specific survival.
Figure 3 Kaplan-Meier survival analysis of the two groups without surgical resection.
A: Analysis for overall survival; B: Analysis for cancer-specific survival.
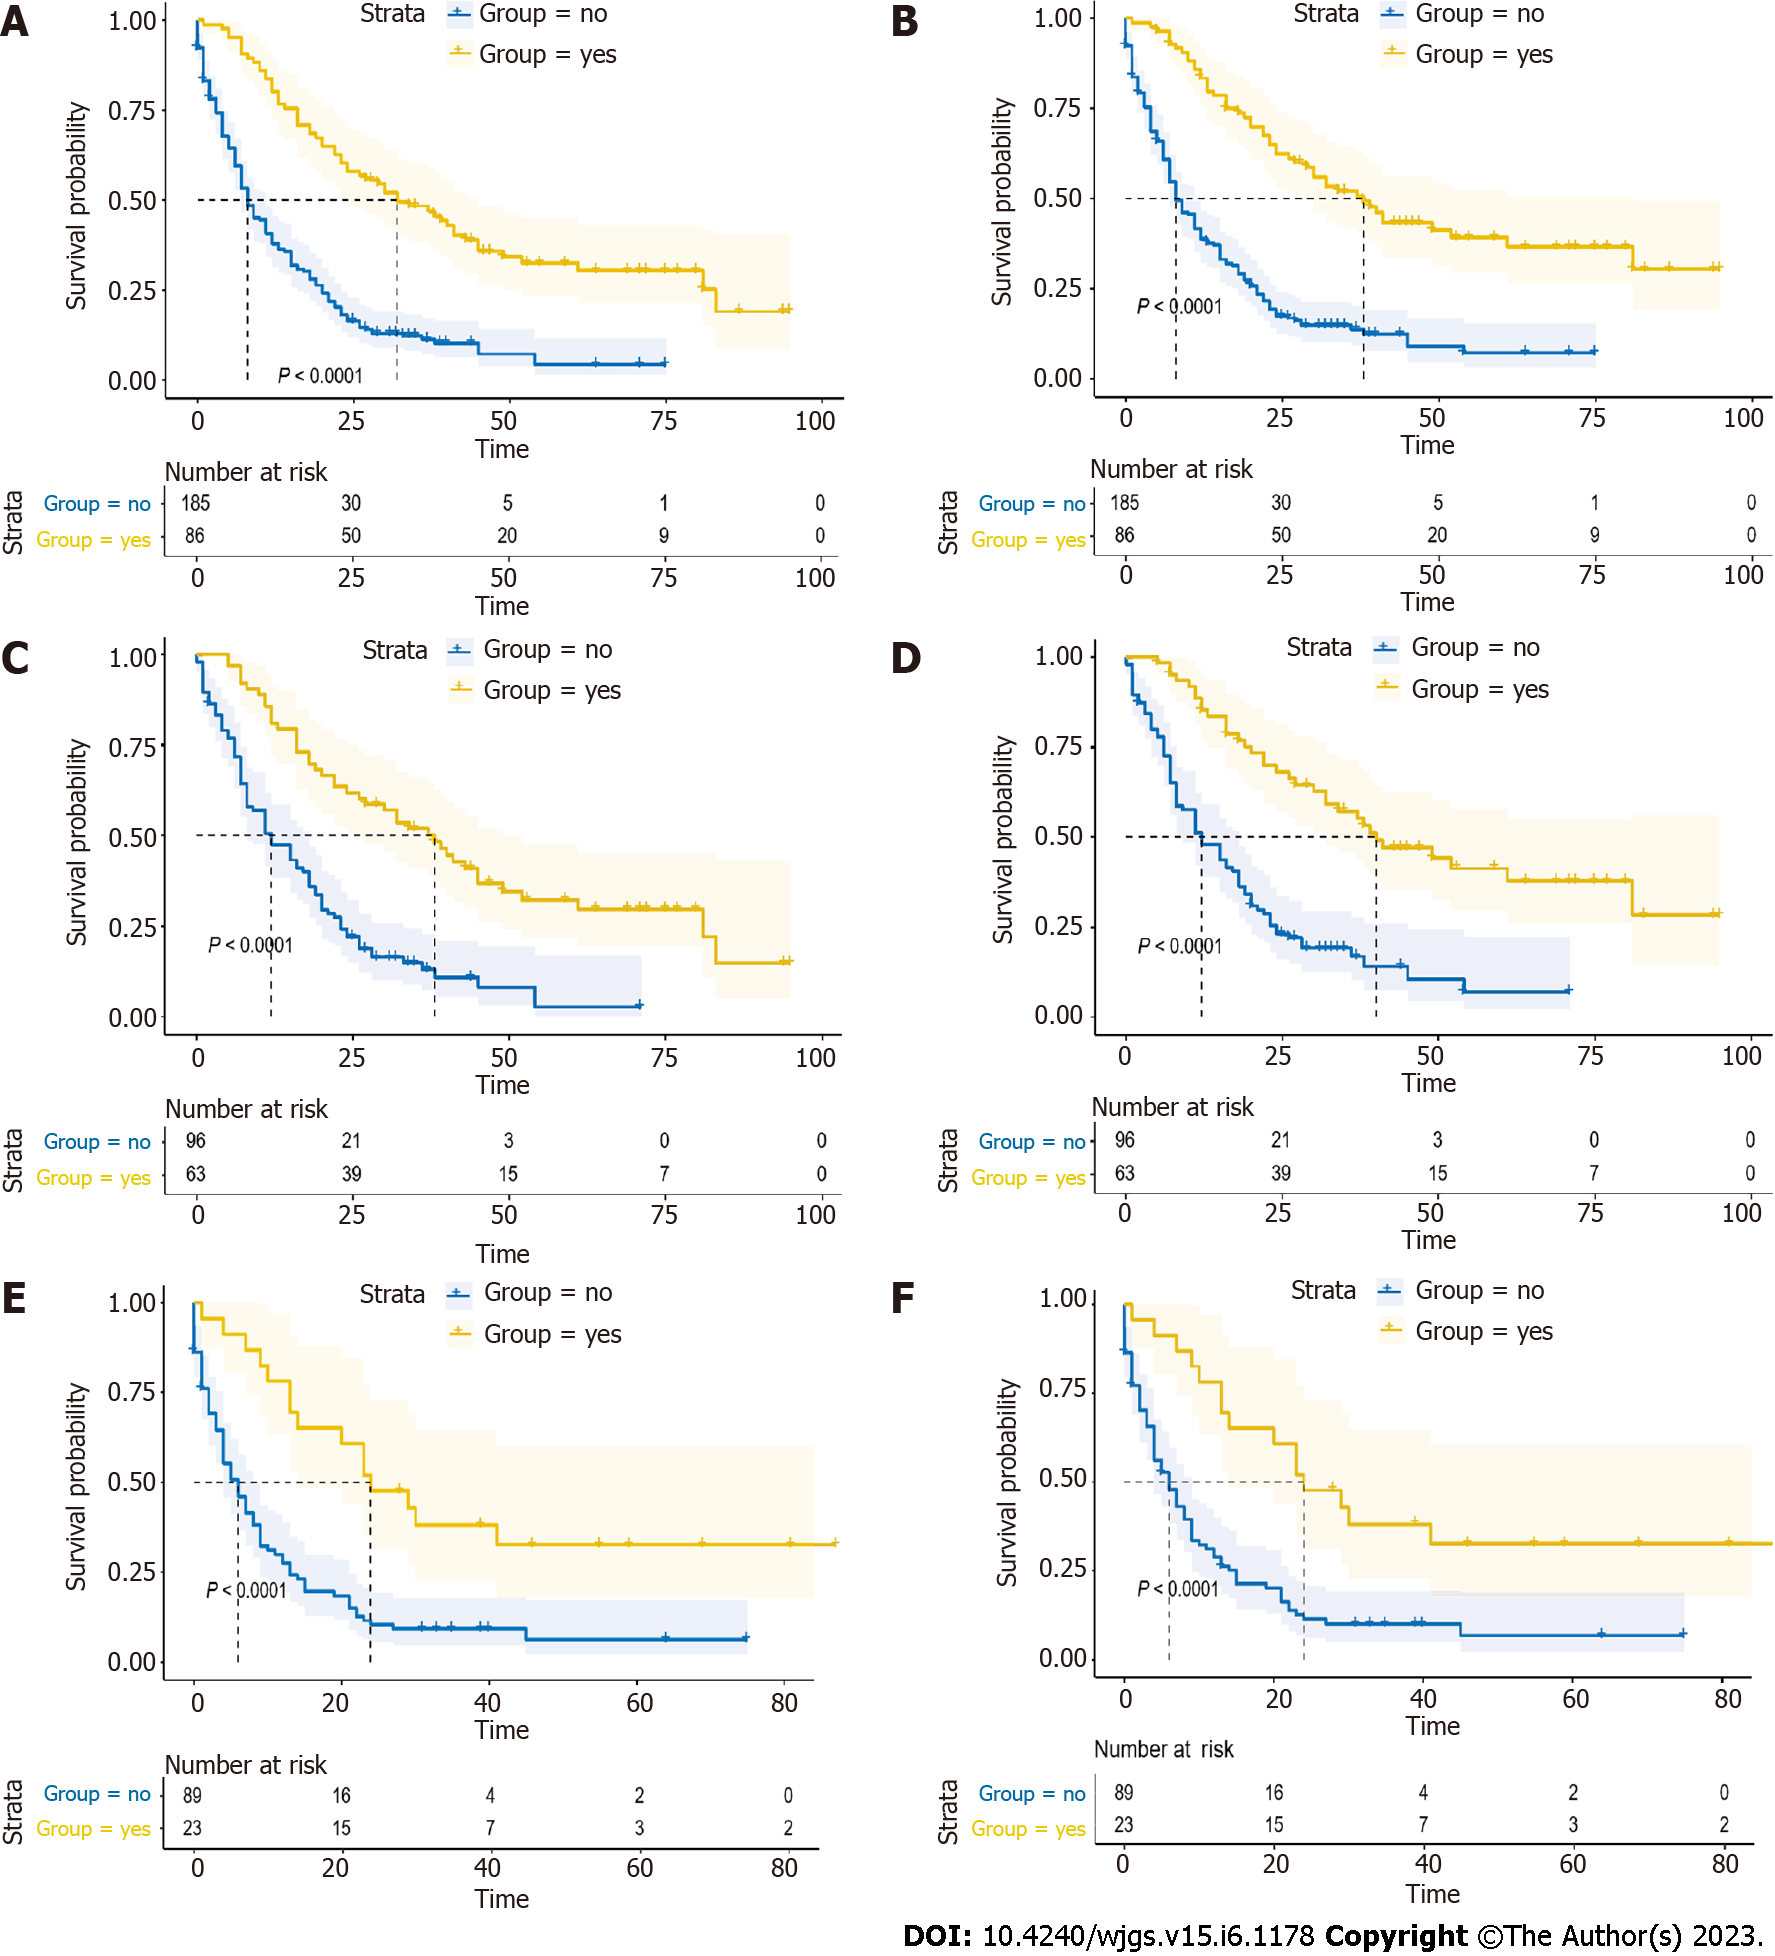
Figure 4 Analysis of systemic therapy.
Survival of patients receiving and not receiving systemic therapy (A: Overall survival; B: Cancer-specific survival). Survival of pancreatic head group patients with and without systemic therapy (C: Overall survival; D: Cancer-specific survival). Survival of pancreatic body/tail group patients with and without systemic therapy (E: Overall survival; F: Cancer-specific survival).
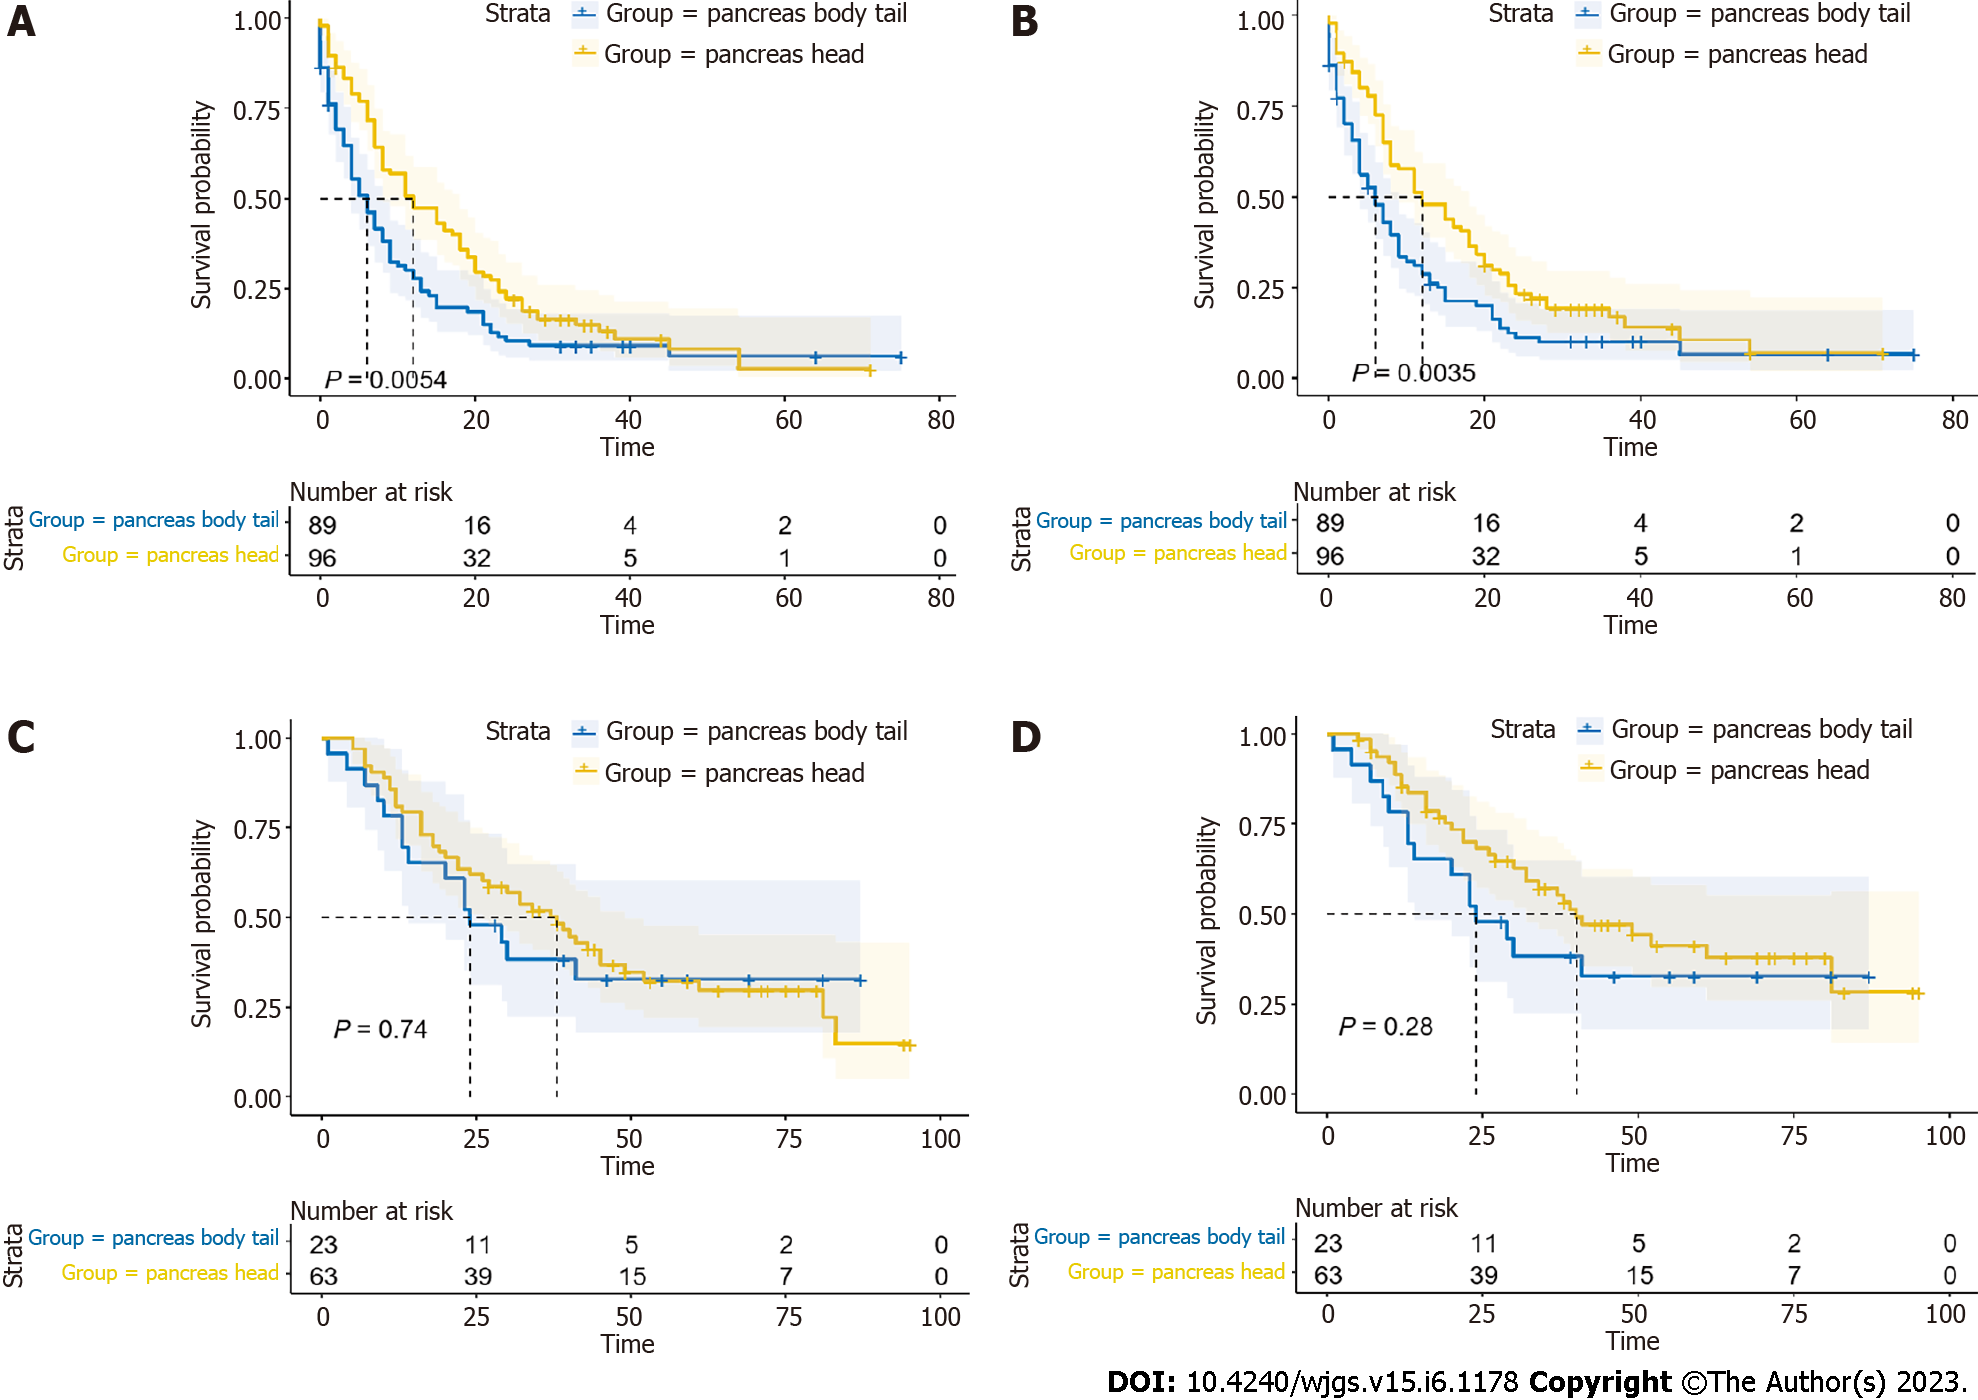
Figure 5 Survival analysis of pancreatic head group and pancreatic body/tail group patients without systemic therapy.
(A: Overall survival; B: Cancer-specific survival). Survival analysis of pancreatic head group and pancreatic body/tail group patients with systemic therapy (C: Overall survival; D: Cancer-specific survival).
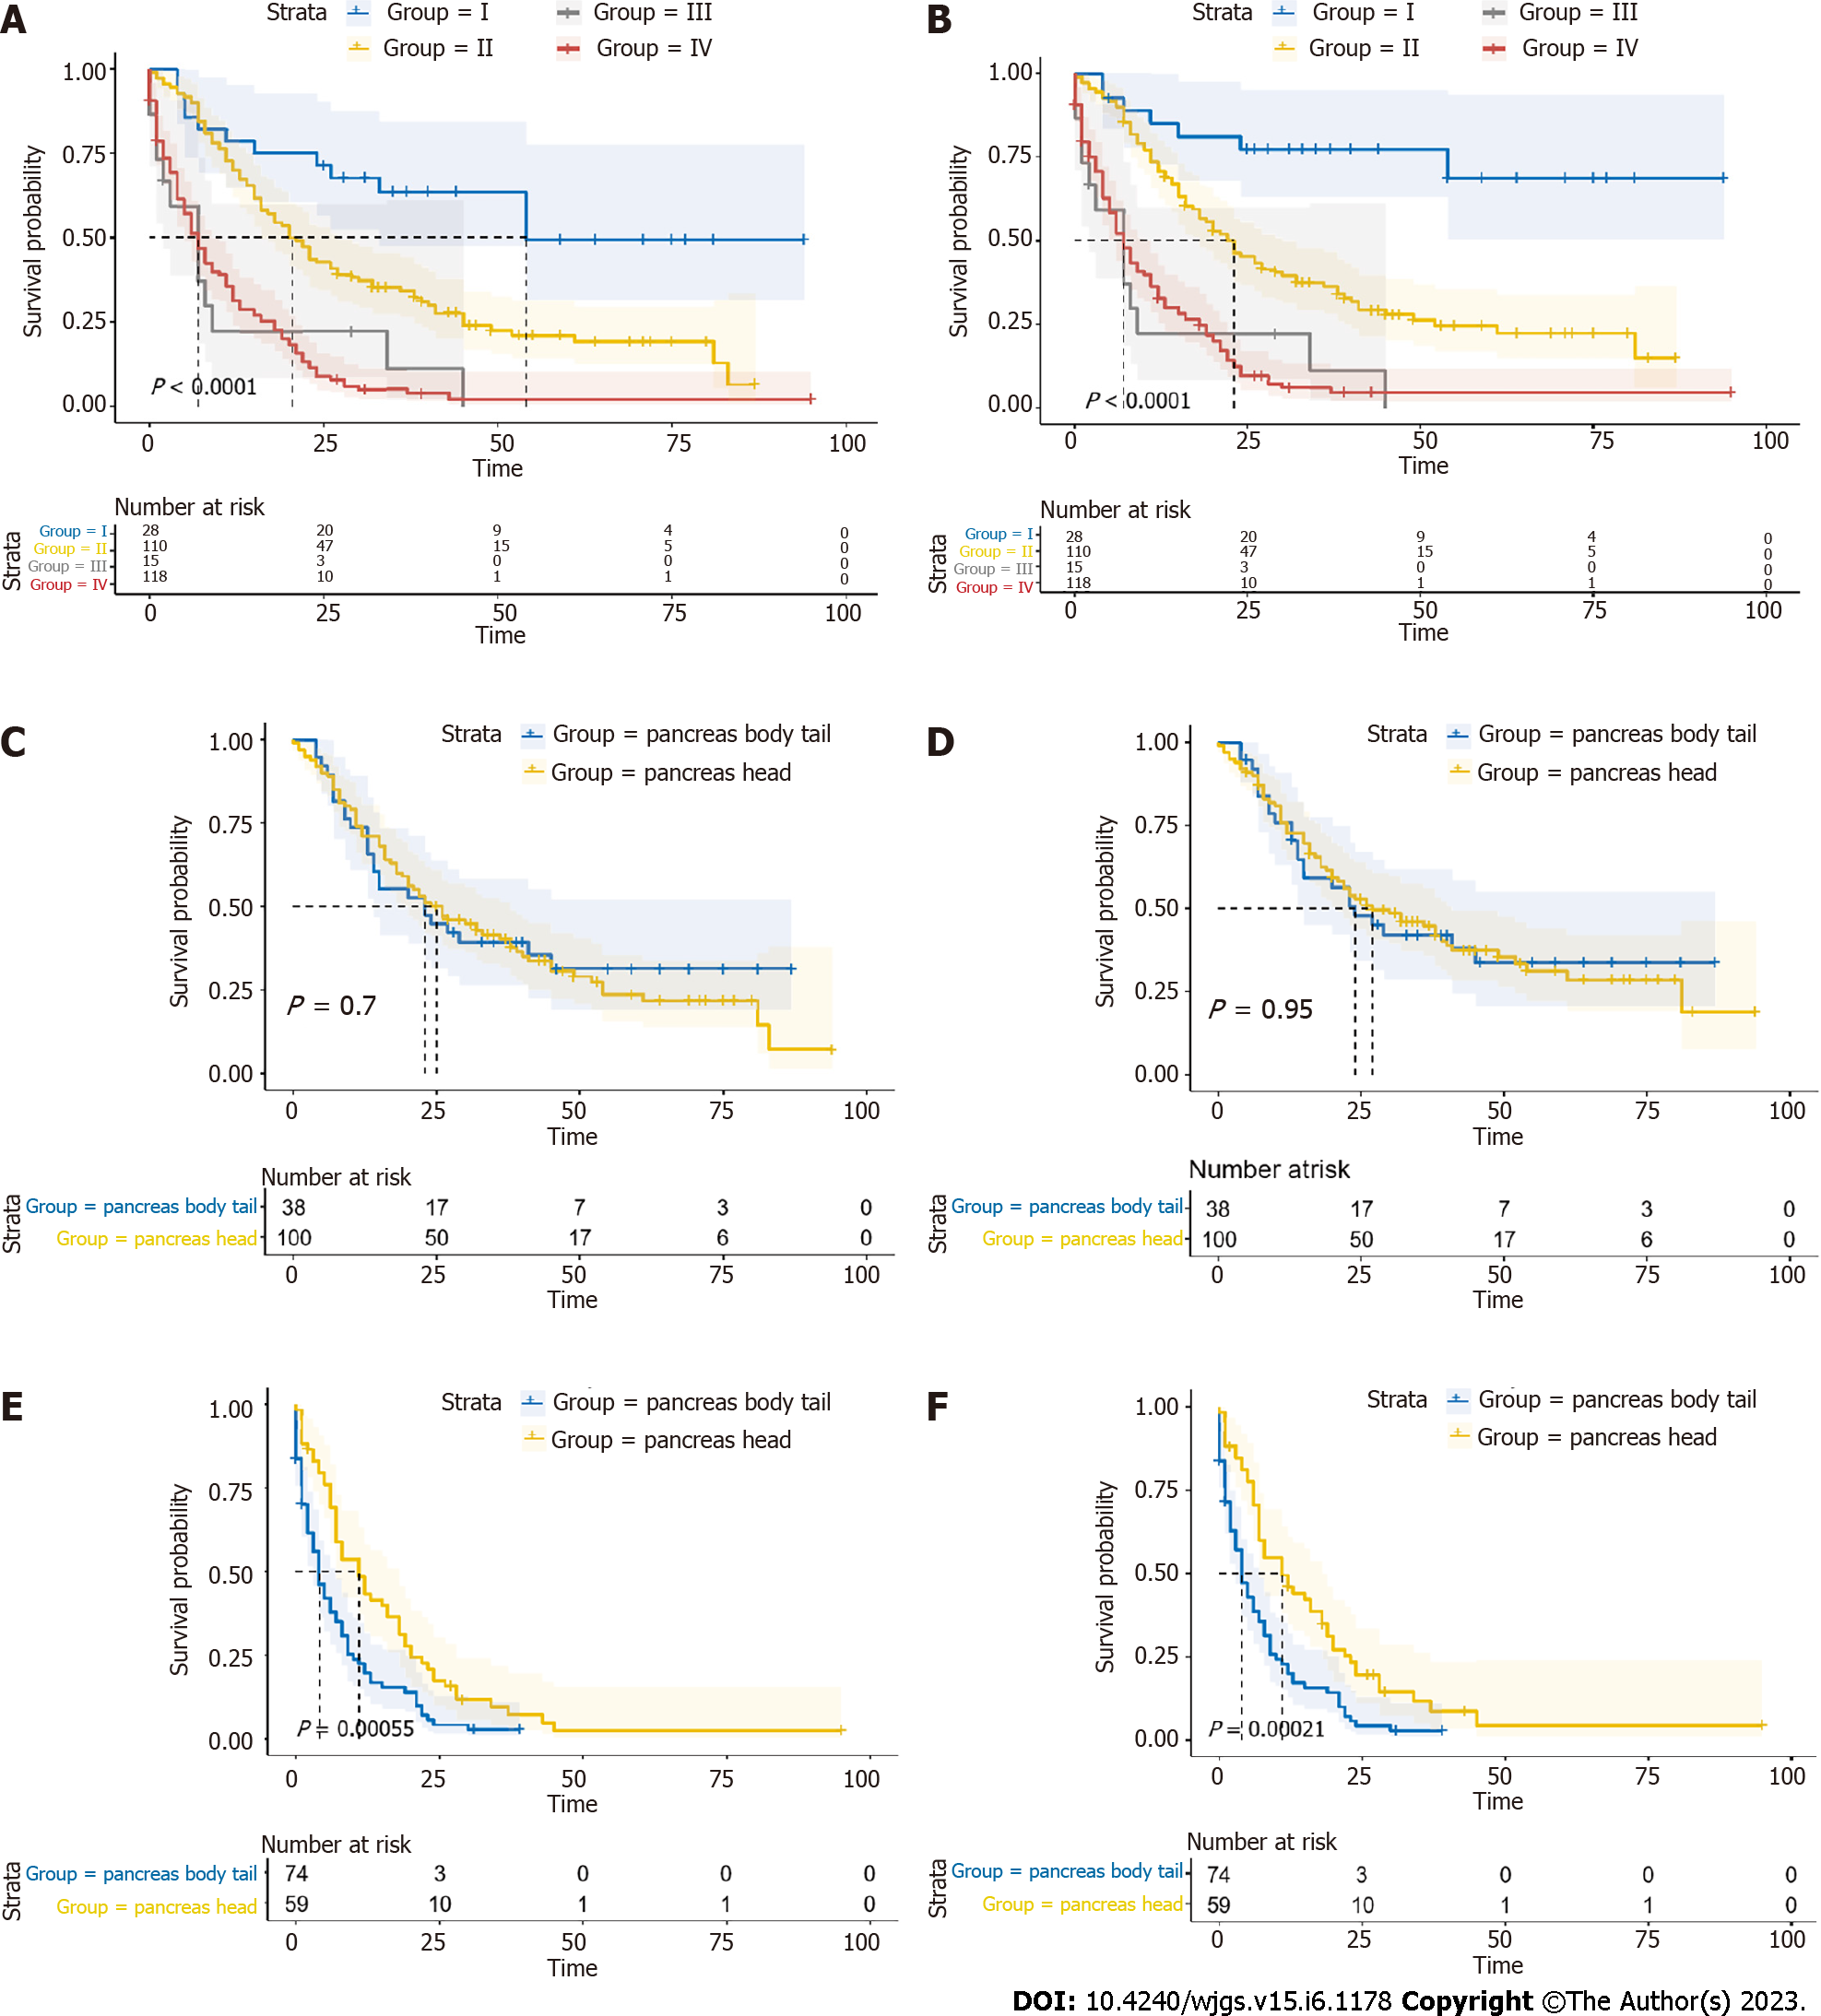
Figure 6 Survival analysis of stages between the two groups.
Survival curves of all patients in stage I-IV (A: Overall survival; B: Cancer-specific survival). Different survival of pancreatic head group (PHG) and pancreatic body/tail group (PBTG) patients in early stage (stage I-II) (C: Overall survival; D: Cancer-specific survival). Different survival of PHG and PBTG patients in advanced stage (stage III-IV) (E: Overall survival; F: Cancer-specific survival).
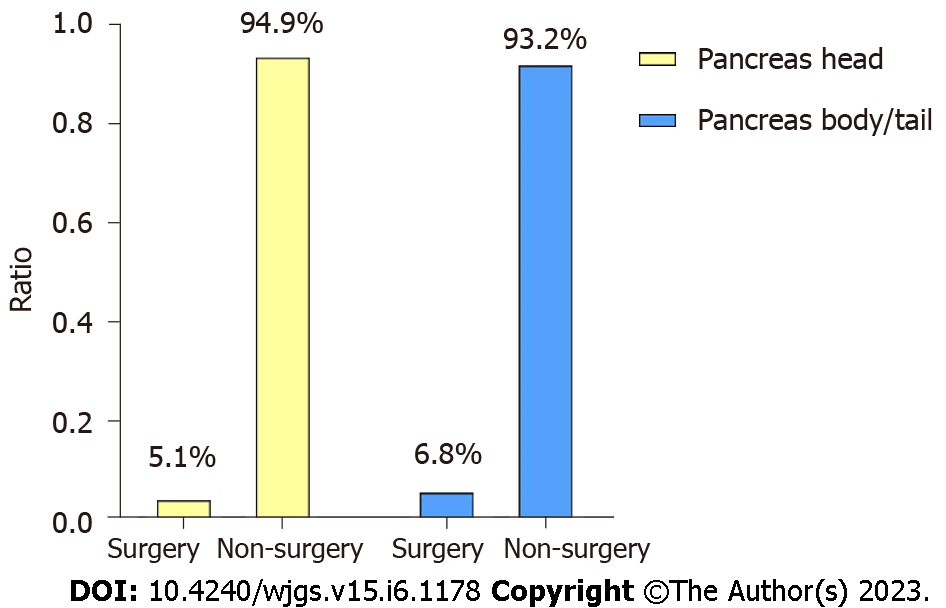
Figure 7 Ratio of surgery in pancreatic head group and pancreatic body/tail group.
- Citation: Li Z, Zhang XJ, Sun CY, Li ZF, Fei H, Zhao DB. Dissimilar survival and clinicopathological characteristics of mucinous adenocarcinoma located in pancreatic head and body/tail. World J Gastrointest Surg 2023; 15(6): 1178-1190
- URL: https://www.wjgnet.com/1948-9366/full/v15/i6/1178.htm
- DOI: https://dx.doi.org/10.4240/wjgs.v15.i6.1178


